Market Overview
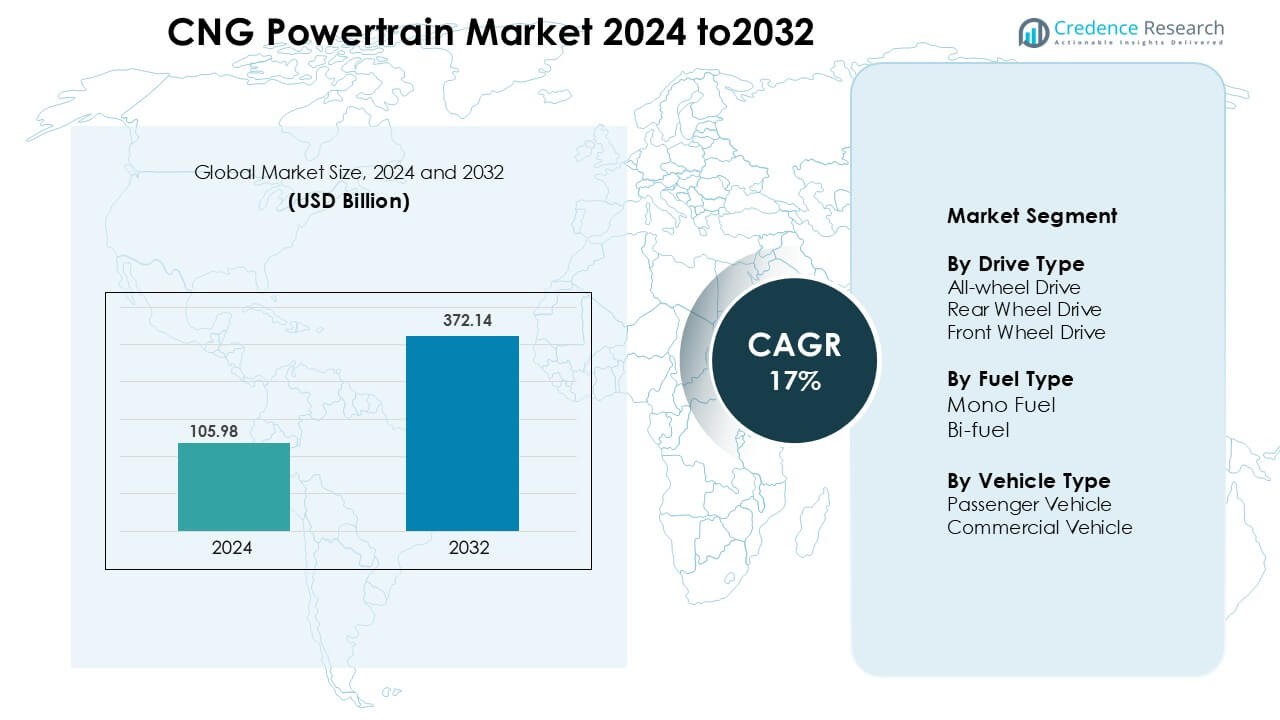
CNG Powertrain Market was valued at USD 105.98 billion in 2024 and is anticipated to reach USD 372.14 billion by 2032, growing at a CAGR of 17 % during the forecast period.
| REPORT ATTRIBUTE |
DETAILS |
| Historical Period |
2020-2023 |
| Base Year |
2024 |
| Forecast Period |
2025-2032 |
| CNG Powertrain Market Size 2024 |
USD 105.98 Billion |
| CNG Powertrain Market, CAGR |
17 % |
| CNG Powertrain Market Size 2032 |
USD 372.14 Billion |
Key players in the global CNG powertrain market include Cummins Inc., Robert Bosch GmbH, Volkswagen AG, Hyundai Motor Company, Honda Motor Company, Ford Motor Company, Maruti Suzuki India Limited, AB Volvo and FPT Industrial S.P.A. These firms compete across vehicle platforms, fuel‑system components and powertrain technologies. The region that leads market share is Asia Pacific, holding over 48 % of global revenue, thanks to its large vehicle base, rising CNG infrastructure and supportive government policies.
Access crucial information at unmatched prices!
Request your sample report today & start making informed decisions powered by Credence Research Inc.!
Download Sample
Market Insights
- The global distribution lines and poles market was valued at USD 105.98 billion in 2025 and is projected to reach USD 372.14 billion by 2035, growing at a CAGR of 17%, with Asia Pacific holding the largest regional share led by India and China, while the Voltage > 33 kV segment accounts for about 48 % of total demand.
- Increasing electricity consumption, electrification of rural regions, and infrastructure modernisation programmes are the primary drivers, supported by government investments in grid reliability and renewable integration.
- Market trends include adoption of composite and fibre-reinforced poles, use of IoT-enabled smart infrastructure, and digital twin technologies for predictive maintenance and asset management.
- Competition is intensifying among global and regional manufacturers such as Hitachi Energy, RS Technologies, and StressCrete Group focusing on advanced materials, modular pole design, and strategic project collaborations.
- High initial installation costs, logistical challenges in remote terrains, and slow regulatory approvals remain key restraints limiting faster deployment in certain regions.
Market Segmentation Analysis
By Drive Type
The drive‑type segment of the CNG powertrain market is led by the front‑wheel drive (FWD) sub‑segment, which held approximately 58 % of the market in 2023 FWD dominance stems from its suitability for compact and mid‑sized vehicles, offering cost efficiency, lighter weight and better fuel economy in CNG configurations. The growth is driven by urban vehicle demand, OEM focus on cost‑sensitive architectures and rising acceptance of CNG in passenger vehicle fleets.
- For instance, Maruti Suzuki’s factory-fitted WagonR S-CNG uses a dual interdependent ECU layout with an Intelligent Injection System, carries a total CNG tank capacity of 60 litres (water equivalent) and is ARAI-rated at 34.05 km per kg on the CNG variant.
By Fuel Type
In the fuel‑type segmentation of the CNG powertrain market, the bi‑fuel (CNG + gasoline/diesel) sub‑segment dominates, with a share of around 80 % in earlier years and projected 68.9 % by 2025. The bi‑fuel sub‑segment’s dominance arises from its flexibility, enabling usage on both conventional and CNG fueling infrastructure, making it attractive to fleet operators and markets with dual‑fuel availability. This mix supports infrastructure constraints, reduces range anxiety and aligns with regulatory emission mandates.
- For instance, Hyundai Motor India’s Grand i10 Nios CNG is equipped with a 1.2-litre bi-fuel engine capable of delivering 50 kW power output in CNG mode and incorporates a 60-litre (water equivalent) CNG tank.
By Vehicle Type
The vehicle‑type segmentation shows the passenger vehicle sub‑segment commanding over 75 % of revenue share in 2021 and about 61.7 % by 2025. Passenger vehicles drive the CNG powertrain market because consumers increasingly seek cleaner, cost‑efficient personal transport, especially in urban regions where CNG infrastructure is strengthening. Government incentives, lower running costs and growing awareness of low‑emission mobility further propel this segment.
Key Growth Drivers
Stringent Emission Regulations & Clean‑Fuel Mandates
Governments across major regions continue to tighten emission rules to reduce CO₂, NOₓ, and particulate output from road transport. These regulations push industries to adopt cleaner fuels that meet long-term climate and air-quality goals. CNG powertrains gain strong support because compressed natural gas produces fewer harmful emissions than petrol or diesel engines. Many national policies now include specific targets for fleet decarbonisation, which raises interest in low-emission vehicle options. Regulators also promote cleaner public transport, and this boosts CNG adoption in buses, municipal fleets, and last-mile logistics. Clean fuel mandates encourage automakers to expand CNG-compatible models and upgrade existing platforms to meet updated standards.
- For instance, Tata Motors’ Tigor iCNG sedan was developed to comply with India’s BS-VI Phase 2 emission norms.
Lower Total Cost of Ownership for High‑Usage Vehicles
CNG powertrains deliver strong savings for vehicles that run long daily distances. Lower pump prices reduce the fuel bill sharply when compared with petrol or diesel. Many fleet studies report operational savings in the range of 25–40% for high-mileage vehicles that switch to CNG. These savings help operators manage rising fuel expenses and maintain stable monthly budgets. Commercial fleets track running costs closely, so reduced fuel spend improves overall profitability. Ride-share drivers also gain strong value because high daily travel increases the fuel-cost gap. Lower maintenance needs add extra benefit, as CNG engines often show cleaner combustion and fewer carbon deposits. This results in longer engine life and reduced wear on key components.
- For instance, Piaggio Vehicles Pvt. Ltd. has stated that its Apé Xtra range of three-wheelers offers significantly lower operating costs when running on CNG compared to petrol. The specific figures of ₹1.60 per km in CNG mode compared to ₹3.00 per km in petrol mode were provided by the company based on its internal fleet performance data at the time of the product launch (circa 2021).
Expansion of CNG Infrastructure and OEM Model Availability
Growth in CNG refuelling stations and an increasing number of factories‑fitted CNG vehicle models enhance market accessibility. OEMs now offer dedicated and bi‑fuel CNG variants, reducing conversion costs and boosting consumer confidence. As infrastructure and vehicle availability improve, adoption follows, supporting market expansion.
Key Trends & Opportunities
Bi‑Fuel and Dedicated CNG Systems Gain Traction
Bi-fuel systems, which allow vehicles to run on both CNG and petrol or diesel, continue to lead market demand due to strong flexibility. These systems offer extended driving range and help users manage situations where CNG stations are limited. Fleets value the dual-fuel setup because it reduces downtime and supports smooth daily operations. Private buyers also choose bi-fuel options for added confidence during long trips or in regions with uneven CNG coverage. Dedicated mono-fuel CNG systems are gaining attention as manufacturers improve engine design and combustion control. These systems deliver cleaner performance, better thermal efficiency, and lower emissions because the powertrain is optimised for a single fuel.
- For instance, Toyota Kirloskar Motor introduced the Glanza E-CNG with a dedicated CNG system integrated into its 1.2-litre K-Series engine, producing 57 kW of power and 98.5 Nm torque in CNG mode.
Turbocharged and High‑Efficiency CNG Engine Technologies
Engine makers invest in turbocharging and direct‑injection CNG technologies to improve performance and range. These advancements allow CNG‑powered vehicles to match conventional engine outputs while maintaining cleaner emissions. The technological push creates opportunity for differentiation and market premium.
- For instance, Volkswagen Group developed a 1.5 TGI EVO turbocharged CNG engine for models such as the Golf TGI, producing 96 kW (130 PS) and 200 Nm torque while operating on three integrated CNG tanks with a total capacity of 17.3 kg.
Emerging Market Penetration and Fleet Adoption
Developing economies in Asia Pacific and Latin America show strong potential for CNG expansion. Rapid urban growth creates heavy mobility demand, which pushes cities to seek cleaner and cheaper fuel options. Fuel price swings also encourage buyers to shift toward predictable CNG operating costs in daily travel. Many fleet operators in these regions adopt CNG to reduce long-term fuel expenses. Lower emissions help companies meet rising sustainability targets and comply with new urban clean-air rules. Logistics fleets, ride-share groups, and public transport networks show the fastest transition due to high daily usage. This geographic expansion represents a significant opportunity for market growth.
Key Challenges
Inadequate Refuelling Infrastructure and Fuel‑Range Constraints
Many regions still operate with sparse CNG refuelling coverage, which reduces travel range and limits user confidence. A thin station network forces drivers to plan routes carefully and stay close to urban zones. Rural and highway corridors often remain underserved, which restricts adoption among long-distance users. Fleet operators rely on predictable access to fuel, yet many stations have limited dispensing capacity. Slower expansion of public stations affects private buyers who expect convenience similar to petrol or diesel. The gap in infrastructure stalls wider market penetration until strong investments support a denser national network.
Higher Initial Cost and Competing Electrification Trends
CNG vehicles carry higher upfront costs due to specialised tanks, valves, and conversion hardware, which weighs on price-sensitive buyers. Automakers face extra engineering steps to meet safety and durability needs, pushing production cost higher. Private consumers often choose petrol or diesel options because they need lower starting prices. At the same time, rapid EV growth shifts market attention toward zero-emission choices. Many brands prioritise electric launches, which slows CNG portfolio expansion. Policy support also leans toward electrification, making CNG adoption harder in competitive passenger segments.
Regional Analysis
Asia-Pacific:
The Asia-Pacific region distinctly leads the CNG Powertrain Market, accounting for roughly 48% of global revenue share as of 2024. Rapid urbanisation, supportive policies in countries like India and China, and a large base of vehicles converting to CNG powertrains are major enablers. Domestic OEMs are integrating factory-fitted CNG systems into passenger and commercial vehicles, while natural-gas infrastructure is expanding. The region continues to draw intense focus from manufacturers and fleet operators seeking cost-efficient and low-emission mobility solutions, solidifying its dominant position.
North America:
In North America, the CNG powertrain segment holds approximately 15% of the global market share. Growth is driven primarily by the United States and Canada, where abundant natural gas supplies, emissions-compliance mandates for commercial and public transport fleets, and established refuelling infrastructure support adoption. Fleet operators—especially in municipal transit and logistics are replacing conventional diesel systems with CNG options. While electric and hybrid alternatives exert competitive pressure, CNG remains a viable transitional technology, especially in heavy-duty and fleet segments.
Europe:
Europe captures an estimated 20% of the global CNG powertrain market. The region’s uptake is led by countries such as Germany, Italy and Spain, which benefit from robust NGV infrastructure, favourable regulatory incentives and emissions reduction targets. Commercial vehicle fleets and public transport systems are key adopters of CNG powertrains, offering flexibility between gas and conventional fuels. While growth is not as explosive as in emerging regions, Europe remains a mature, strategic market for manufacturers seeking regulatory-compliant propulsion technologies.
Latin America:
Latin America represents around 10% of the global market share in the CNG powertrain space. The region’s growth is fostered by strong CNG vehicle penetration—especially in countries like Argentina and Brazil tax incentives, conversion programmes and infrastructure expansion. Many vehicles in the region are retrofitted to CNG, enabling rapid deployment. While the absolute market size remains smaller than other regions, Latin America offers high-growth potential, particularly in the passenger vehicle segment and for retrofit business models.
Middle East & Africa:
The Middle East & Africa region currently accounts for just over 7% of the global CNG powertrain market share. Although adoption is nascent, the region is strategically important due to abundant natural gas reserves and increasing fleet conversion programmes. Countries like Saudi Arabia, UAE and Egypt have initiated public-transport and logistics vehicle transitions to CNG, and infrastructure investments are steadily rising. The region presents long-term growth opportunities as energy diversification and emissions mitigation efforts gain momentum.
Market Segmentations
By Drive Type
- All-wheel Drive
- Rear Wheel Drive
- Front Wheel Drive
By Fuel Type
By Vehicle Type
- Passenger Vehicle
- Commercial Vehicle
By Geography
- North America
- Europe
- Germany
- France
- U.K.
- Italy
- Spain
- Rest of Europe
- Asia Pacific
- China
- Japan
- India
- South Korea
- South-east Asia
- Rest of Asia Pacific
- Latin America
- Brazil
- Argentina
- Rest of Latin America
- Middle East & Africa
- GCC Countries
- South Africa
- Rest of the Middle East and Africa
Competitive Landscape
The competitive landscape of the global CNG Powertrain Market features a mix of established OEMs and specialised component suppliers vying for leadership. Key players such as Cummins Inc., Robert Bosch GmbH, Volkswagen AG and Honda Motor Company integrate advanced CNG engine systems, fuel‑tank technologies and bi‑fuel powertrains to capture market share and meet cleaner‑mobility mandates These players emphasise collaborations, joint‑ventures and regional partnerships to drive cost efficiencies, optimise production and accelerate deployment across geographic markets. Meanwhile, regional players focus on low‑cost mono‑fuel CNG solutions tailored for emerging markets, intensifying competitive pressure on global incumbents. Given these dynamics, competition centres on technological differentiation, infrastructure alignment and scalability of CNG powertrain configurations.
Shape Your Report to Specific Countries or Regions & Enjoy 30% Off!
Key Player Analysis
- Ford Motor Company
- Hyundai Motor Company
- Volkswagen AG
- Nissan Motor Co., Ltd.
- Robert Bosch GmbH
- Cummins Inc.
- Maruti Suzuki India Limited
- FPT Industrial S.P.A.
- Honda Motor Company
- AB Volvo
Recent Developments
- In June 2025, Volkswagen AG Group Škoda announced it was evaluating Compressed Natural Gas (CNG) powertrains for the Indian market, with the Kylaq SUV being the likely first model to receive the option.
- In July 2024, Hyundai Motor India launched the Exter Hy-CNG Duo with a dual-cylinder setup. Hyundai lists a 60-litre water-equivalent CNG capacity and three variants.
Report Coverage
The research report offers an in-depth analysis based on Drive Type, Fuel Type, Vehicle Type and Geography. It details leading market players, providing an overview of their business, product offerings, investments, revenue streams, and key applications. Additionally, the report includes insights into the competitive environment, SWOT analysis, current market trends, as well as the primary drivers and constraints. Furthermore, it discusses various factors that have driven market expansion in recent years. The report also explores market dynamics, regulatory scenarios, and technological advancements that are shaping the industry. It assesses the impact of external factors and global economic changes on market growth. Lastly, it provides strategic recommendations for new entrants and established companies to navigate the complexities of the market.
Future Outlook
- The market will expand rapidly as passenger vehicle CNG powertrains capture rising demand in urban areas.
- Commercial vehicle fleets will increasingly adopt CNG systems due to fuel cost savings and emissions‑compliance incentives.
- Engine component upgrades and high‑efficiency fuel injection systems will stimulate technology‑driven growth.
- Regions such as Asia Pacific will maintain dominance, while Latin America shows highest growth potential supported by infrastructure rollout.
- The bi‑fuel segment will continue leading, but mono‑fuel configurations will gain share as dedicated CNG networks expand.
- OEMs will form strategic alliances and partnerships to scale manufacturing, access regional markets and optimise supply chains.
- Expansion of CNG refuelling infrastructure and public‑private investment will underpin sustained adoption.
- Cost pressures from electric vehicle trends will prompt CNG players to focus on niche markets and fleet conversions.
- Regulatory tightening of emissions and air‑quality standards will drive governments to promote CNG as a transitional fuel.
- Region‑specific policy support and incentives in emerging economies will unlock new opportunities for CNG powertrain deployment.


