
AI racks move liquid cooling into mainstream Indian builds
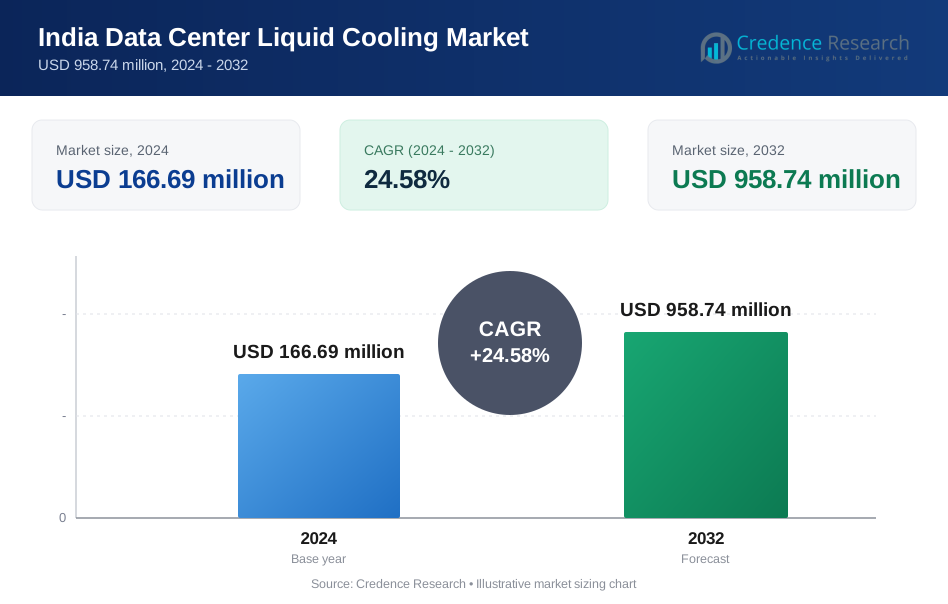
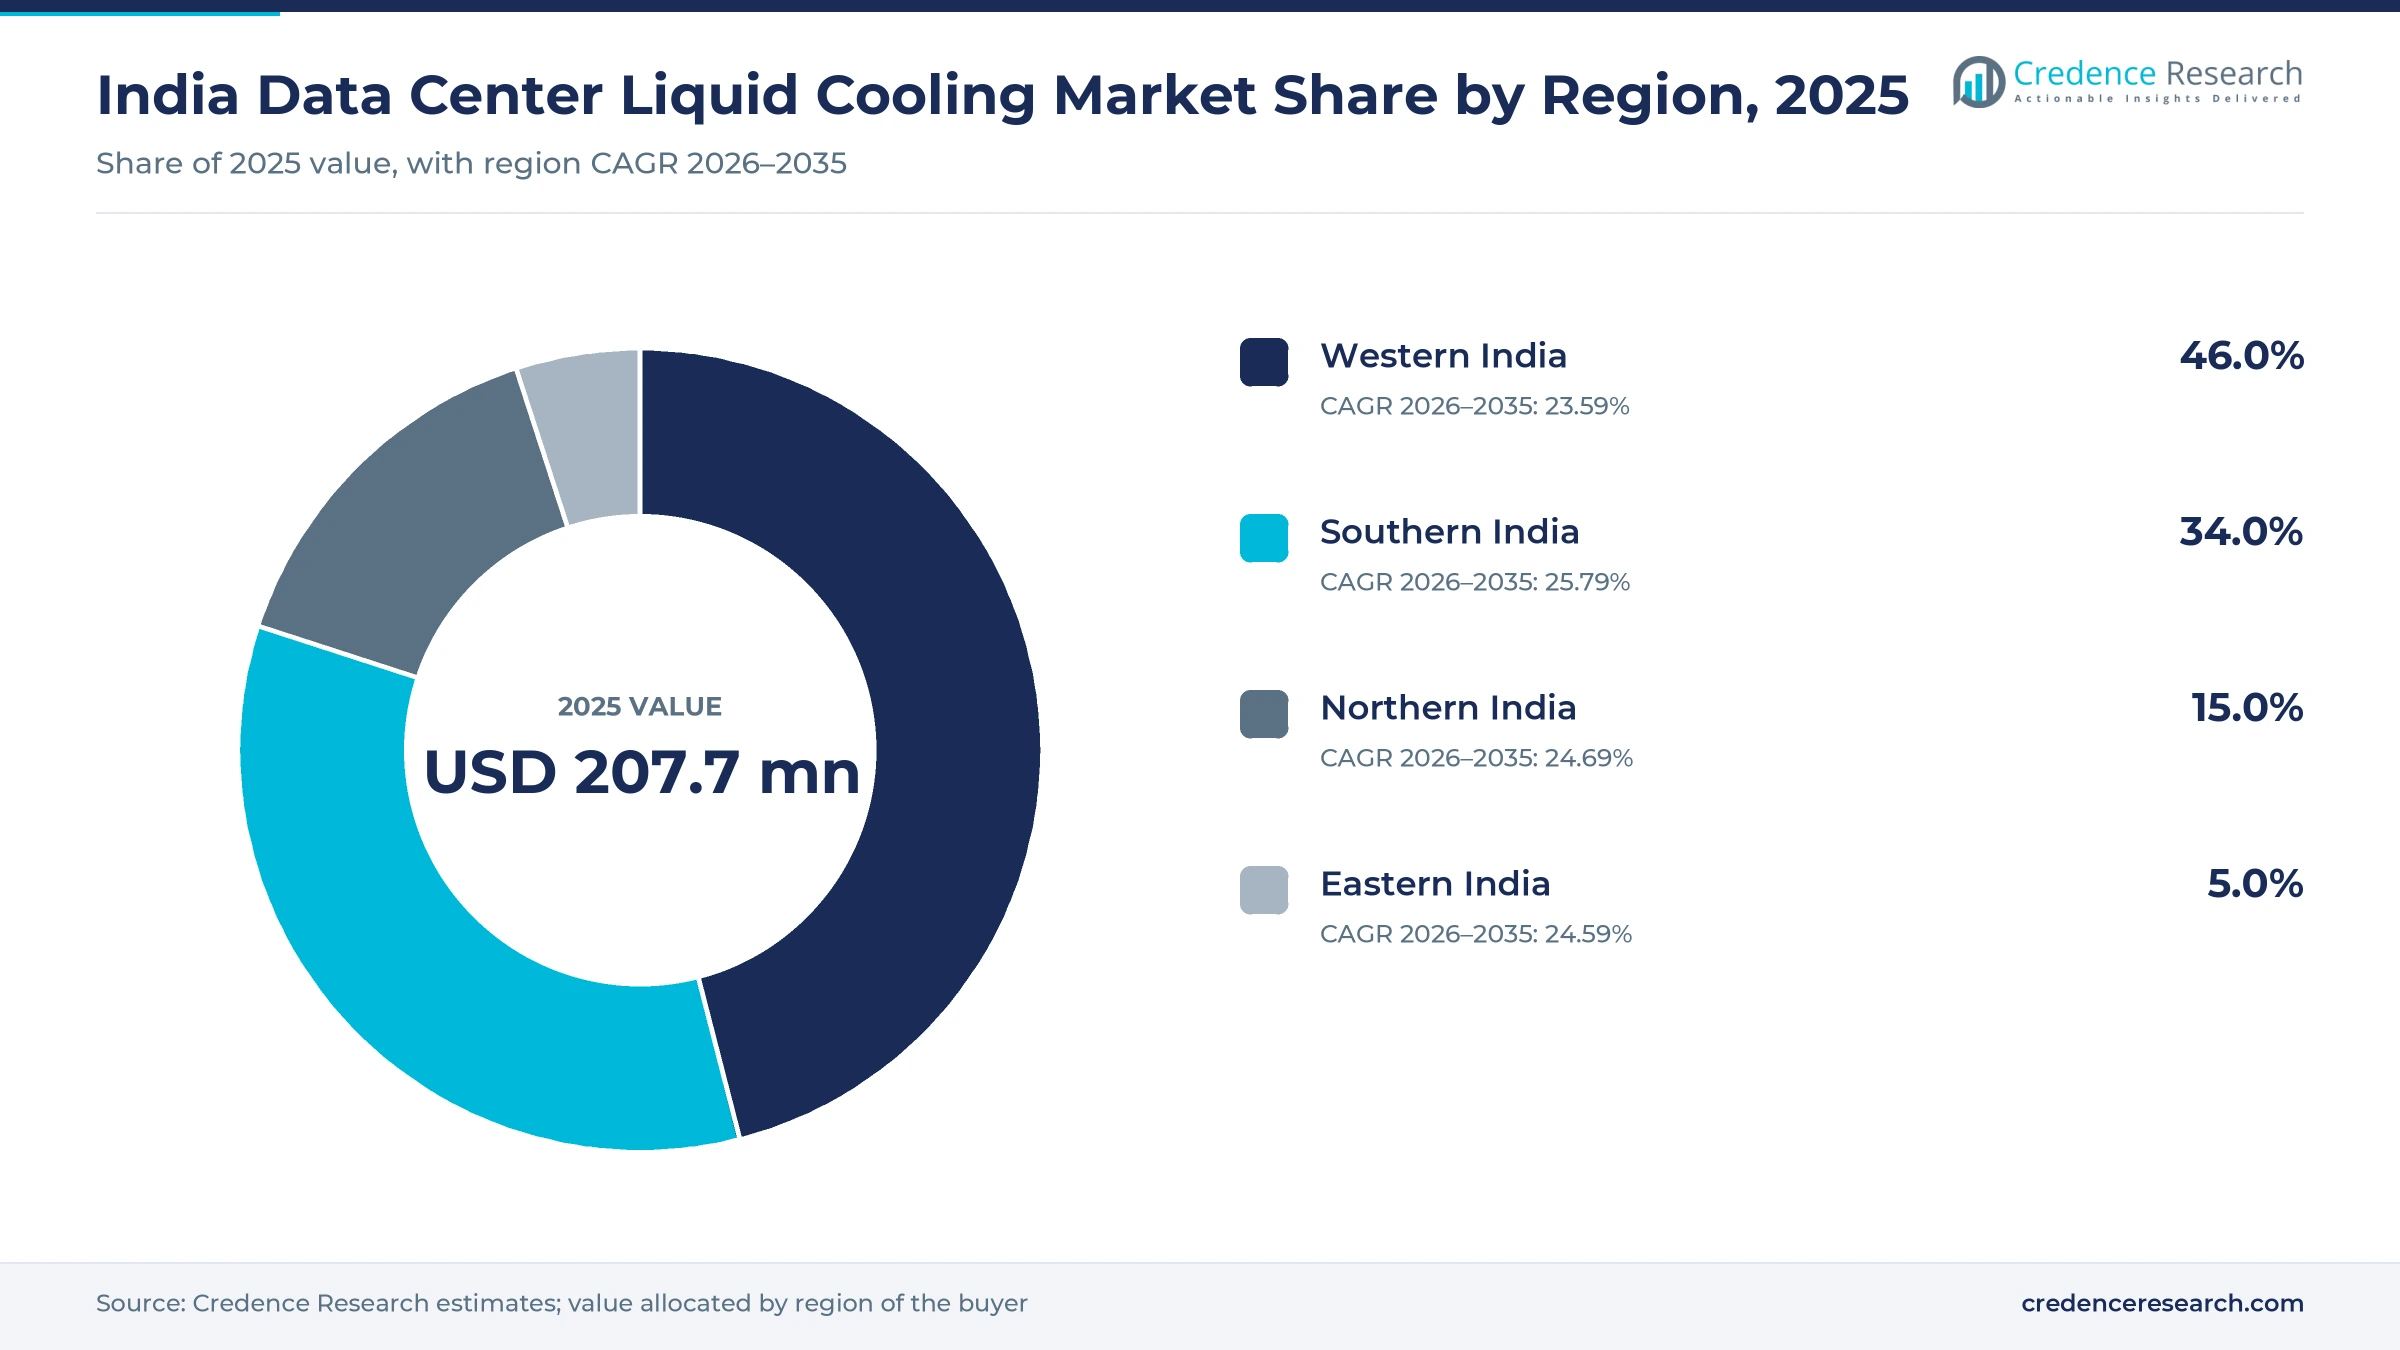
The India data center liquid cooling market was valued at USD 207.7 million in 2025 and is projected to increase from USD 258.7 million in 2026 to USD 1.87 billion by 2035, registering a CAGR of 24.58% during 2026–2035. Demand comes from hyperscale and GPU cloud operators whose racks now exceed what room air can remove, alongside tighter efficiency and water expectations from buyers and state governments. Western India held the largest regional share, 46.0% in 2025, because the Mumbai metropolitan area hosts the largest share of the country's live capacity. Southern India is the fastest-growing region at 25.79% a year, helped by planned gigawatt campuses at Visakhapatnam and Karnataka's target of 1 GW of IT load by 2031. Supply also changed in February 2026, when Schneider Electric opened its first Motivair production site in India, reducing reliance on imported coolant distribution units. As a result, buyers now compare local and imported systems on lead time and service as well as price.
Which systems and fluids count toward this India estimate?
The market counts direct-to-chip cold plates, immersion tanks, rear-door and other hybrid systems, coolant distribution units, secondary fluid networks, heat exchangers, pumps and fluids sold for Indian facilities. Buyers usually purchase these through a design-and-build contractor, or directly from an equipment vendor when a hyperscale tenant specifies the server platform.
Conventional room air handling, precision air conditioning and standard chillers serving air-cooled halls are excluded, which makes this a narrower market than total data center cooling. The value chain runs from fluid and component makers through system vendors and integrators to colocation owners, hyperscale operators and enterprise users.
India Data Center Liquid Cooling Market Insights
- The India data center liquid cooling market grows from USD 207.7 million in 2025 to USD 1.87 billion by 2035, at a 24.58% CAGR during 2026–2035, as AI racks exceed air limits.
- Western India led regional demand with 46.0% of 2025 value, because Mumbai held about 47% of India's live data center capacity at the end of that year.
- Direct-to-Chip Cooling led cooling types with 58.0% of 2025 value, because cold plates arrive specified on current high-density Nvidia GPU server platforms.
- Supply began moving onshore in February 2026, when Schneider Electric opened its Motivair site at Bengaluru, after Refroid had called the CDU base wholly imported in 2025.
- Competition now blends global thermal vendors with Indian entrants such as Refroid, Aeroflex Industries and Blue Star, which compete on local lead time, fluids and skids.
Direct-to-chip systems and hyperscale buyers set the pace
Why do cold plates lead Indian liquid deployments?
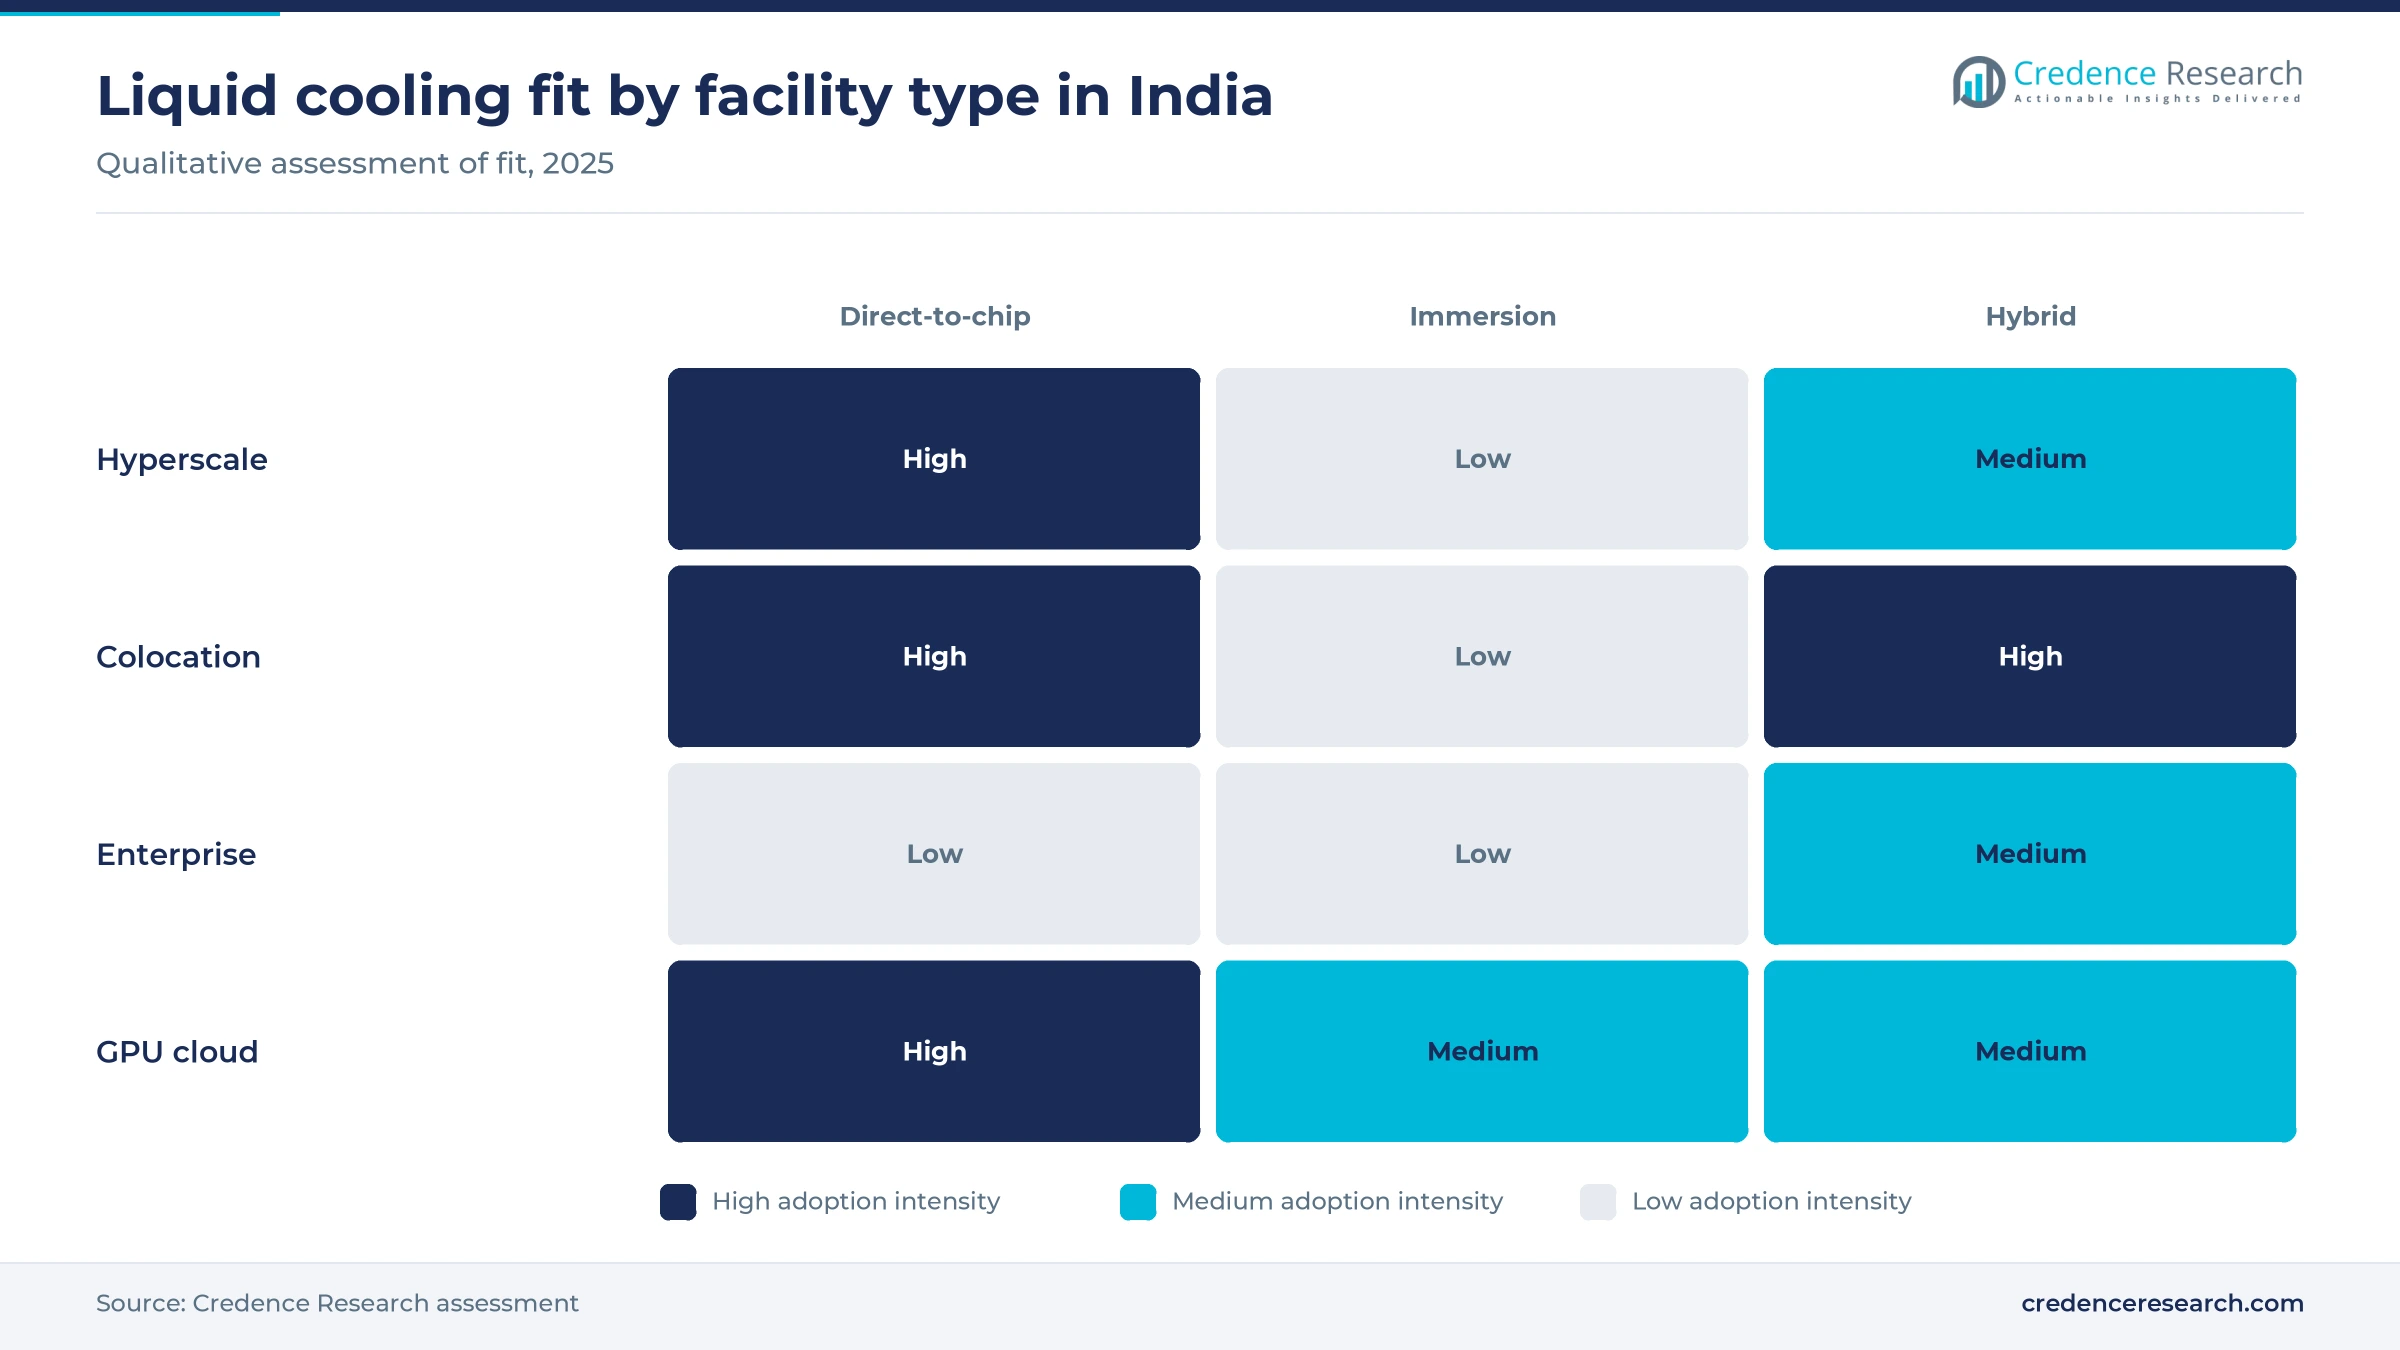
Based on cooling type, the market is categorized into direct-to-chip cooling, immersion cooling and hybrid cooling systems. Direct-to-Chip Cooling led with 58.0% of 2025 value, because the largest named projects use it, including the 30 MW secondary fluid network Vertiv delivered at Airoli, announced Oct. 16, 2026. Hybrid systems keep a role in partial upgrades, since Schneider Electric now builds rear-door heat exchangers at Bengaluru. Immersion Cooling grows fastest at 26.55% a year from a small base, as Infosys and ExxonMobil agreed on Feb. 13, 2026, to deploy such systems for AI facilities across several industries.
Which facility types buy the most liquid cooling?
Based on data center type, the market is categorized into hyperscale, colocation and enterprise data centers. Hyperscale Data Centers led with 52.0% of 2025 value, because single projects are large, as Yotta's 60 MW D2 building at Greater Noida shows for its 20,736 liquid-cooled GPUs, announced Feb. 18, 2026. Hyperscale campuses also grow fastest at 25.52% a year, as Free Press Journal reported on April 28, 2026, that Reliance plans 1.5 GW at Visakhapatnam by 2030. Colocation owners follow, while enterprise rooms rarely reach such densities.
Who pays for liquid-cooled capacity in India?
Based on end user, the market is categorized into IT and cloud service providers, financial services, manufacturing and industrial, and healthcare and pharmaceuticals. IT & Cloud Service Providers led with 66.0% of 2025 value, because AI compute is concentrated there, with more than 38,000 GPUs onboarded to the IndiaAI portal by March 25, 2026, according to the Ministry of Electronics and IT. Financial Services grows fastest at 25.82% a year, as PhonePe was the client for NTT's 4.8 MW Navi Mumbai liquid cooling conversion in January 2023. Infosys and ExxonMobil also named financial services among target customers in February 2026.
Where does spending go inside a liquid loop?
Based on component, the market is categorized into cooling equipment, chillers and pumps, heat exchangers and accessories. Cooling Equipment led with 52.0% of 2025 value, because CDUs and cold plates carry the highest unit content, and Johnson Controls launched Silent-Aire CDUs of 500 kW to more than 10 MW for India on Nov. 10, 2025. Accessories grows fastest at 26.77% a year, as Aeroflex Industries raised annual skid output to 9,000 units on July 1, 2026, and Indian Chemical News reported in October 2026 a Rs 202 crore expansion toward 30,000 units by March 2028.
| Segment Group | Leading Sub-segment | Share, 2025 | Fastest-growing Sub-segment | CAGR, 2026–2035 |
|---|---|---|---|---|
| By Cooling Type | Direct-to-Chip Cooling | 58.0% | Immersion Cooling | 26.55% |
| By Data Center Type | Hyperscale Data Centers | 52.0% | Hyperscale Data Centers | 25.52% |
| By End User | IT & Cloud Service Providers | 66.0% | Financial Services | 25.82% |
| By Component | Cooling Equipment | 52.0% | Accessories | 26.77% |
Request a Free Sample
Fill in your details and we'll send you a free sample report.
- Sample data tables & charts
- Research methodology
AI density, PUE tenders and water drive new loop orders
AI rack densities outrun the limits of room air
Accelerated computing is the main reason Indian operators now specify liquid loops, because current GPU racks exceed what room air can remove. Schneider Electric put Nvidia GB300 NVL72 systems at roughly 142 kW per rack in a July 2026 technical note. Yotta said on Feb. 18, 2026, that its Blackwell Ultra cluster would use liquid-cooled GPUs, with go-live targeted for August 2026. The Ministry of Electronics and IT also reported more than 38,000 GPUs on the national compute portal in March 2026, under a mission with a Rs 10,372 crore outlay. As a result, each new GPU tender adds thermal load that older air-cooled halls were never designed to carry.
Record capacity additions enlarge the addressable base
India's build-out gives liquid cooling a larger base of new halls, where loops are cheaper to design in than to retrofit. CBRE counted about 1,700 MW of operational capacity at the end of 2025 after a record 440 MW of additions, a 160% jump on the prior year. CBRE also expects nearly 500 MW more during 2026, which raises demand for new loops. Knight Frank's 2025 market update lists a pipeline above 8.3 GW, and data center electricity demand rose 17% worldwide in 2025, according to the International Energy Agency. The Union Budget of Feb. 1, 2026, then added a tax holiday until 2047 for foreign cloud companies serving global customers from Indian facilities, which lengthens planning horizons for these buyers.
PUE conditions turn liquid loops into a bid requirement
Efficiency rules are starting to reach procurement documents, which turns liquid cooling from an engineering choice into a bid condition. Schneider Electric puts India's average PUE at about 1.5 to 1.6, while the IndiaAI Mission tender covering 10,000 GPUs requires a figure below 1.35. Karnataka's 2026–2031 data center policy, reported by The News Minute in September 2026, offers a one-time Rs 20 crore incentive to units that hold a PUE of 1.00 to 1.20 for three straight years. India Briefing reported in June 2026 that cooling absorbs 15% to 20% of operating expenditure, so savings reach operators directly. Schneider Electric adds that direct-to-chip systems can cut cooling energy by up to 60% against mechanical air cooling.
Water stress favors closed-loop thermal designs
Water is a second commercial reason for closed loops, particularly in coastal and water-stressed hubs. The Council on Energy, Environment and Water estimated that Indian data centers used about 150 billion liters in 2024–25, and a June 2026 Analytics India Magazine report on its work projects nearly 358 billion liters a year by 2030. The council also says a typical 100 MW hyperscale site can use about 2 million liters a day for on-site cooling. Karnataka will reimburse water charges, up to Rs 30 lakh a year, for units holding water usage effectiveness of 0.7 to 1.3 liters per kWh. In addition, NeevCloud selected ZutaCore's waterless HyperCool system for all its facilities, which the vendor says trims water use by up to 90%.
Local plants, immersion pilots and retrofits reshape supply
Shift from imported CDUs to India-built equipment
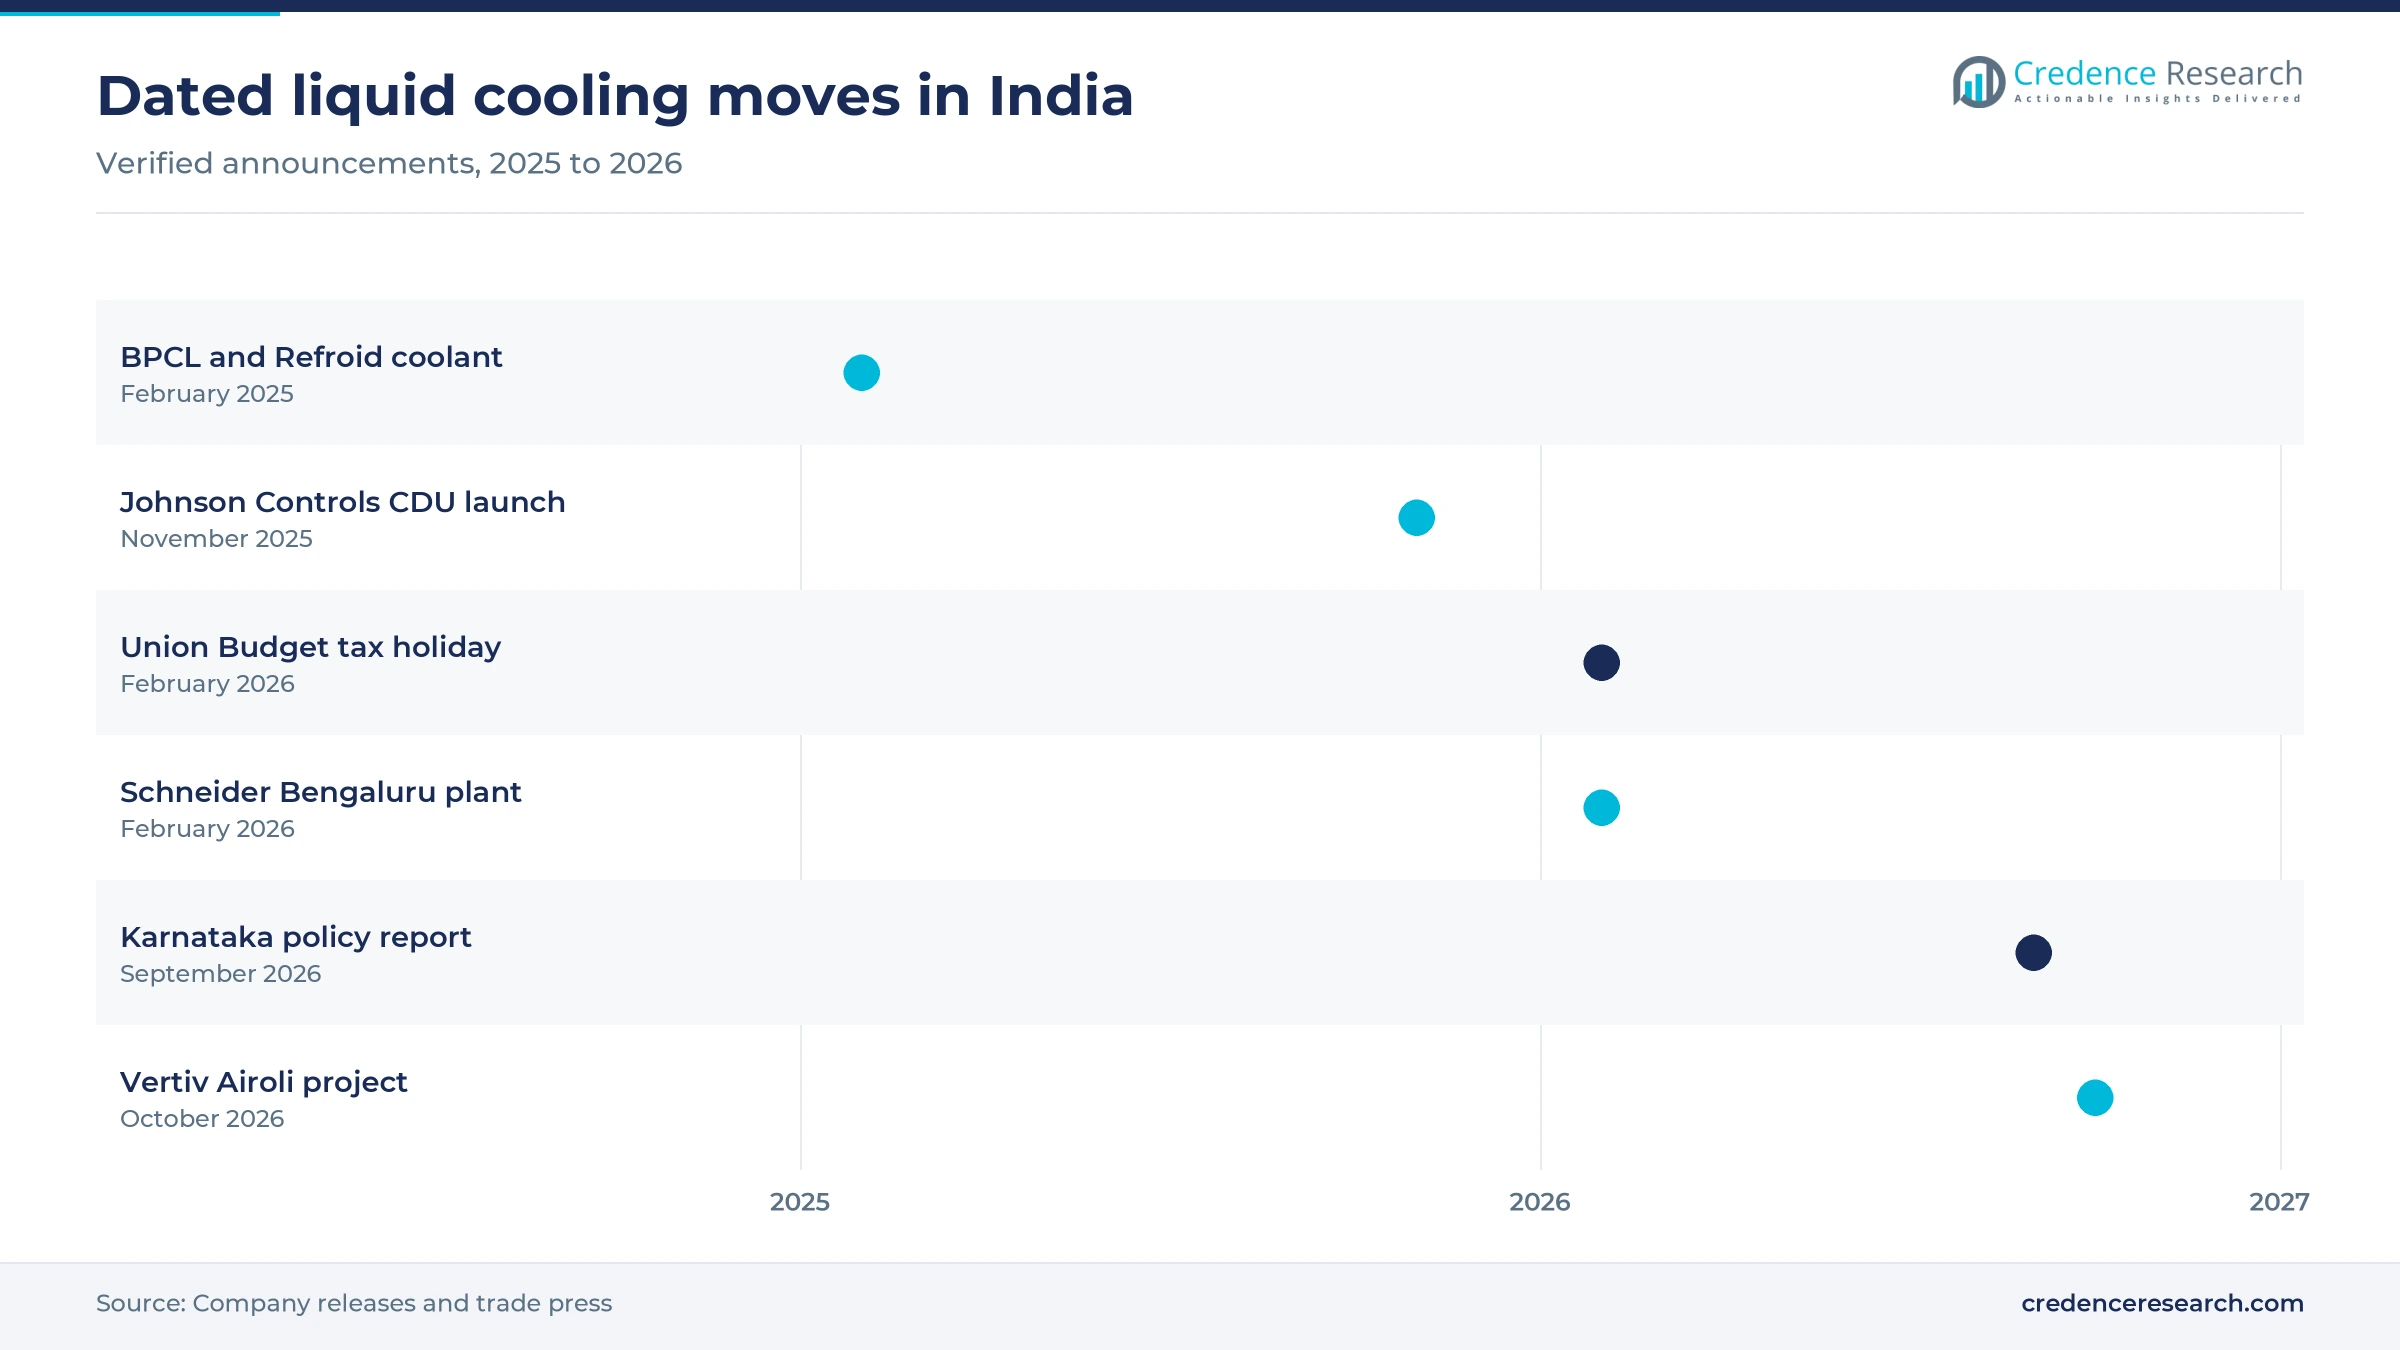
Supply is moving onshore, which shortens lead times for a market that relied on imports until recently. Refroid's chief executive told Network World in May 2025 that every CDU then being installed in India was imported. Refroid's own SentraFlo units, rated from 200 kW to 2 MW, were scheduled to ship by the end of June 2025. Schneider Electric then opened its first Motivair production site in India at Bengaluru in February 2026, its third worldwide, making CDUs, rear-door heat exchangers and cold plates for racks of 100 kW and above. STULZ also inaugurated a 352,000-square-foot plant near Sriperumbudur in June 2026, which adds regional capacity for data center cooling equipment. Buyers can now ask for shorter schedules and closer spares support.
Rise of immersion pilots and India-made coolant fluids
Immersion cooling is emerging through fluid and integration partnerships rather than large halls, and lubricant companies are behind much of this activity. BPCL and Refroid introduced a domestically developed coolant on Feb. 4, 2025. Submer then announced a partnership with Anant Raj Cloud on Feb. 9, 2026, ahead of the India AI Impact Summit. Trade Brains reported in May 2026 that Castrol fluids for immersion and direct-to-chip systems were in trials in India. Gulf Oil Lubricants India has two products in testing and validation for next-generation cooling, according to the same report, which shows that fluids remain a specialist business. Fastest growth therefore starts from a narrow base, since immersion tanks remain a specialist purchase.
Opening to convert air-cooled halls built for lower densities
Upgrading existing halls is a clear opening, because most installed Indian capacity was designed for air. NTT showed the route in January 2023, when its 4.8 MW Navi Mumbai facility on the Mahape campus gained immersion and direct-contact cooling for PhonePe, with Sudlows and Dell as partners. Vertiv's CapitaLand project at Airoli, announced Oct. 16, 2026, shows the scale now involved, because its secondary fluid network supports 30 MW of AI load for a hyperscale customer. Refroid's hybrid load banks, which simulate 135 kW racks, also give owners a way to test upgraded rooms before go-live. Vendors offering rear-door units and phased loops can win owners unwilling to rebuild entire halls.
Opening at design stage on east coast gigawatt campuses
Gigawatt campuses on the east coast give loop suppliers a design-stage opening, since cooling choices can be fixed before construction starts. Free Press Journal reported on April 28, 2026, that Reliance plans Rs 1.6 lakh crore of investment at Visakhapatnam, alongside about $15 billion from Google in the same city. The Council on Energy, Environment and Water notes that Andhra Pradesh promotes seawater cooling in coastal areas, which can pair with closed secondary loops. Refroid and TierX also presented factory-built modular facilities on March 13, 2026, with a stated PUE target of 1.2 in high-ambient regions. Suppliers that qualify early with these developers can secure multi-phase specification positions.
Cost, skills, climate and uneven rules slow conversion
Capital premiums deter owners without AI tenants
Direct liquid cooling carries a capital premium of 15% to 25% over air cooling, and immersion a premium of 30% to 50%, according to Datacentres.com analysis published in July 2026. Engineered immersion fluid also costs $40 to $80 per liter. This premium hurts enterprise and smaller colocation owners most, because their racks rarely need such density. As a result, many can defer conversion until a tenant commits, while phased deployment and rear-door units reduce the first investment.
Commissioning skills remain thin across Indian sites
India's data center industry is expected to need nearly 100,000 skilled professionals by 2030, according to a Schneider Electric note from August 2026. Liquid loops add flushing, pressure testing, coolant sampling and filtration to commissioning, and each step needs trained staff. Operators without this experience face longer handovers and greater leak exposure. Schneider Electric therefore advises buyers to settle critical spares and site response times before handover, which protects uptime during early operation.
Heat and humidity keep chillers in the design
Liquid cooling does not remove chillers from most Indian designs, because hot, humid tropical and semi-arid zones typically still require them, as Schneider Electric explained in July 2026. The Council on Energy, Environment and Water also found that about 57% of Indian districts face high to very high extreme heat risk. Owners therefore pay for secondary loops and heat rejection plant together, which narrows savings. Warmer coolant designs and retained precision air conditioning help balance that trade-off.
Uneven state rules blur the payback case
The Council on Energy, Environment and Water reported in February 2026 that only 5 of 15 state policies embed sustainability provisions, and most lack water-efficiency standards. Tamil Nadu's 2021 policy, for example, did not address water despite Chennai's 2019 crisis, according to Schneider Electric. Investors therefore cannot price efficiency gains consistently across hubs, which weakens the case for paying a premium. The council recommends introducing enforceable benchmarks gradually, which would reduce this uncertainty.
Western India leads while the south adds gigawatt campuses
| Region | Value, 2025 (USD million) | Share, 2025 | CAGR, 2026–2035 |
|---|---|---|---|
| Western India | 95.5 | 46.0% | 23.59% |
| Southern India | 70.6 | 34.0% | 25.79% |
| Northern India | 31.1 | 15.0% | 24.69% |
| Eastern India | 10.4 | 5.0% | 24.59% |
Western India anchors liquid cooling around Mumbai
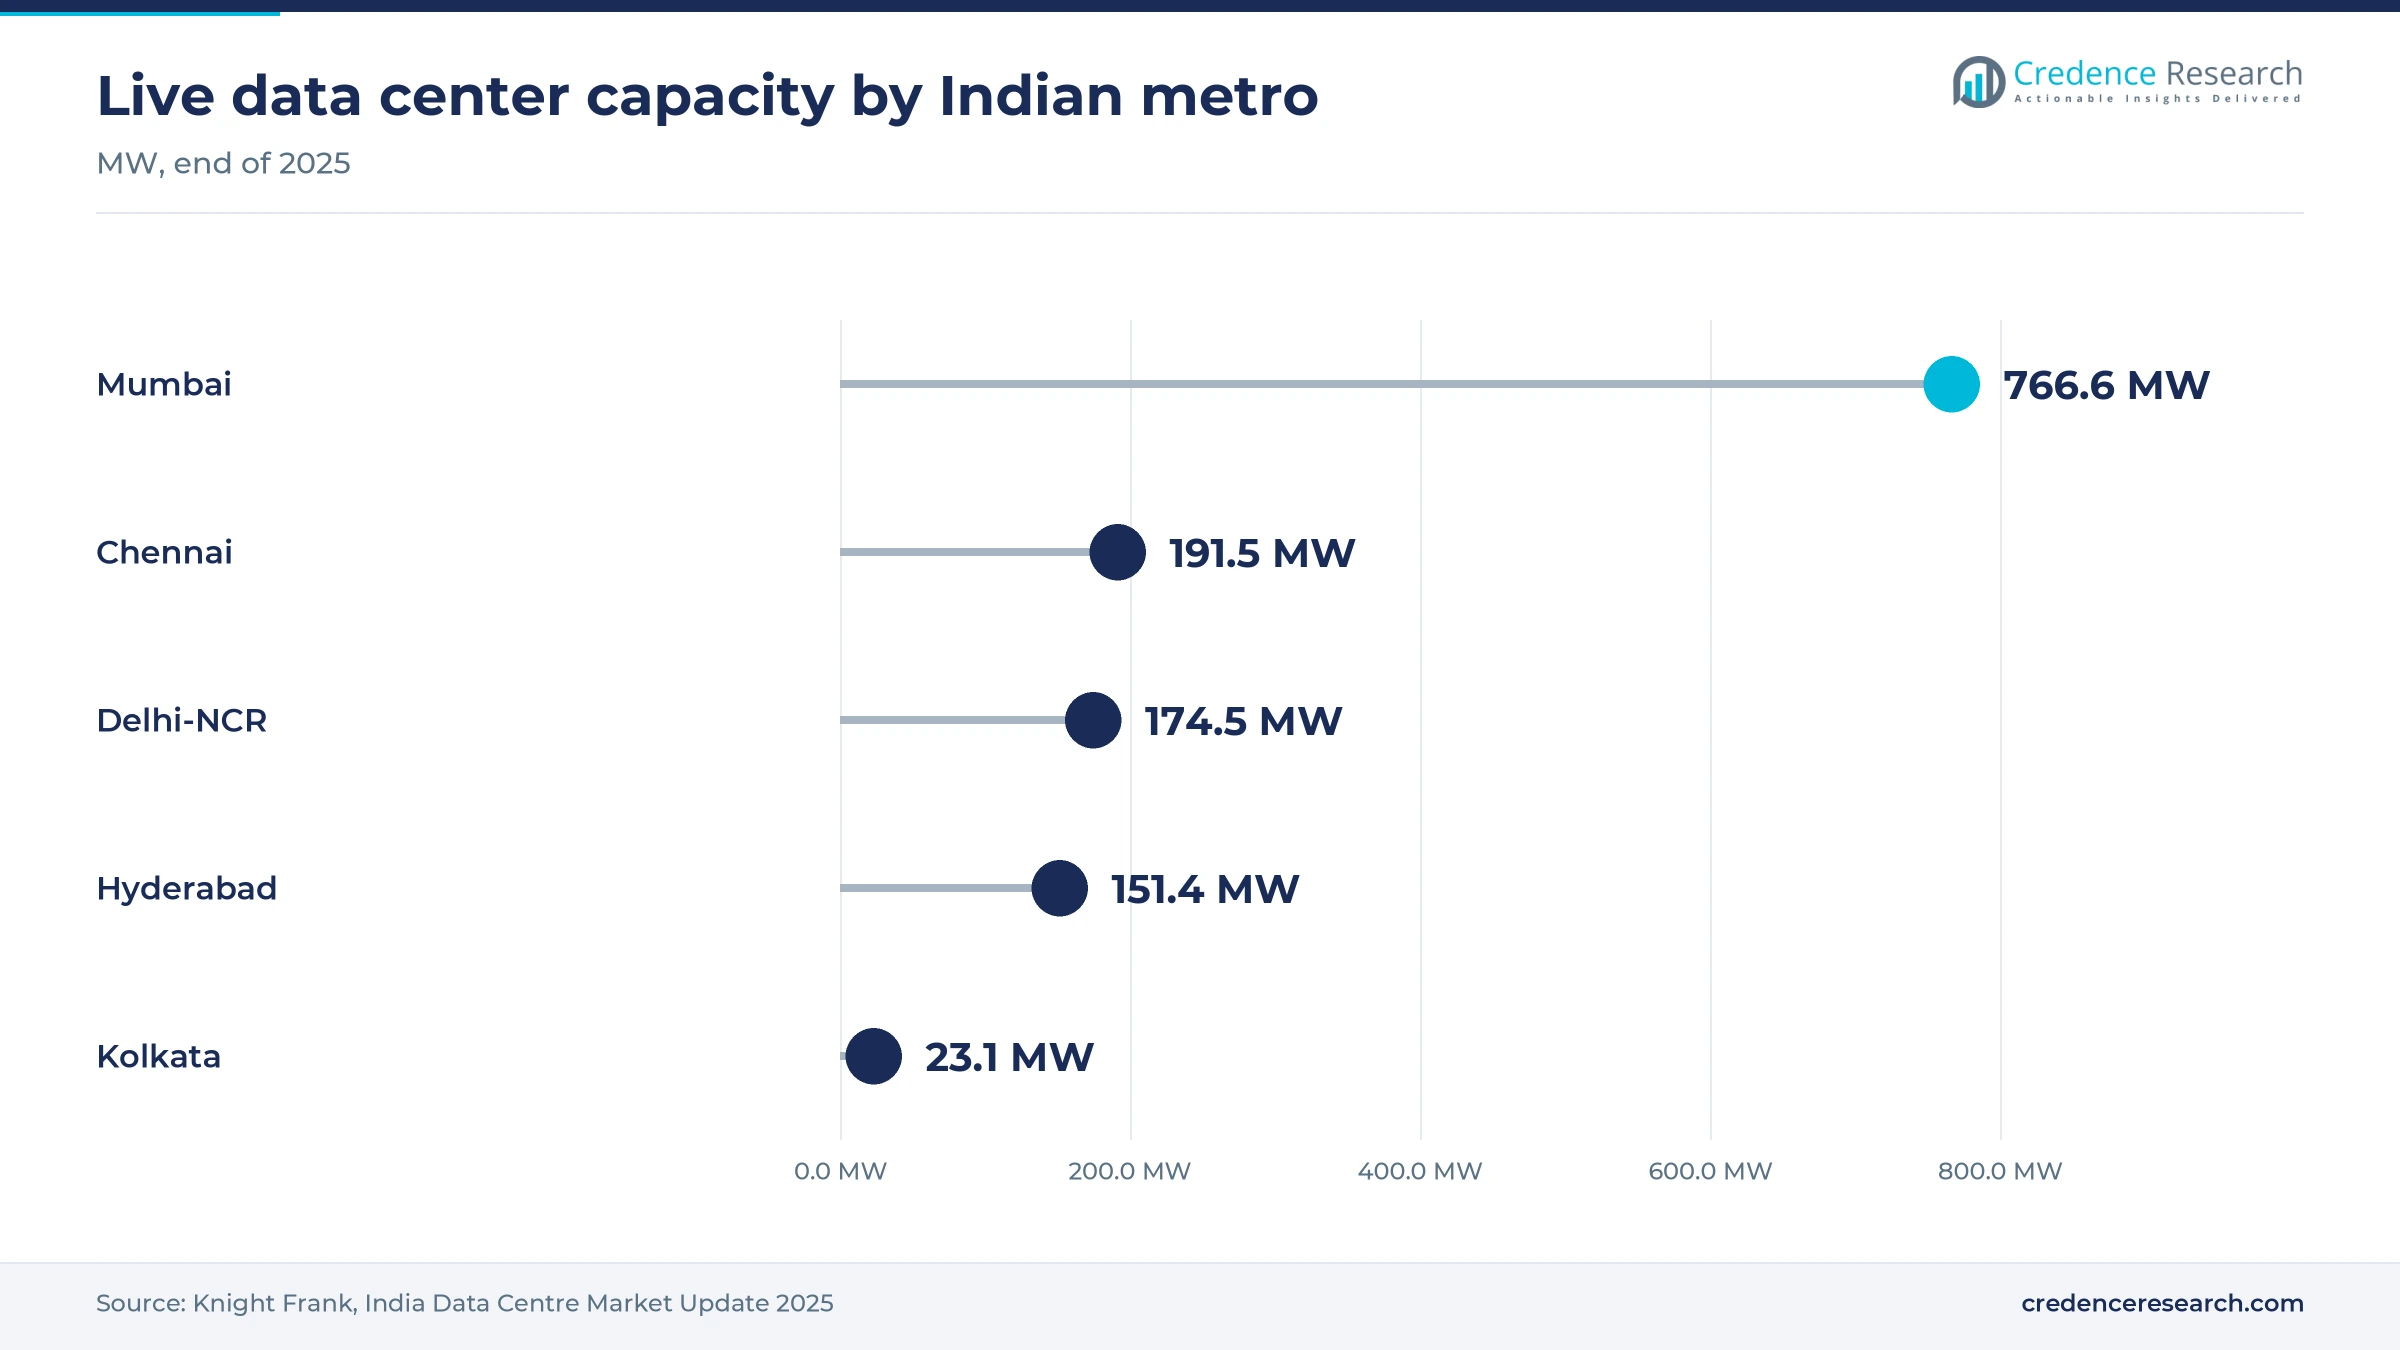
Western India held 46.0% of 2025 value and grows at 23.59% a year. Knight Frank put Mumbai's live capacity at 766.6 MW at the end of 2025, about 47% of the national total. Navi Mumbai also hosts the two best-documented projects, NTT's Mahape conversion and Vertiv's Airoli installation. Maharashtra supports this base with a permanent electricity duty exemption, which Schneider Electric described in September 2026. Growth trails the south because the base is already large.
Southern India adds plants and gigawatt campuses
Southern India held 34.0% of 2025 value and is the fastest-growing zone at 25.79% a year. Knight Frank reported 191.5 MW in Chennai and 151.4 MW in Hyderabad at the end of 2025, while Karnataka targets 1 GW of cumulative IT load by 2031. Bengaluru and other southern sites make up the rest of the zone's share, which is a Credence Research estimate rather than a published capacity count. Local plants from Schneider Electric, STULZ and Refroid shorten lead times for these buyers, while Reliance's Visakhapatnam plan adds future demand.
Northern India rises on Greater Noida GPU capacity
Northern India held 15.0% of 2025 value and grows at 24.69% a year. Knight Frank put Delhi-NCR at 174.5 MW at the end of 2025, up 55% from 2022. Yotta's D2 building at Greater Noida, a 60 MW site on a campus scalable to 250 MW, is the zone's clearest liquid cooling reference. CBRE data put Delhi-NCR at 10% of national capacity in September 2025, so the zone remains well behind Mumbai.
Eastern India stays small around Kolkata
Eastern India held 5.0% of 2025 value and grows at 24.59% a year from the smallest base. Knight Frank counted only 23.1 MW of live capacity in Kolkata at the end of 2025, far below other metros. CBRE names Patna among emerging tier-II centers, although no large liquid cooling project there has been verified. Demand should therefore remain limited to smaller colocation and edge rooms until larger GPU tenants commit to the zone.
Dated plant, product and project moves from 2025 to 2026
| Development | Status and market relevance |
|---|---|
| In October 2026, Vertiv announced a 30 MW direct-to-chip deployment for CapitaLand at Airoli, Navi Mumbai. | Delivered for a hyperscale end customer |
| In February 2026, Schneider Electric launched its first Motivair production site in India at Bengaluru. | Makes CDUs, rear-door units and cold plates |
| In February 2026, Infosys and ExxonMobil expanded their collaboration on immersion cooling for AI data centers. | Deployment plans announced, terms undisclosed |
| In November 2025, Johnson Controls introduced Silent-Aire CDUs of 500 kW to more than 10 MW for India. | Targets Mumbai, Chennai and Hyderabad |
| In June 2026, STULZ India inaugurated a 352,000-square-foot production facility near Sriperumbudur in Tamil Nadu. | Adds regional cooling equipment capacity |
Four technologies define Indian liquid cooling designs
- Cold plates carry coolant directly across processors, and they suit racks of 100 kW and above that Schneider Electric now supplies from Bengaluru.
- Coolant distribution units separate the server loop from facility water, and Refroid's SentraFlo range spans 200 kW to 2 MW for Indian projects.
- Rear-door heat exchangers remove heat at the rack without opening servers, which makes them a practical first step in existing air-cooled rooms.
- Immersion tanks submerge servers in dielectric fluid, and NTT's Navi Mumbai conversion for PhonePe remains a documented Indian reference from January 2023.
Need a Custom Version of This Report?
Tailor the scope, geography, or segments to your exact requirements.
- Custom geography or segment scope
- Direct access to our analyst team
Global vendors localize as Indian suppliers enter loops
Data center cooling companies in India fall into three groups, and they compete on qualification with GPU platforms, local lead time and service. Global thermal vendors hold the strongest named references, including the 30 MW Airoli deployment by Vertiv. Refroid's chief executive, a competing supplier, credited Schneider, Vertiv, Asetek, LiquidStack and ZutaCore with most CDU deployments in May 2025, according to Network World. Those vendors are now localizing, as the Bengaluru Motivair site shows. Indian manufacturers form the second group, including Refroid in CDUs and fluids, and Aeroflex Industries in skids and secondary networks. HVAC and component suppliers form the third group, and Trade Brains listed Blue Star, Voltas and KRN Heat Exchanger among stock-market companies exposed to data center cooling in May 2026. Blue Star is developing in-house liquid models, while Voltas sells screw, centrifugal and oil-free chillers. Lubricant makers, including Castrol and Gulf Oil Lubricants India, are testing or targeting fluids. Buyers often assemble several suppliers on one project rather than purchase a single vendor stack.
Which companies supply data center cooling systems in India?
| Company | Type | Role in the market |
|---|---|---|
| Schneider Electric (Motivair) | Global vendor, local plant | Makes CDUs, rear-door units and cold plates at Bengaluru since February 2026 |
| Vertiv | Global vendor | Delivered the 30 MW Airoli secondary fluid network for CapitaLand |
| Johnson Controls | Global vendor | Launched Silent-Aire CDUs for Indian high-density sites in November 2025 |
| STULZ India | Cooling manufacturer | Opened a 352,000-square-foot plant near Sriperumbudur in June 2026 |
| Refroid Technologies | Indian manufacturer | Hyderabad-based maker of SentraFlo CDUs, immersion pods and load banks |
| Aeroflex Industries | Indian manufacturer | Builds liquid cooling skids, with a Taloja expansion due by March 2028 |
| Blue Star | Indian HVAC company | Provides data center EPC work and is developing in-house liquid models |
| Voltas | Indian HVAC company | Sells screw, centrifugal and oil-free chillers to data centers |
| KRN Heat Exchanger | Indian component maker | Supplies chillers, dry coolers and heat exchanger components to HVAC suppliers |
| ZutaCore | Global specialist | Selected by NeevCloud for waterless direct-to-chip cooling |
| Submer | Global specialist | Partnered with Anant Raj Cloud on immersion cooling in February 2026 |
Design-stage loop decisions matter more than retrofits
Credence Research's view is that the decisive purchase is now made at design stage rather than through later retrofit. Reliance's Visakhapatnam plan and Yotta's Greater Noida build show that GPU platforms increasingly fix the thermal architecture before contractors bid. Local manufacturing by Schneider Electric and Refroid should erode the lead-time advantage of imports, leaving service depth and commissioning skill as stronger differentiators. Immersion has the fastest estimated growth, although its base remains small. The main forecast risk is slower GPU deployment, which would delay projects such as the 60 MW Greater Noida building and reduce demand.
How Credence Research built these India estimates
The report uses 2025 as the base year and 2026–2035 as the forecast period. Market values come from the Credence Research model, with the earlier published 2024 estimate brought forward to 2025 at its own growth rate and then checked against public capacity data. Segment and regional splits are Credence Research estimates built from public capacity and project data. Sources used are company releases, government statements, public policy documents, property consultancy capacity data and trade press. No interviews or surveys were conducted for this 2026 edition of the report.
Liquid becomes the default for Indian AI halls by 2035
By 2035, liquid cooling should be the default specification for new Indian AI halls, with air retained for lower-density enterprise and network rooms. Capacity pipelines above 8.3 GW and tenders with PUE ceilings near 1.35 support that direction. Southern India should narrow the gap with Western India as the 1.5 GW Visakhapatnam campus planned by Reliance is phased in. Domestic CDU, skid and fluid supply should mature during the period, while national water and energy benchmarks would add further pull. The pace still depends on GPU deployment and reliable grid connections.
Frequently Asked Questions
How big is the India data center liquid cooling market?
How does liquid cooling differ from the wider India data center cooling market?
Which are the main data center cooling companies in India?
Which data center cooling system manufacturers have plants in India?
Which listed Indian companies have data center cooling exposure?
How much data center capacity does India have for AI?
Which cooling type leads the Indian market?
Which region leads the India data center liquid cooling market?
Table of Content
Chapter 1 Market Segmentation
- 1.1 Segmentation Framework
- 1.1.1 Product and Service Classification
- 1.1.2 Application and End-Use Classification
- 1.1.3 Technology and Solution Classification
- 1.1.4 Customer and Distribution Channel Classification
- 1.1.5 Geographic Segmentation
- 1.1.6 Market Segment Definitions and Boundaries
- 1.2 By Cooling Type
- 1.2.1 Direct-to-Chip Cooling
- 1.2.2 Hybrid Cooling Systems
- 1.2.3 Immersion Cooling
- 1.3 By Data Center Type
- 1.3.1 Hyperscale Data Centers
- 1.3.2 Colocation Data Centers
- 1.3.3 Enterprise Data Centers
- 1.4 By End User
- 1.4.1 IT & Cloud Service Providers
- 1.4.2 Financial Services
- 1.4.3 Manufacturing & Industrial
- 1.4.4 Healthcare & Pharmaceuticals
- 1.5 By Component
- 1.5.1 Cooling Equipment
- 1.5.2 Chillers & Pumps
- 1.5.3 Heat Exchangers
- 1.5.4 Accessories
Chapter 2 Introduction
- 2.1 Report Objectives and Scope
- 2.2 Product Definition and Industry Terminology
- 2.3 Market Inclusions and Exclusions
- 2.4 Research Process
- 2.4.1 Primary Research and Expert Interviews
- 2.4.2 Secondary Research and Source Review
- 2.4.3 Top-Down and Bottom-Up Estimation
- 2.4.4 Data Triangulation and Verification
- 2.5 Market Size Measurement Basis
- 2.5.1 2025: USD 207.7 million → 2035: USD 1.87 billion
- 2.6 Historical and Forecast Reference Periods
- 2.6.1 Historical Period: 2018-2025
- 2.6.2 Base Year: 2025
- 2.6.3 Forecast Period: 2025-2035
- 2.7 Research Assumptions and Limitations
Chapter 3 Executive Summary
- 3.1 Market Snapshot and Key Findings
- 3.2 Base-Year Market Size, 2025
- 3.3 Forecast Market Size, 2035
- 3.4 Revenue and Volume Growth Outlook
- 3.5 Key Demand and Supply Indicators
- 3.6 Leading Market Segments
- 3.7 Fastest-Growing Market Opportunities
- 3.8 Regional Performance Highlights
- 3.9 Technology and Industry Transformation
- 3.10 Competitive Landscape Summary
- 3.11 Analyst View and Strategic Implications
Chapter 4 India Data Center Liquid Cooling Market Trends and Developments
- 4.1 Historical Industry Development, 2018-2025
- 4.2 Recent Market Trends and Developments
- 4.3 Demand and Customer Behavior Trends
- 4.4 Technology and Product Innovation
- 4.5 Artificial Intelligence, Automation and Digitalization
- 4.6 Local Manufacturing and Supply Chain Realignment
- 4.7 Industry Partnerships, Mergers and Acquisitions
- 4.8 Sustainability and Circular Economy Developments
- 4.9 Government and Private Sector Investment Trends
- 4.10 Emerging Business Models and Commercialization
- 4.11 Industry Developments and Announcements
Chapter 5 India Data Center Liquid Cooling Market Production, Supply and Demand Analysis
- 5.1 Demand Trend and Consumption Analysis, 2018-2025
- 5.2 Demand Forecast, 2025-2035
- 5.3 Production and Output Trend, 2018-2025
- 5.4 Production and Output Forecast, 2025-2035
- 5.5 Installed Capacity and Capacity Utilization
- 5.6 Company-Wise Production Plants and Statistics
- 5.6.1 Installed Production Capacity
- 5.6.2 Actual Production
- 5.6.3 Planned Capacity and Expansion Targets
- 5.7 Supply Chain Structure and Procurement Trends
- 5.8 Supply-Demand Gap and Bottlenecks
- 5.9 Import Dependence and Sourcing Structure
- 5.10 Contract Manufacturing and Outsourcing
- 5.11 Regional Supply and Demand Concentration
Chapter 6 India Data Center Liquid Cooling Market Pricing Analysis
- 6.1 Pricing Structure and Measurement
- 6.2 Historical Pricing Trends, 2018-2025
- 6.3 Pricing Outlook, 2025-2035
- 6.4 Average Selling Price and Unit Economics
- 6.5 Pricing by Product and Market Segment
- 6.6 Geographic Pricing Differences
- 6.7 Key Input, Energy, Labor and Logistics Costs
- 6.8 Contract Pricing and Purchasing Models
- 6.9 Pricing Sensitivity and Competitive Positioning
- 6.10 Price, Margin and Profitability Implications
Chapter 7 India Data Center Liquid Cooling Market Dynamics
- 7.1 Market Growth Drivers
- 7.1.1 Demand-Side Drivers
- 7.1.2 Technology and Innovation Drivers
- 7.1.3 Infrastructure and Investment Drivers
- 7.1.4 Regulatory and Policy Drivers
- 7.2 Market Restraints
- 7.2.1 Cost and Affordability Constraints
- 7.2.2 Technology and Adoption Barriers
- 7.2.3 Supply Chain and Operational Constraints
- 7.3 Market Challenges
- 7.3.1 Competitive Pressure and Margin Erosion
- 7.3.2 Skills, Infrastructure and Implementation Gaps
- 7.4 Emerging Market Opportunities
- 7.5 Market Dynamics Impact and Time-Horizon Assessment
Chapter 8 India Data Center Liquid Cooling Value Chain Analysis
- 8.1 Industry Value Chain Overview
- 8.2 Upstream Suppliers and Critical Inputs
- 8.3 Technology and Component Providers
- 8.4 Manufacturing or Service Delivery
- 8.5 Distribution, Channel Partners and Integrators
- 8.6 Downstream Applications and End Users
- 8.7 Value Addition and Profit Pools
- 8.8 Vertical Integration and Outsourcing
- 8.9 Supplier Concentration and Risk
- 8.10 Supply Chain Localization and Resilience
Chapter 9 India Data Center Liquid Cooling Market Regulations and Policies
- 9.1 Relevant Laws, Standards and Compliance Frameworks
- 9.2 Product, Service, Safety and Quality Requirements
- 9.3 Government Policies, Incentives and Subsidies
- 9.4 Imports, Exports and Trade Barriers
- 9.5 Public Procurement and Local Content Requirements
- 9.6 Environmental and Sustainability Compliance
- 9.7 Data Protection, AI and Cybersecurity Compliance
- 9.8 Upcoming Policy Changes and Market Implications
Chapter 10 India Data Center Liquid Cooling Market Hotspots and Opportunities
- 10.1 Market Opportunity Mapping and Growth Hotspots
- 10.2 High-Growth Applications and Customer Groups
- 10.3 Underserved Markets and White-Space Opportunities
- 10.4 Emerging Technology and Product Opportunities
- 10.5 New Capacity and Investment Hotspots
- 10.6 Market Entry and Expansion Opportunities
- 10.7 Distribution and Partnership Opportunities
- 10.8 Near-Term and Long-Term Commercial Potential
- 10.9 Opportunity Attractiveness and Execution Risks
Chapter 11 India Data Center Liquid Cooling Market Outlook, 2025-2035
- 11.1 Market Size and Analysis
- 11.1.1 Revenue (Market Measurement: 2025: USD 207.7 million → 2035: USD 1.87 billion)
- 11.1.2 Market Volume and Quantity Sold
- 11.1.3 Historical Market Size, 2018-2025
- 11.1.4 Base-Year Market Size, 2025
- 11.2 Market Forecast, 2025-2035
- 11.2.1 Revenue Forecast to 2035
- 11.2.2 Volume Forecast to 2035
- 11.2.3 CAGR and Year-on-Year Growth
- 11.2.4 Incremental Revenue Opportunity
- 11.3 Forecast Assumptions and Scenario Analysis
- 11.3.1 Base-Case Forecast
- 11.3.2 Optimistic and Conservative Scenarios
- 11.3.3 Technology, Pricing and Policy Sensitivities
- 11.4 Market Attractiveness and Growth Outlook
Chapter 12 India Data Center Liquid Cooling Market Segmentation and Outlook
- 12.1 Segmentation Summary and Market Shares, 2025
- 12.2 Largest and Fastest-Growing Segments
- 12.3 By Cooling Type - Market Size and Forecast, 2025-2035
- 12.3.1 Segment Definition and Scope
- 12.3.2 Historical Market Size, 2018-2025
- 12.3.3 Revenue Forecast, 2025-2035
- 12.3.4 Volume Forecast, 2025-2035
- 12.3.5 Base-Year Market Share, 2025
- 12.3.6 Segment CAGR and Growth Drivers
- 12.3.7 Subsegment Market Size and Forecast
- 12.3.7.1 Direct-to-Chip Cooling
- 12.3.7.2 Hybrid Cooling Systems
- 12.3.7.3 Immersion Cooling
- 12.3.8 Subsegment Pricing and Adoption Trends
- 12.3.9 Leading Suppliers and Competition
- 12.3.10 Regional Demand and Opportunities
- 12.4 By Data Center Type - Market Size and Forecast, 2025-2035
- 12.4.1 Segment Definition and Scope
- 12.4.2 Historical Market Size, 2018-2025
- 12.4.3 Revenue Forecast, 2025-2035
- 12.4.4 Volume Forecast, 2025-2035
- 12.4.5 Base-Year Market Share, 2025
- 12.4.6 Segment CAGR and Growth Drivers
- 12.4.7 Subsegment Market Size and Forecast
- 12.4.7.1 Hyperscale Data Centers
- 12.4.7.2 Colocation Data Centers
- 12.4.7.3 Enterprise Data Centers
- 12.4.8 Subsegment Pricing and Adoption Trends
- 12.4.9 Leading Suppliers and Competition
- 12.4.10 Regional Demand and Opportunities
- 12.5 By End User - Market Size and Forecast, 2025-2035
- 12.5.1 Segment Definition and Scope
- 12.5.2 Historical Market Size, 2018-2025
- 12.5.3 Revenue Forecast, 2025-2035
- 12.5.4 Volume Forecast, 2025-2035
- 12.5.5 Base-Year Market Share, 2025
- 12.5.6 Segment CAGR and Growth Drivers
- 12.5.7 Subsegment Market Size and Forecast
- 12.5.7.1 IT & Cloud Service Providers
- 12.5.7.2 Financial Services
- 12.5.7.3 Manufacturing & Industrial
- 12.5.7.4 Healthcare & Pharmaceuticals
- 12.5.8 Subsegment Pricing and Adoption Trends
- 12.5.9 Leading Suppliers and Competition
- 12.5.10 Regional Demand and Opportunities
- 12.6 By Component - Market Size and Forecast, 2025-2035
- 12.6.1 Segment Definition and Scope
- 12.6.2 Historical Market Size, 2018-2025
- 12.6.3 Revenue Forecast, 2025-2035
- 12.6.4 Volume Forecast, 2025-2035
- 12.6.5 Base-Year Market Share, 2025
- 12.6.6 Segment CAGR and Growth Drivers
- 12.6.7 Subsegment Market Size and Forecast
- 12.6.7.1 Cooling Equipment
- 12.6.7.2 Chillers & Pumps
- 12.6.7.3 Heat Exchangers
- 12.6.7.4 Accessories
- 12.6.8 Subsegment Pricing and Adoption Trends
- 12.6.9 Leading Suppliers and Competition
- 12.6.10 Regional Demand and Opportunities
- 12.7 Segment Growth Comparison
- 12.8 Segment Attractiveness and Priority Matrix
Chapter 13 India Data Center Liquid Cooling End-Use and Application Market Outlook
- 13.1 End-Use Industry and Customer Demand Structure
- 13.2 Leading Applications and Customer Groups
- 13.3 End-Use Market Size, Share and Forecast
- 13.4 Major End-Use Industry Deep Dives
- 13.4.1 Customer Requirements and Use Cases
- 13.4.2 Demand and Replacement Cycles
- 13.4.3 Technical and Regulatory Considerations
- 13.4.4 Purchasing and Procurement Models
- 13.4.5 Leading Vendors and Distribution Channels
- 13.4.6 Forecast and Commercial Opportunities
- 13.5 Emerging Applications and Cross-Segment Demand
- 13.6 End-Use Industry Investment Priorities
Chapter 14 India Data Center Liquid Cooling Geographic Market Outlook, 2025-2035
- 14.1 Domestic Market Distribution and Demand Clusters
- 14.2 State- or Province-Wise Market Size and Forecast, 2025-2035
- 14.3 City and Metropolitan Market Outlook
- 14.4 Industrial, Manufacturing and Commercial Clusters
- 14.5 Geographic Concentration of Key End Users
- 14.6 Local Pricing and Purchasing Differences
- 14.7 Domestic Production Facilities and Capacity Map
- 14.8 Local Infrastructure and Project Pipeline
- 14.9 State-Level Policy and Incentive Differences
- 14.10 Subnational Investment Hotspots and Opportunities
- 14.11 Distribution and Logistics Networks
- 14.12 Domestic Competitive Footprint
Chapter 15 India Data Center Liquid Cooling Technology, Innovation and Sustainability Outlook
- 15.1 Technology Landscape and Maturity
- 15.2 Product, Process and Service Innovation
- 15.3 AI, Automation and Digital Tools in the Industry
- 15.4 Technology Adoption and Performance Benchmarking
- 15.5 Innovation Pipeline and R&D Investment
- 15.6 Patent and Intellectual Property Trends
- 15.7 Energy Efficiency and Resource Management
- 15.8 Sustainability, Recycling and Circularity
- 15.9 Technology Roadmap, 2025-2035
- 15.10 Risks of Obsolescence and Technology Substitution
Chapter 16 India Data Center Liquid Cooling Market Key Strategic Imperatives
- 16.1 Growth and Market Entry Priorities
- 16.2 High-Return Products and Segments
- 16.3 Pricing, Profitability and Cost Optimization
- 16.4 Technology Investment and Product Differentiation
- 16.5 Supply Chain Localization and Resilience
- 16.6 Distribution and Customer Acquisition
- 16.7 Partnership, Acquisition and Capacity Strategy
- 16.8 Regional Expansion Priorities
- 16.9 Short-, Medium- and Long-Term Actions
Chapter 17 Competition Outlook
- 17.1 Industry Competition Characteristics
- 17.2 Market Structure and Concentration
- 17.3 Market Share and Competitive Positioning, 2025
- 17.4 Company-Wise Revenue and Product Benchmarking
- 17.5 Production and Service Capacity Benchmarking
- 17.6 Technology, Pricing and Differentiation
- 17.7 Regional Footprint and Distribution Strength
- 17.8 Mergers, Acquisitions and Strategic Alliances
- 17.9 New Entrants and Competitive Threats
- 17.10 Porter's Five Forces and Industry Attractiveness
- 17.11 Competitive Outlook, 2025-2035
Chapter 18 Company Profiles
- 18.1 Company Coverage and Selection Criteria
- 18.2 Schneider Electric (Motivair)
- 18.2.1 Business Description
- 18.2.2 Company Ownership and Geographic Presence
- 18.2.3 Product and Service Portfolio
- 18.2.4 Manufacturing and Operating Footprint
- 18.2.5 Production Capacity and Expansion Plans
- 18.2.6 Financial Performance and Investment
- 18.2.7 Market Share and Competitive Position
- 18.2.8 Technology and Innovation Capabilities
- 18.2.9 Strategic Alliances or Partnerships
- 18.2.10 Recent Developments
- 18.2.11 Growth Strategy and Outlook
- 18.3 Vertiv
- 18.4 Johnson Controls
- 18.5 STULZ India
- 18.6 Refroid Technologies
- 18.7 Aeroflex Industries
- 18.8 Blue Star
- 18.9 Voltas
- 18.10 KRN Heat Exchanger
- 18.11 ZutaCore
- 18.12 Submer
- 18.13 Other Relevant Market Participants
Note: Every listed company is profiled on the structure shown under the first company. The company list is preliminary and may change based on research findings, market developments, data availability and client requirements.
Chapter 19 Disclaimer
- 19.1 Research and Forecast Disclaimer
- 19.2 Data Source and Estimation Limitations
Note: The depth of individual sections depends on data availability for this market. Volume, capacity, trade and other unit-based metrics are included where applicable.

