
Disclosure, carbon and supplier rules shape advisory demand
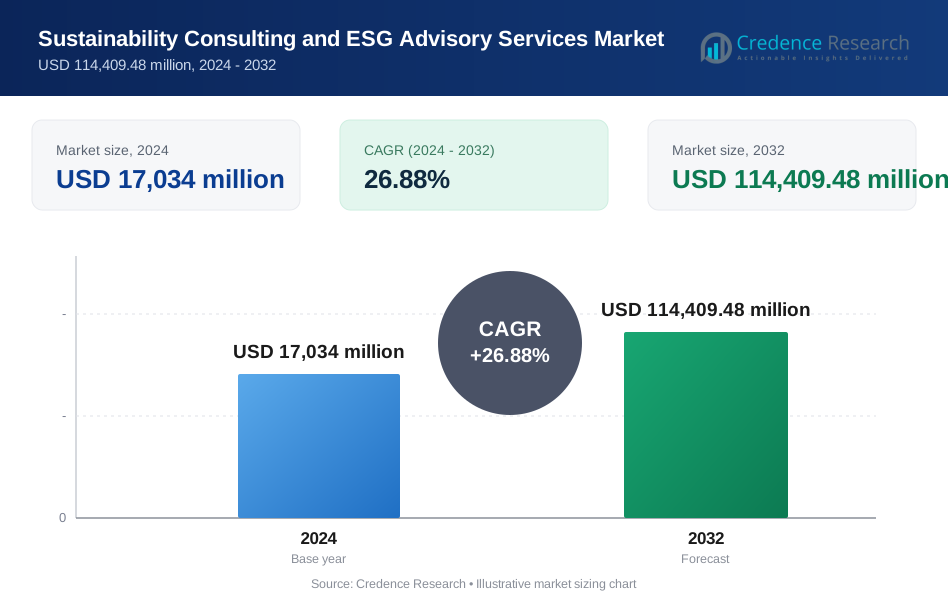
The global sustainability consulting and ESG advisory services market was valued at USD 21.61 billion in 2025 and is projected to increase from USD 24.96 billion in 2026 to USD 91.31 billion by 2035, registering a CAGR of 15.50% during 2026–2035. Demand comes from listed companies preparing assured climate disclosures, importers documenting carbon in traded goods, and groups turning net-zero pledges into capital plans. Europe held the largest regional share, 37.0% in 2025, because companies there have worked under the CSRD and now face a narrower but still binding rule set. Asia Pacific is the fastest-growing region at 18.1% a year as Japan phases in mandatory standards for its largest Prime Market companies and India widens assurance across listed companies. The main change in the period is the EU Omnibus I package, approved on Feb. 24, 2026, which sharply raised CSRD thresholds and moved consulting work away from first-time reporting and toward assurance, supplier data and decarbonization delivery for a smaller group of large buyers.
What do sustainability consulting and ESG advisory services include?
The market for sustainability consulting and ESG advisory services counts fees paid to external advisers for ESG strategy, sustainability reporting and disclosure, carbon footprinting and climate change consulting, ESG risk work and supply chain due diligence. Buyers usually purchase these as fixed-scope projects or multi-year retainers, often alongside a data platform chosen with the adviser.
Traditional environmental consulting, such as site investigation and remediation, overlaps with this market and is counted only when it forms part of a corporate sustainability or ESG engagement. Software licenses, ratings subscriptions and statutory audit fees are excluded, although limited assurance engagements on sustainability statements are counted within reporting and disclosure work.
Sustainability Consulting and ESG Advisory Services Market Insights
- Spending rises from USD 21.61 billion in 2025 to USD 91.31 billion by 2035, a 15.50% CAGR, in Credence Research estimates that depend on assurance and supplier data work replacing first-time reporting.
- Europe held 37.0% of 2025 value, supported by 4,769 companies with validated science-based targets at the end of 2025, according to the Science Based Targets initiative.
- Sustainability Reporting and Disclosure led with 27.0% of 2025 value because 41 jurisdictions had decided to use or were moving toward ISSB Standards by March 2026, according to the IFRS Foundation.
- The EU Omnibus I directive entered into force on March 18, 2026, and limited CSRD reporting to companies with more than 1,000 employees and over EUR 450 million in turnover.
- ERM and Arcadis added agentic AI and data platform partners in 2026, showing that large advisers now compete on delivery tools as well as on regulatory expertise and sector knowledge.
Reporting work leads while supply chain advice grows fastest
Why reporting leads and supply chain advice grows fastest
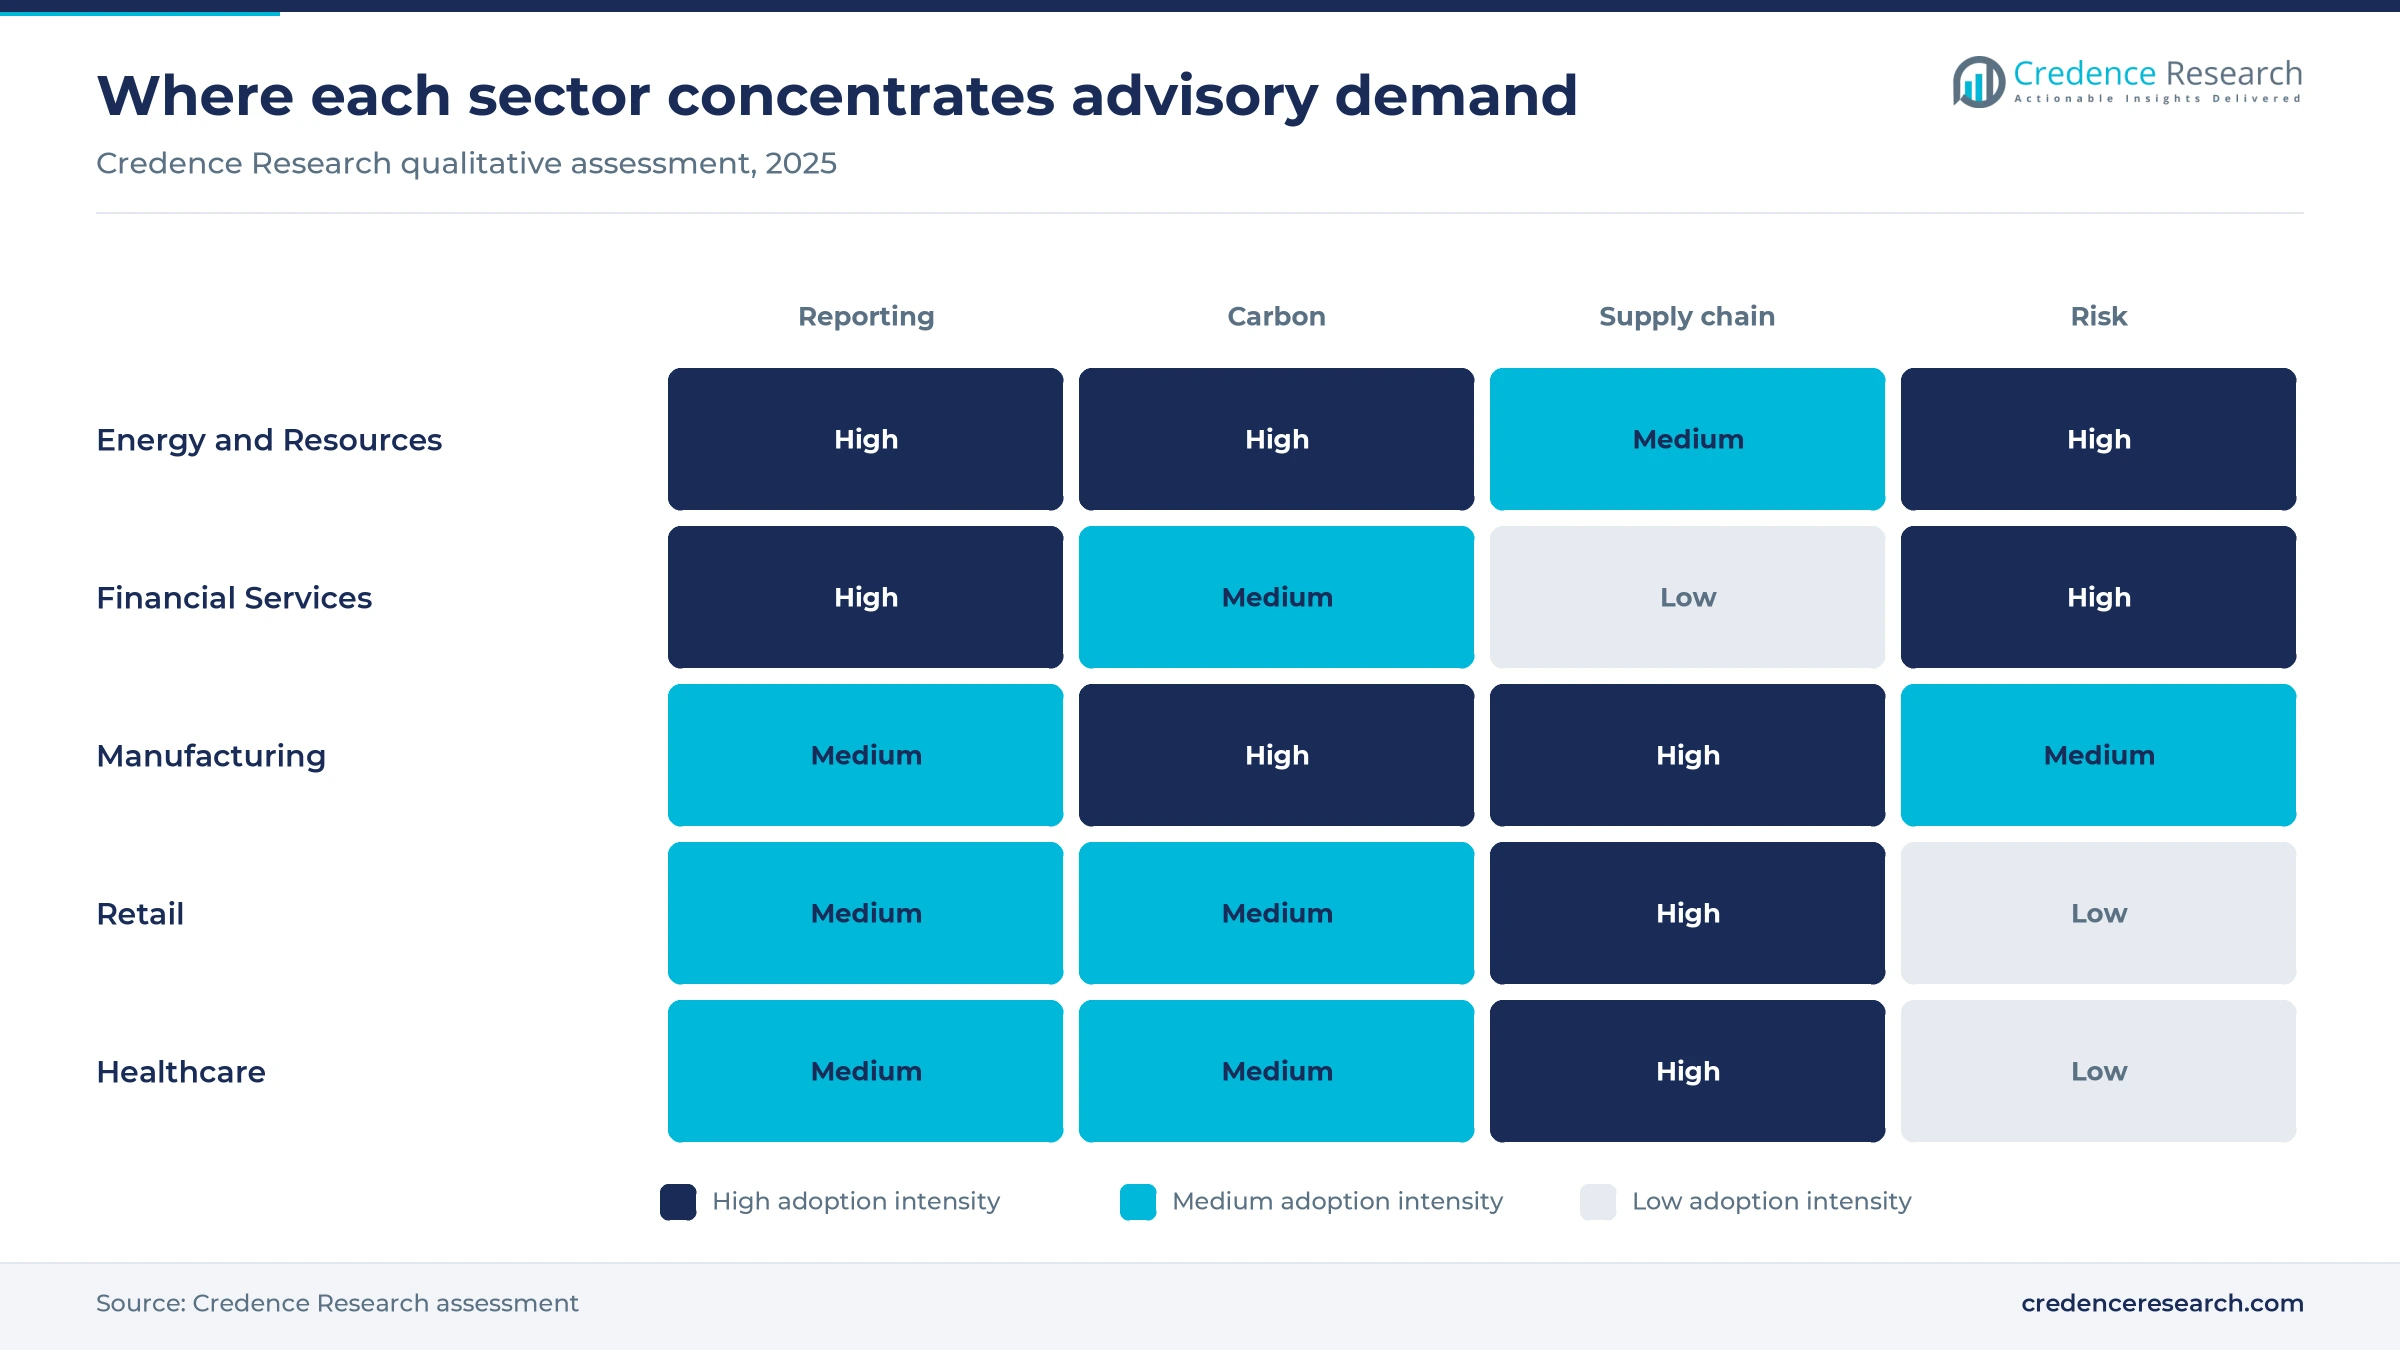
Based on type, the market is categorized into risk management, carbon footprint and climate change, supply chain management, ESG strategy and integration, sustainability reporting and disclosure, and others. Sustainability Reporting and Disclosure led with 27.0% of 2025 value because 12 jurisdictions on the IFRS Foundation's March 2026 list, including Australia, Singapore and Malaysia, had effective dates covering 2025 reports. Supply Chain Management grows fastest at 17.7% a year as iron, steel, aluminum and fertilizer importers above 50 tons a year have carried CBAM costs since Jan. 1, 2026, according to EY.
Energy leads sector spending as healthcare accelerates
Based on industry sector, the market is categorized into healthcare, energy and resources, financial services, pharma and biotechnology, manufacturing, retail and others. Energy and Resources led with 24.0% of 2025 value because energy groups must justify transition spending, and the IEA put 2025 energy investment at USD 3.3 trillion, including USD 2.2 trillion for clean energy. Healthcare grows fastest at 17.6% a year as the sector posted the fastest 2025 growth in validated climate targets, according to the Science Based Targets initiative, and NHS bidders on contracts of GBP 5 million or more must report all relevant Scope 3 emissions from April 1, 2027.
Large enterprises dominate as smaller suppliers enter
Based on end user, the market is categorized into large enterprises, small and medium enterprises (SMEs), government and public sector, and non-profit organizations. Large Enterprises led with 62.0% of 2025 value because the rules bite hardest at the top, with CSRD now reserved for companies above 1,000 employees and EUR 450 million in turnover and California SB 253 for those above USD 1 billion in revenue. Small and Medium Enterprises (SMEs) grows fastest at 18.0% a year as lenders and customers still ask smaller firms for data, and the European Commission recommended the voluntary VSME standard for those requests on July 30, 2025, according to Linklaters.
| Segment Group | Leading Sub-segment | Share, 2025 | Fastest-growing Sub-segment | CAGR, 2026–2035 |
|---|---|---|---|---|
| By Type | Sustainability Reporting and Disclosure | 27.0% | Supply Chain Management | 17.7% |
| By Industry Sector | Energy and Resources | 24.0% | Healthcare | 17.6% |
| By End User | Large Enterprises | 62.0% | Small and Medium Enterprises (SMEs) | 18.0% |
Request a Free Sample
Fill in your details and we'll send you a free sample report.
- Sample data tables & charts
- Research methodology
Mandates, targets and border rules drive consulting spend
ISSB adoption spreads disclosure work across 41 jurisdictions
Disclosure mandates now reach well beyond Europe, which widens the pool of first-time reporters needing outside help. The IFRS Foundation listed 41 jurisdictions using or moving toward ISSB Standards at the end of March 2026, with 17 in Asia-Oceania, 15 in Europe, the Middle East and Africa, and nine in the Americas. Twelve of them, including Australia, Singapore and Malaysia, had effective dates covering 2025 reports. Japan adds a clear pipeline, because the Financial Services Agency applies its SSBJ standards to Prime Market companies worth JPY 3 trillion or more from the fiscal year ending March 2027. As a result, disclosure support remains the largest service line, and buyers increasingly want cross-border reporting teams.
Validated climate targets turn pledges into long engagements
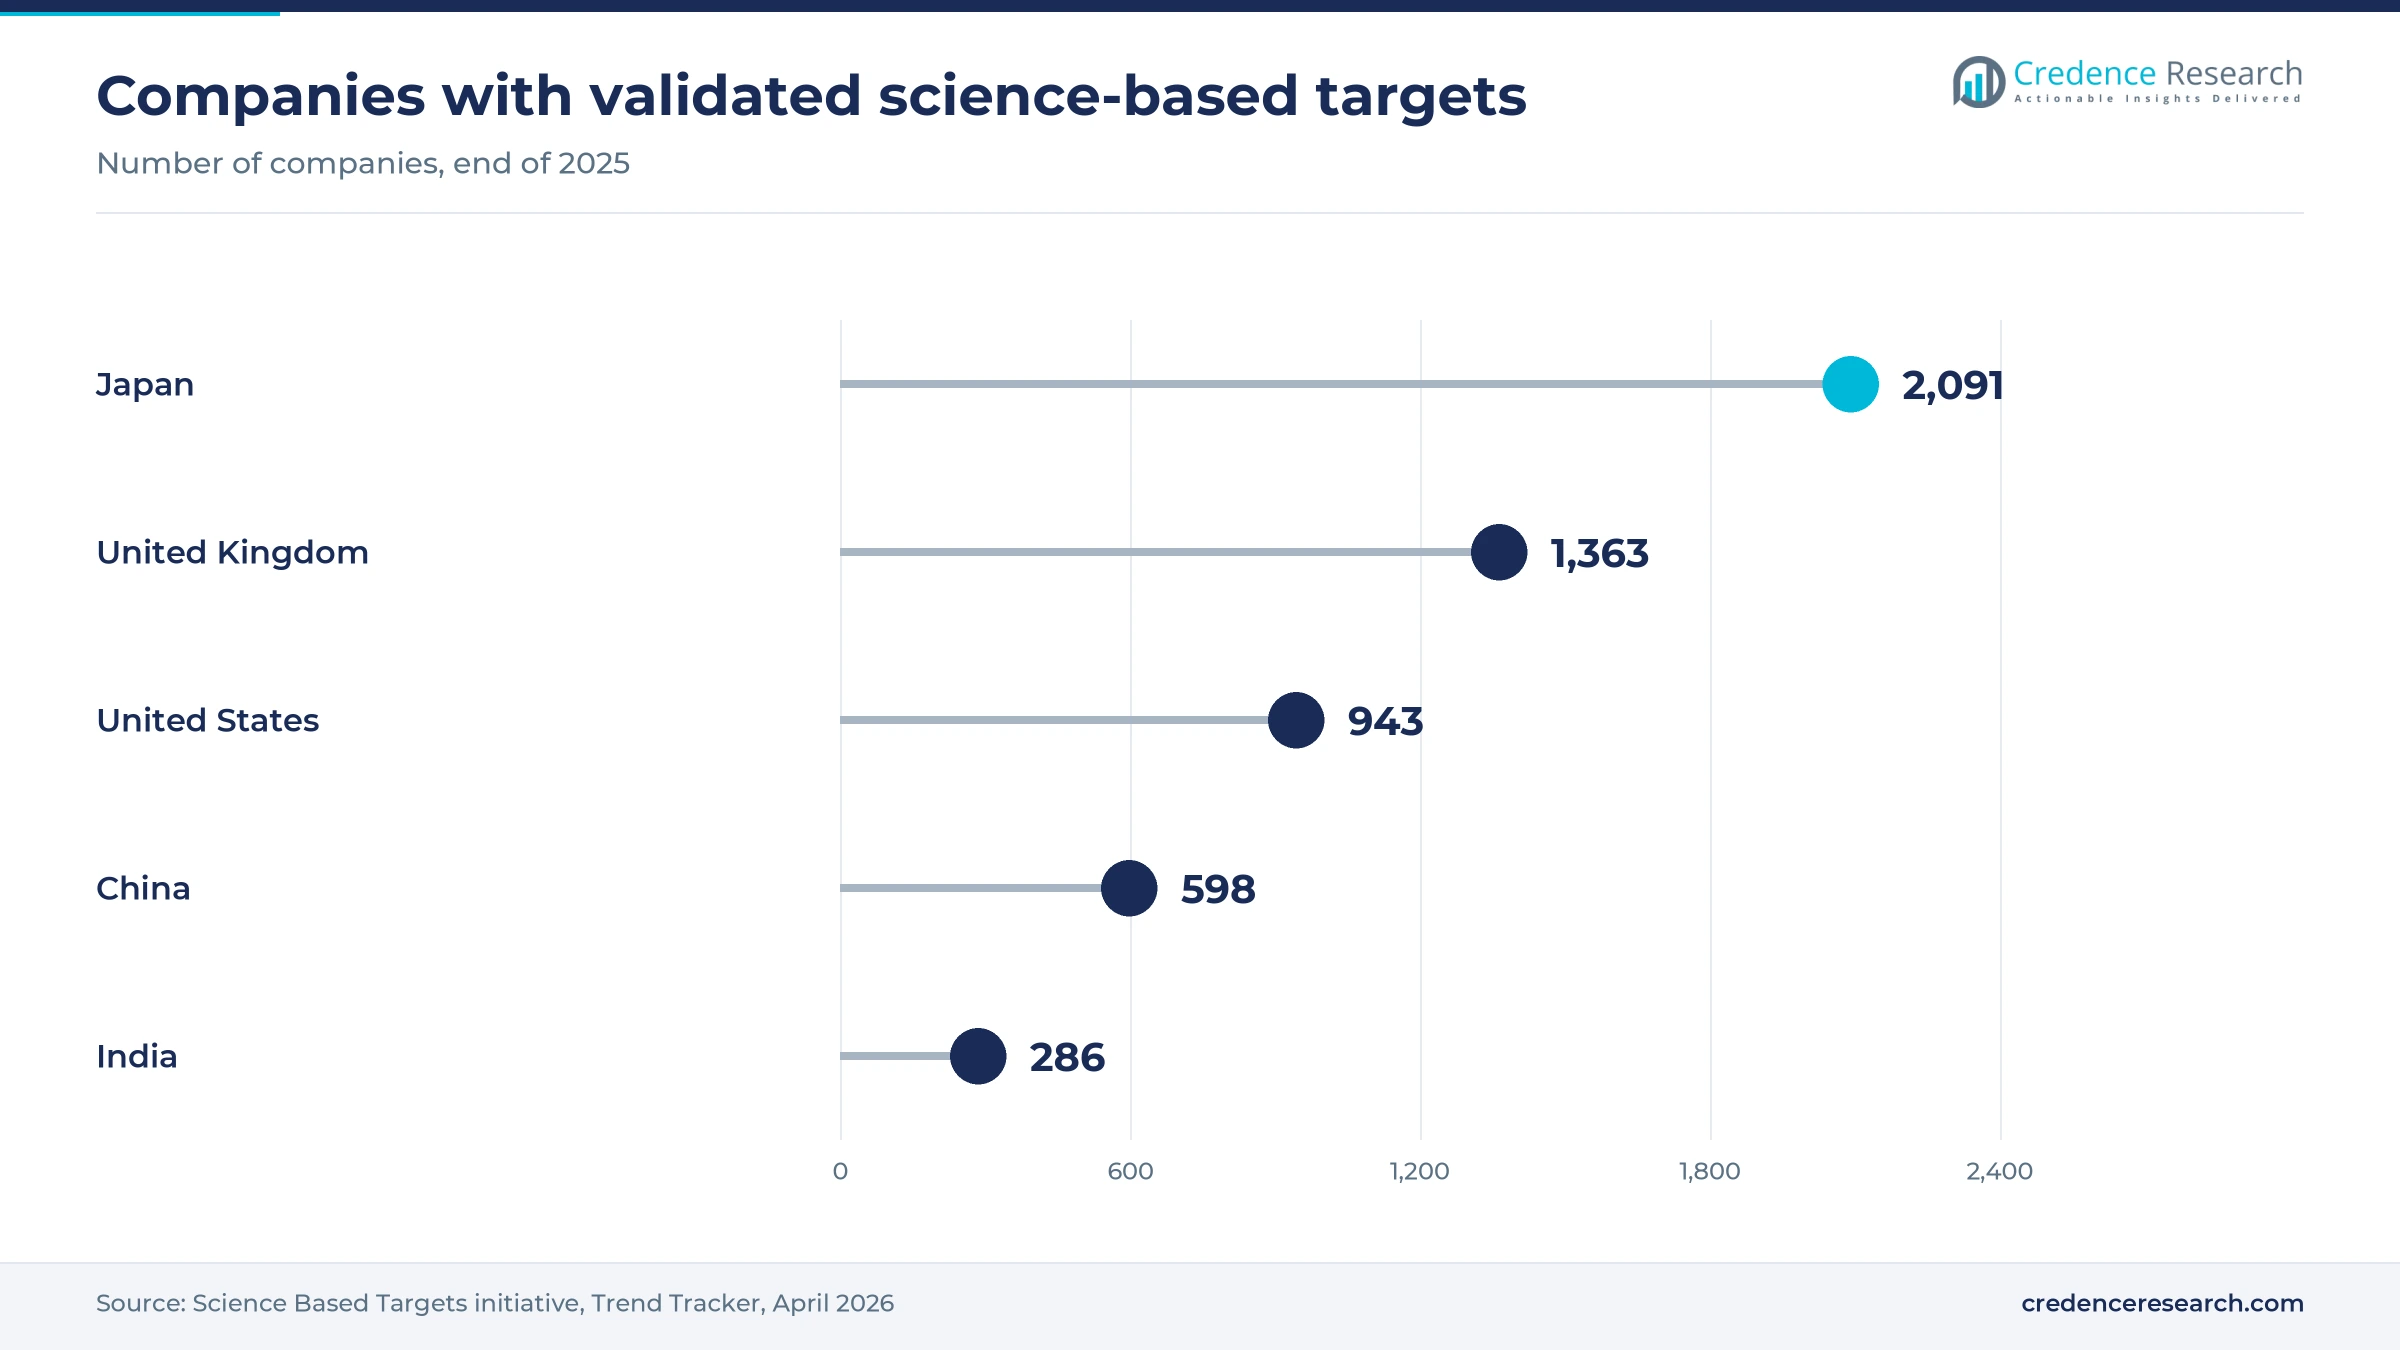
Companies with approved climate targets need help well after the announcement, because a target requires baselines, supplier engagement and annual progress tracking. The Science Based Targets initiative counted 9,764 companies with validated targets at the end of 2025, up 40% in a year, and passed 10,000 in January 2026. Validated net-zero targets rose faster, by 61%, which pushes buyers toward harder Scope 3 and transition planning work. Japan leads with 2,091 companies, ahead of the United Kingdom at 1,363 and the United States at 943. In turn, carbon footprint and climate change consulting holds a large share of spending, often alongside carbon emission management systems that keep the resulting data auditable.
Border carbon rules pull importers and suppliers into scope
Trade rules now create carbon work for companies that never published a sustainability report. The CBAM definitive regime began on Jan. 1, 2026, and EY notes that Regulation (EU) 2025/2083 replaced the old consignment exemption with a 50-ton annual threshold for iron, steel, aluminum and fertilizers. Importers then faced a March 31, 2026 date for authorization requests, certificate sales from February 2027 and a first annual declaration by Sept. 30, 2027. The EU also kept due diligence duties for companies above 5,000 employees and EUR 1.5 billion in turnover under Omnibus I, according to Eubelius. Those duties depend on supplier records, so supply chain analytics and advisory work are increasingly bought together.
Supervisors raise the cost of weak climate risk work in finance
Banks and asset managers buy ESG advisory work because supervisors now attach money to poor climate risk records. The European Central Bank announced periodic penalty payments of EUR 187,650 against ABANCA on Nov. 10, 2025, after the bank missed a materiality assessment deadline by 65 days. German authorities also fined DWS EUR 25 million over greenwashing, according to Simmons & Simmons in April 2025. The Basel Committee published a voluntary climate disclosure framework for banks on June 13, 2025, which gives lenders another template to assess. Together, these actions lift demand for controls around lending and green finance products, where claims must now survive supervisory review.
AI tools and assurance reshape how advisers deliver work
The rise of AI in sustainability consulting and ESG screening
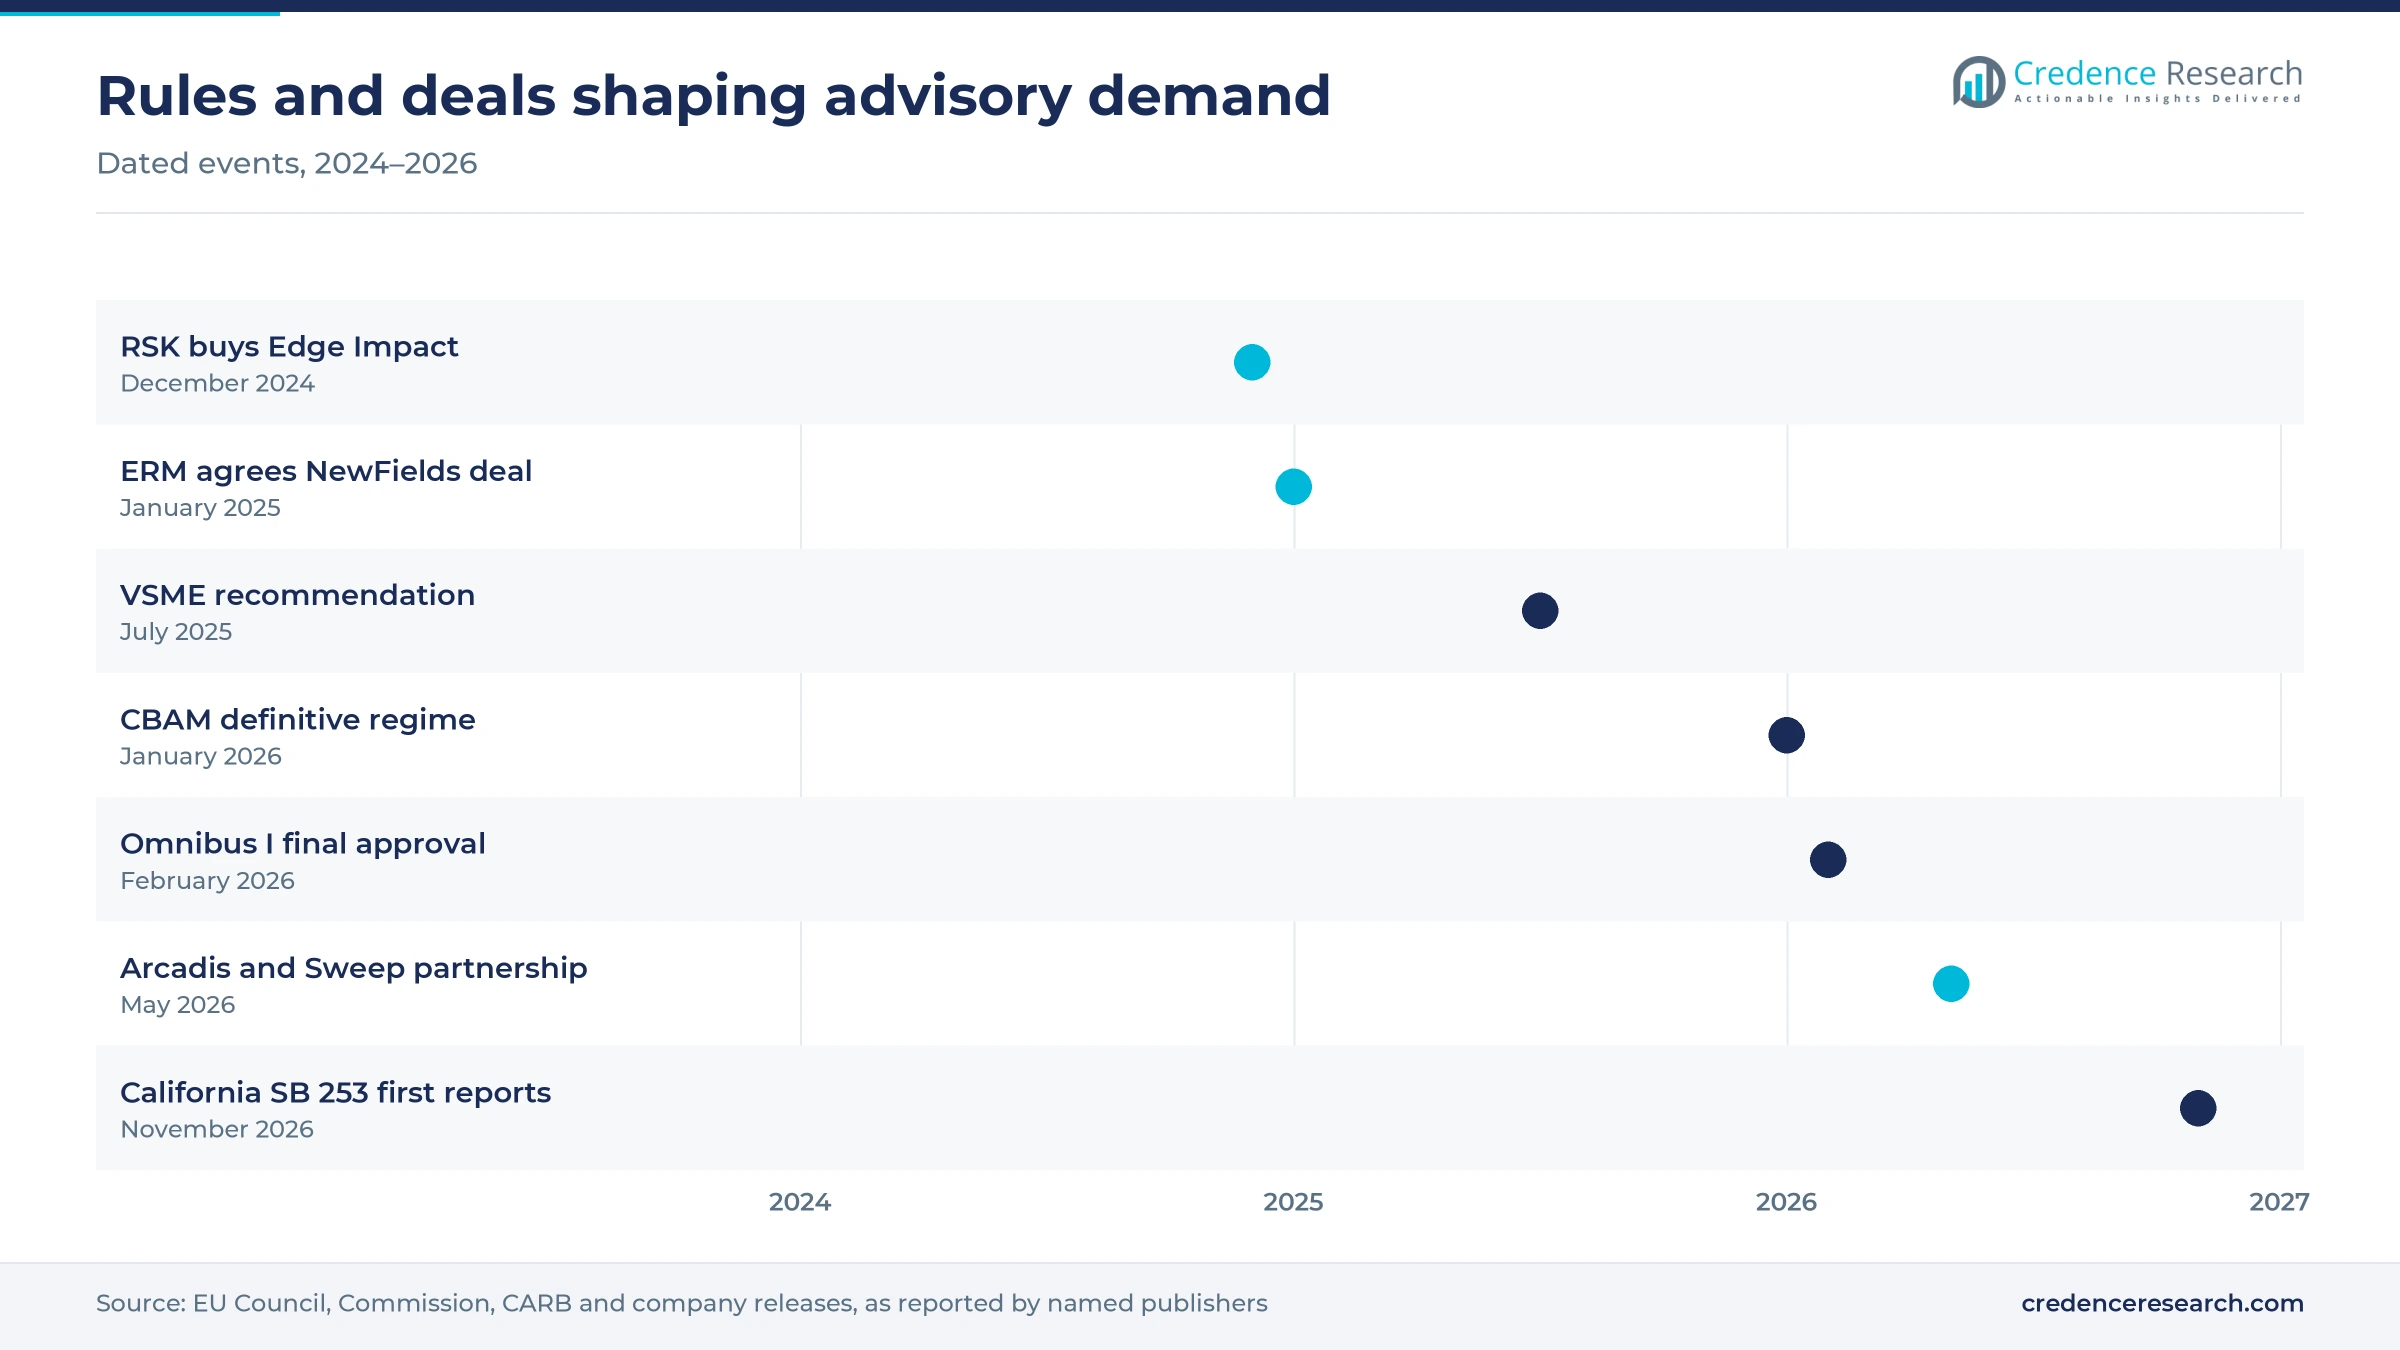
Artificial intelligence is shifting routine ESG analysis from junior consultants to software, which changes how sustainability consulting is priced. ERM partnered with Auquan on Jan. 28, 2026, to use agentic AI that scans news and company disclosures for reputational risk, according to Finextra, with support for EU SFDR Article 8 work as one stated goal. Arcadis and Sweep announced a global partnership on May 8, 2026, pairing a sustainability data platform with advisory delivery from a U.S. hub in Denver. This shift matters most in Sustainability Reporting and Disclosure, which holds 27.0% of 2025 value and contains much of the repeatable drafting. Buyers already using carbon management software increasingly expect advisers to work directly inside those systems.
A shift from drafting reports to supporting assurance
Advisory work is moving downstream as regulators demand verified numbers rather than narrative reports. KPMG found that all 94 NIFTY100 companies it reviewed chose reasonable assurance on BRSR Core for fiscal 2024-25, even though SEBI had allowed a lighter assessment option since March 2024. Another 57 of those companies bought voluntary third-party assurance on wider ESG information, and the mandate reaches the top 1,000 listed companies in fiscal 2026-27. Japan follows a similar path, with assurance starting one year after SSBJ reporting begins for each company group, according to the Financial Services Agency. Consequently, advisers are selling readiness reviews, internal controls and data lineage work, which sit between strategy and the assurance provider.
Asia sustainability consulting offers the clearest new client pool
Asia offers the largest pool of new buyers because target-setting there is growing faster than anywhere else. Validated companies in Asia rose 53% in 2025, from 2,297 to 3,513, according to the Science Based Targets initiative, and the region now holds 36% of all targets. China reached 598 companies and India 286, with health care targets in India up 108%. Asia Pacific therefore records the fastest regional growth in Credence Research estimates. Local presence is the entry barrier, which explains why RSK bought Edge Impact in December 2024, adding about 80 staff across Australia, New Zealand and Chile. Advisers with Japanese, Mandarin and Hindi-language delivery teams can win work that global centers struggle to serve.
Circular economy consulting opens through product rules
Product regulation creates an opening for circular economy consulting that does not depend on corporate reporting thresholds. The EU ban on destroying unsold apparel, clothing accessories and footwear began applying to large companies on July 19, 2026, according to USB Certification. The European Commission then launched its Digital Product Passport registry on July 20, 2026, and the first mandatory passports, for certain large batteries, follow on Feb. 18, 2027. Retail and manufacturing clients therefore need product-level data, design changes and take-back models rather than a sustainability statement. Materials advice is growing too, as a September 2026 Ramboll Management Consulting study suggested the EU could set a low-carbon concrete target above the 5% currently proposed.
EU scope cuts and U.S. rollbacks test the demand base
EU Omnibus I removes many planned CSRD clients
The largest near-term risk is a smaller European client base for first-time reporting work. Omnibus I replaced the old test of 250 employees, EUR 25 million in assets or EUR 50 million in turnover with cumulative thresholds of 1,000 employees and EUR 450 million in turnover, according to Eubelius. Mid-sized companies that had been preparing therefore lose their legal reporting duty. Advisers exposed to CSRD readiness face lower utilization and sharper price competition, which makes CBAM, value chain data and voluntary VSME support the natural areas to redeploy teams.
U.S. federal retreat leaves state rules carrying demand
U.S. demand now rests on a shaky legal base, which makes multi-year planning difficult for clients and advisers. WilmerHale reports that the SEC proposed rescinding its 2024 climate rules on May 29, 2026. California moved its first SB 253 reports from Aug. 10 to Nov. 10, 2026, while SB 261 remains enjoined by the Ninth Circuit. CARB also said it will not act against incomplete 2026 reports, which reduces urgency. Advisers can respond by selling reports that also serve EU and investor requests.
Greenwashing liability raises the stakes on every claim
Advisers and clients both carry more risk when environmental claims fail, because penalties are now large and public. An Australian court ordered Active Super to pay AUD 10.5 million on March 18, 2025, according to Allens, in a case brought by ASIC. The EU directive on empowering consumers applies from Sept. 27, 2026, with fines of up to 4% of annual revenue reported by Lider Media. Clients therefore narrow public claims and demand evidence files, which lengthens projects and requires advisers to accept tighter review and sign-off processes.
Green skills supply lags hiring across advisory teams
Talent remains a delivery constraint, because experienced carbon, assurance and sector specialists are difficult to hire quickly. LinkedIn data reported in December 2025 show green hiring grew 7.7% from 2024 to 2025 while green skills grew only 4.3%, and green talent was hired at a rate 46.6% above the global workforce. Smaller consultancies are likely to be exposed most, as larger groups can outbid them for staff. Retraining auditors and engineers is one response, although new hires need time before they can lead regulated assurance-readiness work.
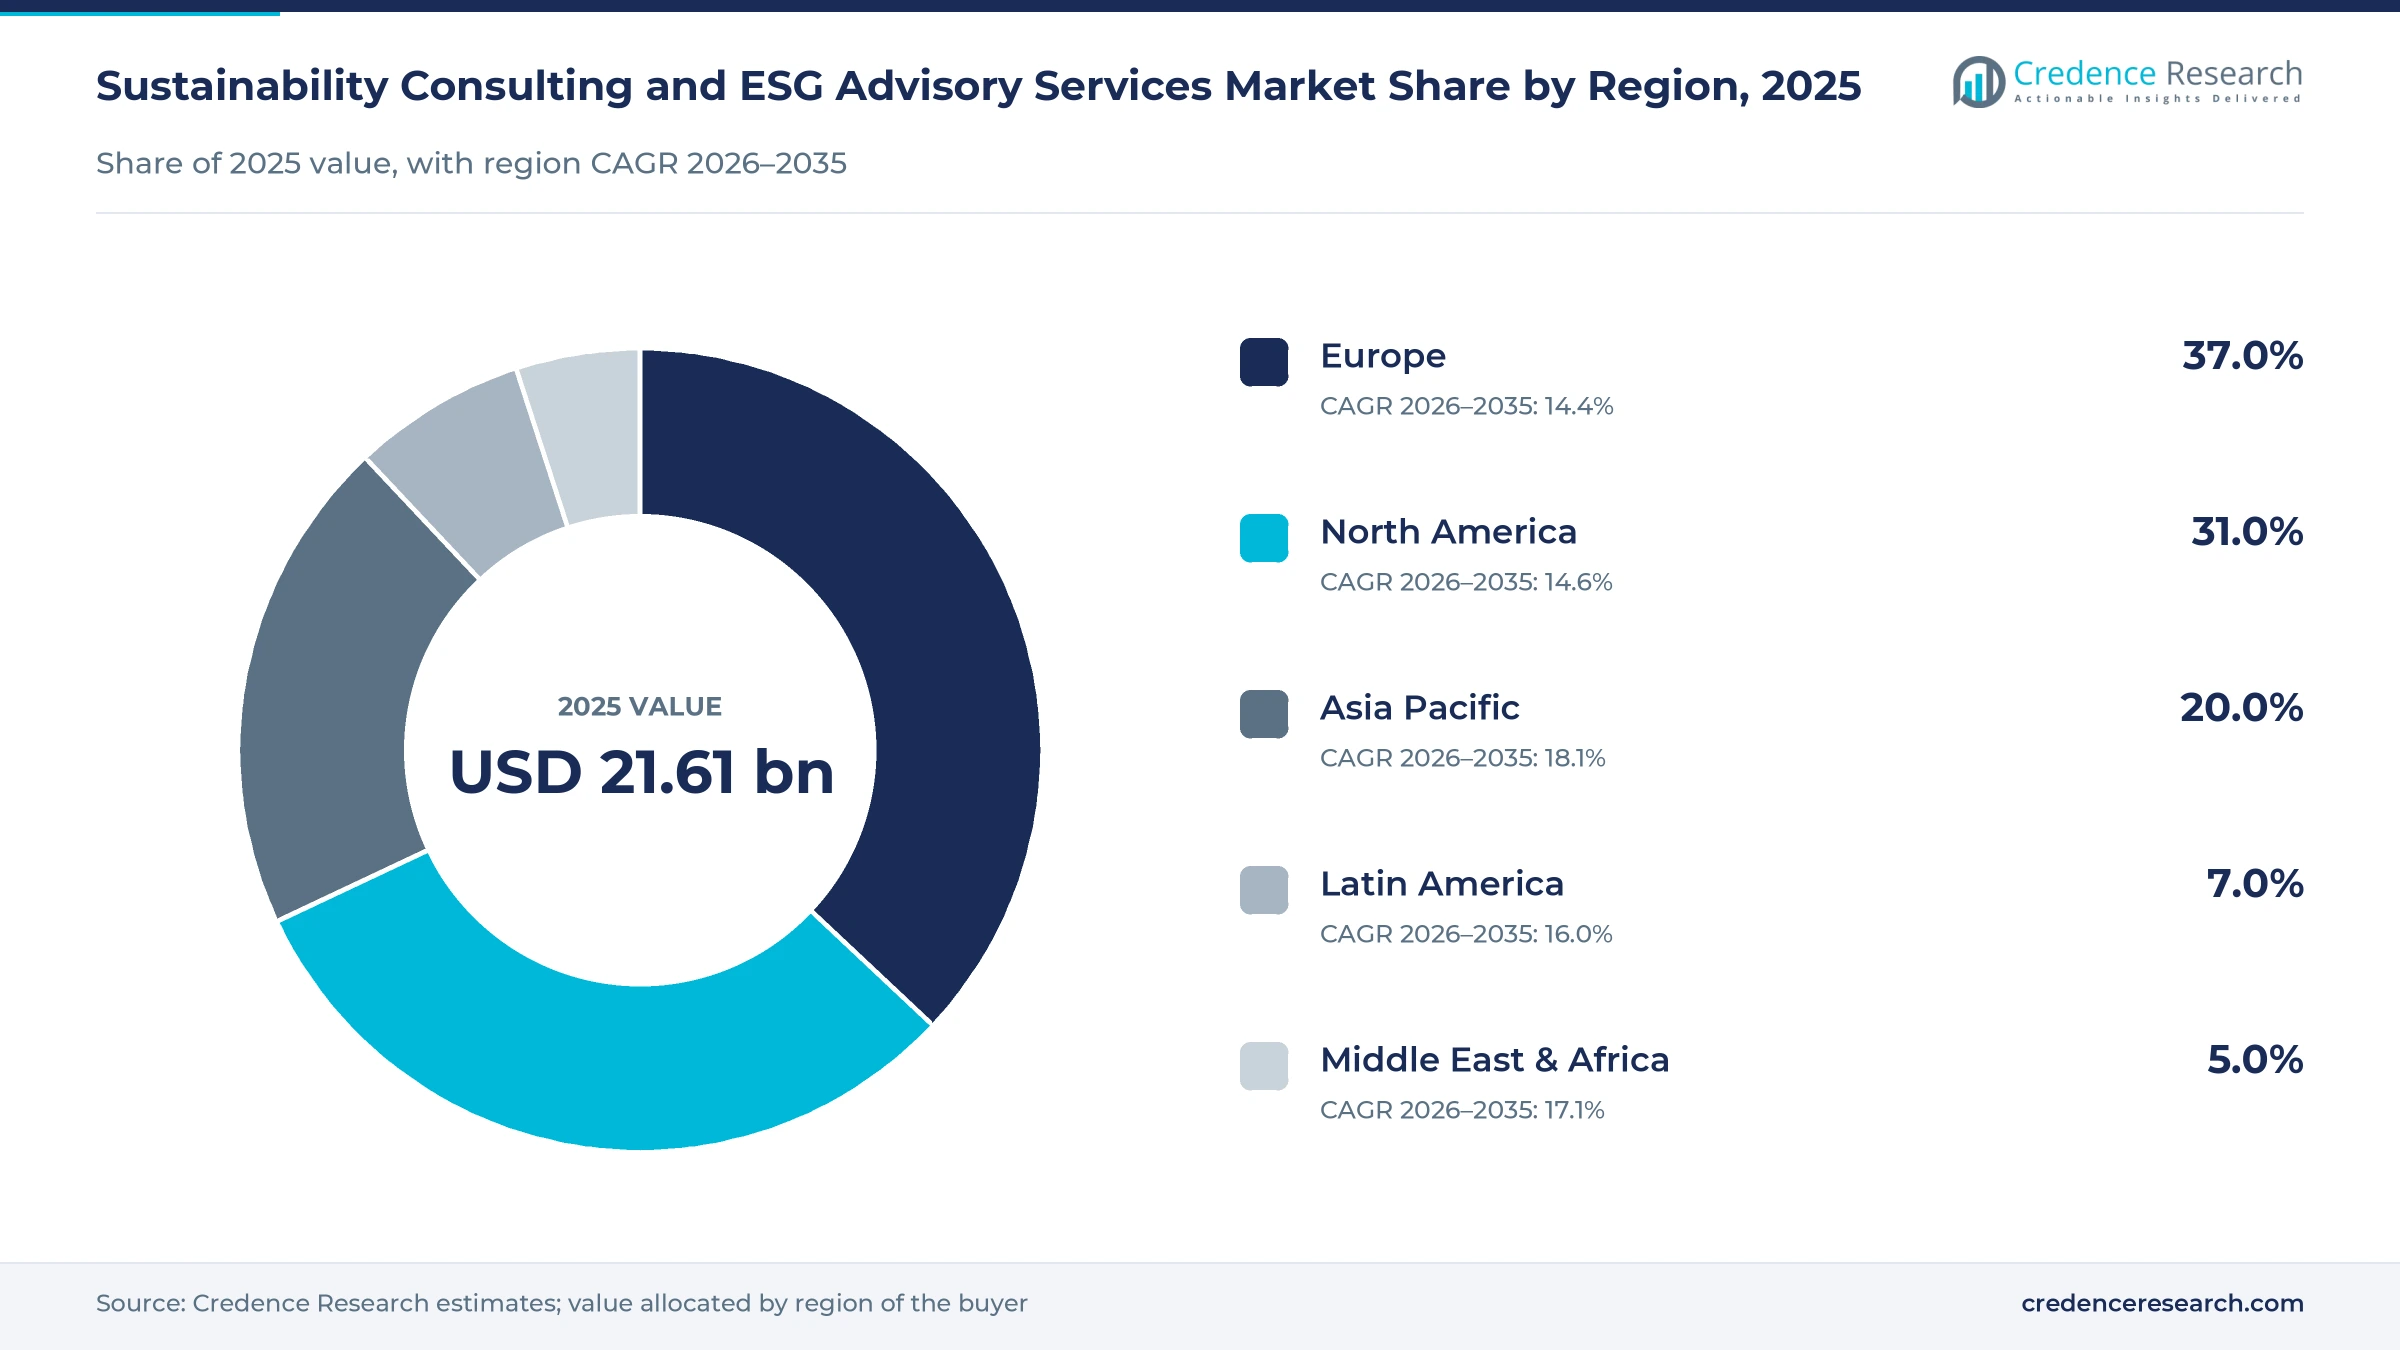
Europe leads spending while Asia Pacific adds new buyers
| Region | Value, 2025 (USD billion) | Share, 2025 | CAGR, 2026–2035 |
|---|---|---|---|
| Europe | 8.00 | 37.0% | 14.4% |
| North America | 6.70 | 31.0% | 14.6% |
| Asia Pacific | 4.32 | 20.0% | 18.1% |
| Latin America | 1.51 | 7.0% | 16.0% |
| Middle East & Africa | 1.08 | 5.0% | 17.1% |
Europe remains the largest ESG advisory market despite Omnibus cuts
Europe held 37.0% of 2025 value and grows at 14.4% a year, the slowest regional pace because Omnibus I has narrowed CSRD scope. ESG advisory in Europe still has a deep client base, with 4,769 companies holding validated science-based targets at the end of 2025, and the United Kingdom alone counts 1,363. Public work adds to this, as Ramboll is managing the second European Climate Risk Assessment, a 30-month program led by the European Environment Agency. Advisory work there is now shifting toward CBAM, product rules and assurance.
North America depends on California and investor requests
North America held 31.0% of 2025 value and grows at 14.6% a year as federal rules recede and state rules take over. California SB 253 covers companies doing business in the state with more than USD 1 billion in revenue, and New York, New Jersey and Illinois have proposed similar bills. The region counts 1,076 validated companies, including 943 in the United States. ERM deepened its remediation and environmental bench in January 2025 by agreeing to buy the NewFields environmental division and its 110 experts, according to ESG Today.
Asia Pacific grows fastest on Japan, India and Australia rules
Asia Pacific held 20.0% of 2025 value and is the fastest-growing region at 18.1% a year. Japan sets dated mandatory steps for Prime Market companies from March 2027, India extends BRSR Core assurance to the top 1,000 listed companies in fiscal 2026-27, and Australia added Group 2 reporters from July 1, 2026. Southeast Asia is also active, as Singapore operator Cora Environment signed a decarbonization framework agreement with Ramboll on Nov. 28, 2025. These programs give advisers a dated pipeline of named buyers.
Latin America shifts after Brazil softens its mandate
Latin America held 7.0% of 2025 value and grows at 16.0% a year, with growth tempered by Brazil. The securities regulator CVM dropped planned mandatory ISSB-aligned reporting through Resolution 244 and adopted a comply-or-explain model, according to ESG News. Voluntary reporters must still report for three consecutive years, which preserves some recurring work. The IFRS Foundation lists Chile with a 2026 effective date and Peru with 2027, while validated companies in Latin America and the Caribbean rose 42% in 2025, from 122 to 173.
Middle East & Africa builds on the UAE climate law
Middle East & Africa held 5.0% of 2025 value and grows at 17.1% a year from a small base. The UAE climate law took effect on May 30, 2025, and applies to public and private emitters, including free zones, with first-offense fines from AED 50,000 to AED 2 million, according to PwC. Qatar and Jordan appear on the IFRS Foundation list for 2026 and Nigeria for 2027. Validated companies in Africa rose 48% in 2025, from 46 to 62, so demand remains concentrated among exporters and large groups.
Partnerships and rule changes marked 2026
| Development | Status and market relevance |
|---|---|
| In January 2026, ERM partnered with Auquan to apply agentic AI to ESG and reputational risk screening, according to Finextra. | Announced; supports faster due diligence and EU SFDR Article 8 work |
| In February 2026, the Council of the EU gave final approval to the Omnibus I package, which entered into force on March 18, 2026. | In force; narrows CSRD and due diligence scope |
| In April 2026, the Science Based Targets initiative reported 9,764 companies with validated targets at the end of 2025. | Published; confirms Asia as the fastest-growing region for target-setting |
| In May 2026, Arcadis and Sweep announced a global partnership for data-driven ESG consulting, with a U.S. hub in Denver. | Announced; client showcase planned for the fourth quarter of 2026 |
| In May 2026, Ramboll was listed as managing the second European Climate Risk Assessment for the European Environment Agency. | Ongoing; 30-month program supporting public climate risk planning |
Data platforms now sit inside advisory engagements
- Agentic AI screening scans news and disclosures for ESG risk signals, as in the ERM and Auquan arrangement announced in January 2026.
- Sustainability data platforms give advisers a shared system for client data, as in the Arcadis and Sweep partnership announced in May 2026.
- Digital product passports link product data to a European Commission registry launched in July 2026, with large batteries first due in February 2027.
- Assurance-ready data controls trace each reported metric to its source, which matters as Japan and India phase assurance into their reporting rules.
Need a Custom Version of This Report?
Tailor the scope, geography, or segments to your exact requirements.
- Custom geography or segment scope
- Direct access to our analyst team
Strategy houses and engineering groups compete for mandates
Competition splits into three groups with different routes to the buyer. Strategy houses such as McKinsey & Company and Boston Consulting Group sell board-level decarbonization and transition work, while Deloitte, EY and PwC pair advisory teams with assurance capability where independence rules allow. Specialist and engineering-led groups such as ERM, Arcadis, Ramboll, Stantec, Jacobs and Mott MacDonald win work tied to physical assets, permits and climate adaptation. RSK Group follows a different approach, buying focused firms and keeping their brands, as it did with Edge Impact in December 2024. Partnerships are now as important as acquisitions, shown by ERM with Auquan and Arcadis with Sweep in 2026. Price pressure is highest in standardized reporting, where software reduces hours. Margins hold better in regulated assurance readiness, CBAM data and transition planning, because errors there carry direct financial or legal consequences for the client.
Companies profiled and their roles in this market
| Company | Type | Role in the market |
|---|---|---|
| Deloitte | Professional services | Global Sustainability and Climate practice spanning strategy, reporting and ESG assurance |
| EY | Professional services | Sustainability advisory and regulatory analysis, including CBAM alerts |
| PwC | Professional services | Sustainability consulting, climate transition services and ESG reporting assurance |
| McKinsey & Company | Strategy consultancy | Board-level decarbonization strategy and climate transition planning for large companies |
| Boston Consulting Group | Strategy consultancy | Climate and sustainability strategy, net-zero roadmaps and transition program delivery |
| Environmental Resources Management (ERM) | Specialist consultancy | Sustainability and environmental advice; agentic AI partnership with Auquan in 2026 |
| Arcadis NV | Engineering and advisory | Data-driven ESG consulting with Sweep, announced in May 2026 |
| Ramboll Group A/S | Engineering and advisory | Manages the second European Climate Risk Assessment |
| Stantec | Engineering and advisory | Climate adaptation, environmental permitting and ESG advice tied to infrastructure assets |
| Jacobs | Engineering and advisory | Climate resilience planning and environmental consulting for public and private clients |
| Mott MacDonald | Engineering and advisory | Net-zero, climate resilience and environmental advisory for infrastructure owners |
| RSK Group | Environmental group | Acquired Edge Impact, a climate disclosure and Scope 3 adviser |
Advisers must sell decisions rather than compliance forms
Credence Research's view is that sustainability consulting and ESG advisory services are moving from a compliance rush toward a smaller set of harder decisions. The firms best placed are those that can link a reported number to a capital, procurement or product choice, because Omnibus I and the proposed SEC rescission show that filing obligations can change quickly. The 15.50% CAGR is the most assumption-heavy figure in this report, since it requires assurance, CBAM and supplier data work to more than replace lost first-time reporting.
How the advisory market model and splits were built
The report uses 2025 as the base year and 2026–2035 as the forecast period. Market values come from the Credence Research model, and segment and regional splits are Credence Research estimates. Evidence comes from regulators, standard setters, company announcements, law firm and professional services briefings, and published statistics opened during this update. No interviews or surveys were conducted for this edition of the report.
Assurance and supplier data should carry growth to 2035
Growth to USD 91.31 billion by 2035 depends less on new reporting mandates than on what companies do after they report. Japan's dated steps through March 2029, India's assurance glide path and CBAM declarations from September 2027 give advisers a visible pipeline through the first half of the forecast. The later years rely on transition planning, product rules and supplier data becoming routine purchases. A further round of rollbacks like those in the EU, the United States and Brazil would be the main reason for growth to fall short of this path.
Frequently Asked Questions
How big is the sustainability consulting and ESG advisory services market?
What is the difference between ESG advisory and environmental consulting?
Which type of service holds the largest share?
How is AI changing sustainability consulting services?
How does the EU Omnibus affect demand for ESG advisory in Europe?
Which region is growing fastest?
What does circular economy consulting cover in this market?
Who are the main companies in this market?
Table of Content
Chapter 1 Market Segmentation
- 1.1 Segmentation Framework
- 1.1.1 Product and Service Classification
- 1.1.2 Application and End-Use Classification
- 1.1.3 Technology and Solution Classification
- 1.1.4 Customer and Distribution Channel Classification
- 1.1.5 Geographic Segmentation
- 1.1.6 Market Segment Definitions and Boundaries
- 1.2 By Type
- 1.2.1 Sustainability Reporting and Disclosure
- 1.2.2 Carbon Footprint and Climate Change
- 1.2.3 ESG Strategy and Integration
- 1.2.4 Risk Management
- 1.2.5 Supply Chain Management
- 1.2.6 Others
- 1.3 By Industry Sector
- 1.3.1 Energy and Resources
- 1.3.2 Financial Services
- 1.3.3 Manufacturing
- 1.3.4 Retail
- 1.3.5 Pharma & Biotechnology
- 1.3.6 Healthcare
- 1.3.7 Others
- 1.4 By End User
- 1.4.1 Large Enterprises
- 1.4.2 Small and Medium Enterprises (SMEs)
- 1.4.3 Government and Public Sector
- 1.4.4 Non-Profit Organizations
Chapter 2 Introduction
- 2.1 Report Objectives and Scope
- 2.2 Product Definition and Industry Terminology
- 2.3 Market Inclusions and Exclusions
- 2.4 Research Process
- 2.4.1 Primary Research and Expert Interviews
- 2.4.2 Secondary Research and Source Review
- 2.4.3 Top-Down and Bottom-Up Estimation
- 2.4.4 Data Triangulation and Verification
- 2.5 Market Size Measurement Basis
- 2.5.1 2025: USD 21.61 billion → 2035: USD 91.31 billion
- 2.6 Historical and Forecast Reference Periods
- 2.6.1 Historical Period: 2018-2025
- 2.6.2 Base Year: 2025
- 2.6.3 Forecast Period: 2025-2035
- 2.7 Research Assumptions and Limitations
Chapter 3 Executive Summary
- 3.1 Market Snapshot and Key Findings
- 3.2 Base-Year Market Size, 2025
- 3.3 Forecast Market Size, 2035
- 3.4 Revenue and Volume Growth Outlook
- 3.5 Key Demand and Supply Indicators
- 3.6 Leading Market Segments
- 3.7 Fastest-Growing Market Opportunities
- 3.8 Regional Performance Highlights
- 3.9 Technology and Industry Transformation
- 3.10 Competitive Landscape Summary
- 3.11 Analyst View and Strategic Implications
Chapter 4 Global Sustainability Consulting and ESG Advisory Services Market Trends and Developments
- 4.1 Historical Industry Development, 2018-2025
- 4.2 Recent Market Trends and Developments
- 4.3 Demand and Customer Behavior Trends
- 4.4 Technology and Product Innovation
- 4.5 Artificial Intelligence, Automation and Digitalization
- 4.6 Local Manufacturing and Supply Chain Realignment
- 4.7 Industry Partnerships, Mergers and Acquisitions
- 4.8 Sustainability and Circular Economy Developments
- 4.9 Government and Private Sector Investment Trends
- 4.10 Emerging Business Models and Commercialization
- 4.11 Industry Developments and Announcements
Chapter 5 Global Sustainability Consulting and ESG Advisory Services Market Supply and Demand Analysis
- 5.1 Demand Trend and Consumption Analysis, 2018-2025
- 5.2 Demand Forecast, 2025-2035
- 5.3 Supply Chain Structure and Procurement Trends
- 5.4 Supply-Demand Gap and Bottlenecks
- 5.5 Import Dependence and Sourcing Structure
- 5.6 Regional Supply and Demand Concentration
Chapter 6 Global Sustainability Consulting and ESG Advisory Services Market Pricing Analysis
- 6.1 Pricing Structure and Measurement
- 6.2 Historical Pricing Trends, 2018-2025
- 6.3 Pricing Outlook, 2025-2035
- 6.4 Pricing by Product and Market Segment
- 6.5 Geographic Pricing Differences
- 6.6 Key Input, Energy, Labor and Logistics Costs
- 6.7 Contract Pricing and Purchasing Models
- 6.8 Pricing Sensitivity and Competitive Positioning
- 6.9 Price, Margin and Profitability Implications
Chapter 7 Global Sustainability Consulting and ESG Advisory Services Market Dynamics
- 7.1 Market Growth Drivers
- 7.1.1 Demand-Side Drivers
- 7.1.2 Technology and Innovation Drivers
- 7.1.3 Infrastructure and Investment Drivers
- 7.1.4 Regulatory and Policy Drivers
- 7.2 Market Restraints
- 7.2.1 Cost and Affordability Constraints
- 7.2.2 Technology and Adoption Barriers
- 7.2.3 Supply Chain and Operational Constraints
- 7.3 Market Challenges
- 7.3.1 Competitive Pressure and Margin Erosion
- 7.3.2 Skills, Infrastructure and Implementation Gaps
- 7.4 Emerging Market Opportunities
- 7.5 Market Dynamics Impact and Time-Horizon Assessment
Chapter 8 Global Sustainability Consulting and ESG Advisory Services Value Chain Analysis
- 8.1 Industry Value Chain Overview
- 8.2 Upstream Suppliers and Critical Inputs
- 8.3 Technology and Component Providers
- 8.4 Manufacturing or Service Delivery
- 8.5 Distribution, Channel Partners and Integrators
- 8.6 Downstream Applications and End Users
- 8.7 Value Addition and Profit Pools
- 8.8 Vertical Integration and Outsourcing
- 8.9 Supplier Concentration and Risk
- 8.10 Supply Chain Localization and Resilience
Chapter 9 Global Sustainability Consulting and ESG Advisory Services Market Regulations and Policies
- 9.1 Relevant Laws, Standards and Compliance Frameworks
- 9.2 Product, Service, Safety and Quality Requirements
- 9.3 Government Policies, Incentives and Subsidies
- 9.4 Imports, Exports and Trade Barriers
- 9.5 Public Procurement and Local Content Requirements
- 9.6 Data Protection, AI and Cybersecurity Compliance
- 9.7 Upcoming Policy Changes and Market Implications
Chapter 10 Global Sustainability Consulting and ESG Advisory Services Market Hotspots and Opportunities
- 10.1 Market Opportunity Mapping and Growth Hotspots
- 10.2 High-Growth Applications and Customer Groups
- 10.3 Underserved Markets and White-Space Opportunities
- 10.4 Emerging Technology and Product Opportunities
- 10.5 New Capacity and Investment Hotspots
- 10.6 Market Entry and Expansion Opportunities
- 10.7 Distribution and Partnership Opportunities
- 10.8 Near-Term and Long-Term Commercial Potential
- 10.9 Opportunity Attractiveness and Execution Risks
Chapter 11 Global Sustainability Consulting and ESG Advisory Services Market Outlook, 2025-2035
- 11.1 Market Size and Analysis
- 11.1.1 Revenue (Market Measurement: 2025: USD 21.61 billion → 2035: USD 91.31 billion)
- 11.1.2 Historical Market Size, 2018-2025
- 11.1.3 Base-Year Market Size, 2025
- 11.2 Market Forecast, 2025-2035
- 11.2.1 Revenue Forecast to 2035
- 11.2.2 CAGR and Year-on-Year Growth
- 11.2.3 Incremental Revenue Opportunity
- 11.3 Forecast Assumptions and Scenario Analysis
- 11.3.1 Base-Case Forecast
- 11.3.2 Optimistic and Conservative Scenarios
- 11.3.3 Technology, Pricing and Policy Sensitivities
- 11.4 Market Attractiveness and Growth Outlook
Chapter 12 Global Sustainability Consulting and ESG Advisory Services Market Segmentation and Outlook
- 12.1 Segmentation Summary and Market Shares, 2025
- 12.2 Largest and Fastest-Growing Segments
- 12.3 By Type - Market Size and Forecast, 2025-2035
- 12.3.1 Segment Definition and Scope
- 12.3.2 Historical Market Size, 2018-2025
- 12.3.3 Revenue Forecast, 2025-2035
- 12.3.4 Base-Year Market Share, 2025
- 12.3.5 Segment CAGR and Growth Drivers
- 12.3.6 Subsegment Market Size and Forecast
- 12.3.6.1 Sustainability Reporting and Disclosure
- 12.3.6.2 Carbon Footprint and Climate Change
- 12.3.6.3 ESG Strategy and Integration
- 12.3.6.4 Risk Management
- 12.3.6.5 Supply Chain Management
- 12.3.6.6 Others
- 12.3.7 Subsegment Pricing and Adoption Trends
- 12.3.8 Leading Suppliers and Competition
- 12.3.9 Regional Demand and Opportunities
- 12.4 By Industry Sector - Market Size and Forecast, 2025-2035
- 12.4.1 Segment Definition and Scope
- 12.4.2 Historical Market Size, 2018-2025
- 12.4.3 Revenue Forecast, 2025-2035
- 12.4.4 Base-Year Market Share, 2025
- 12.4.5 Segment CAGR and Growth Drivers
- 12.4.6 Subsegment Market Size and Forecast
- 12.4.6.1 Energy and Resources
- 12.4.6.2 Financial Services
- 12.4.6.3 Manufacturing
- 12.4.6.4 Retail
- 12.4.6.5 Pharma & Biotechnology
- 12.4.6.6 Healthcare
- 12.4.6.7 Others
- 12.4.7 Subsegment Pricing and Adoption Trends
- 12.4.8 Leading Suppliers and Competition
- 12.4.9 Regional Demand and Opportunities
- 12.5 By End User - Market Size and Forecast, 2025-2035
- 12.5.1 Segment Definition and Scope
- 12.5.2 Historical Market Size, 2018-2025
- 12.5.3 Revenue Forecast, 2025-2035
- 12.5.4 Base-Year Market Share, 2025
- 12.5.5 Segment CAGR and Growth Drivers
- 12.5.6 Subsegment Market Size and Forecast
- 12.5.6.1 Large Enterprises
- 12.5.6.2 Small and Medium Enterprises (SMEs)
- 12.5.6.3 Government and Public Sector
- 12.5.6.4 Non-Profit Organizations
- 12.5.7 Subsegment Pricing and Adoption Trends
- 12.5.8 Leading Suppliers and Competition
- 12.5.9 Regional Demand and Opportunities
- 12.6 Segment Growth Comparison
- 12.7 Segment Attractiveness and Priority Matrix
Chapter 13 Global Sustainability Consulting and ESG Advisory Services End-Use and Application Market Outlook
- 13.1 End-Use Industry and Customer Demand Structure
- 13.2 Leading Applications and Customer Groups
- 13.3 End-Use Market Size, Share and Forecast
- 13.4 Major End-Use Industry Deep Dives
- 13.4.1 Customer Requirements and Use Cases
- 13.4.2 Demand and Replacement Cycles
- 13.4.3 Technical and Regulatory Considerations
- 13.4.4 Purchasing and Procurement Models
- 13.4.5 Leading Vendors and Distribution Channels
- 13.4.6 Forecast and Commercial Opportunities
- 13.5 Emerging Applications and Cross-Segment Demand
- 13.6 End-Use Industry Investment Priorities
Chapter 14 Global Sustainability Consulting and ESG Advisory Services Geographic Market Outlook, 2025-2035
- 14.1 Regional Market Size and Share, 2025
- 14.2 Regional Market Forecast, 2025-2035
- 14.3 Regional Pricing, Production and Demand Differences
- 14.4 North America
- 14.4.1 United States
- 14.4.2 Canada
- 14.4.3 Mexico
- 14.5 Europe
- 14.5.1 Germany
- 14.5.2 France
- 14.5.3 Italy
- 14.5.4 United Kingdom
- 14.5.5 Spain
- 14.5.6 Poland
- 14.5.7 Russia
- 14.5.8 Netherlands
- 14.5.9 Belgium
- 14.5.10 Sweden
- 14.5.11 Denmark
- 14.5.12 Norway
- 14.5.13 Rest of Europe
- 14.6 Asia Pacific
- 14.6.1 China
- 14.6.2 India
- 14.6.3 Japan
- 14.6.4 South Korea
- 14.6.5 Thailand
- 14.6.6 Indonesia
- 14.6.7 Vietnam
- 14.6.8 Malaysia
- 14.6.9 Australia
- 14.6.10 Rest of Asia Pacific
- 14.7 Latin America
- 14.7.1 Brazil
- 14.7.2 Argentina
- 14.7.3 Colombia
- 14.7.4 Chile
- 14.7.5 Rest of Latin America
- 14.8 Middle East
- 14.8.1 Saudi Arabia
- 14.8.2 United Arab Emirates
- 14.8.3 Turkey
- 14.8.4 Israel
- 14.8.5 Iran
- 14.8.6 Rest of the Middle East
- 14.9 Africa
- 14.9.1 South Africa
- 14.9.2 Egypt
- 14.9.3 Nigeria
- 14.9.4 Morocco
- 14.9.5 Rest of Africa
- 14.10 Regional Investment, Policy and Supply Chain Differences
- 14.11 Regional Competitive Landscape
- 14.12 Geographic Growth Hotspots
Chapter 15 Global Sustainability Consulting and ESG Advisory Services Technology, Innovation and Sustainability Outlook
- 15.1 Technology Landscape and Maturity
- 15.2 Product, Process and Service Innovation
- 15.3 AI, Automation and Digital Tools in the Industry
- 15.4 Technology Adoption and Performance Benchmarking
- 15.5 Innovation Pipeline and R&D Investment
- 15.6 Energy Efficiency and Resource Management
- 15.7 Sustainability, Recycling and Circularity
- 15.8 Technology Roadmap, 2025-2035
- 15.9 Risks of Obsolescence and Technology Substitution
Chapter 16 Global Sustainability Consulting and ESG Advisory Services Market Key Strategic Imperatives
- 16.1 Growth and Market Entry Priorities
- 16.2 High-Return Products and Segments
- 16.3 Pricing, Profitability and Cost Optimization
- 16.4 Technology Investment and Product Differentiation
- 16.5 Supply Chain Localization and Resilience
- 16.6 Distribution and Customer Acquisition
- 16.7 Partnership, Acquisition and Capacity Strategy
- 16.8 Regional Expansion Priorities
- 16.9 Short-, Medium- and Long-Term Actions
Chapter 17 Competition Outlook
- 17.1 Industry Competition Characteristics
- 17.2 Market Structure and Concentration
- 17.3 Market Share and Competitive Positioning, 2025
- 17.4 Company-Wise Revenue and Product Benchmarking
- 17.5 Production and Service Capacity Benchmarking
- 17.6 Technology, Pricing and Differentiation
- 17.7 Regional Footprint and Distribution Strength
- 17.8 Mergers, Acquisitions and Strategic Alliances
- 17.9 New Entrants and Competitive Threats
- 17.10 Porter's Five Forces and Industry Attractiveness
- 17.11 Competitive Outlook, 2025-2035
Chapter 18 Company Profiles
- 18.1 Company Coverage and Selection Criteria
- 18.2 Deloitte
- 18.2.1 Business Description
- 18.2.2 Company Ownership and Geographic Presence
- 18.2.3 Product and Service Portfolio
- 18.2.4 Manufacturing and Operating Footprint
- 18.2.5 Financial Performance and Investment
- 18.2.6 Market Share and Competitive Position
- 18.2.7 Technology and Innovation Capabilities
- 18.2.8 Strategic Alliances or Partnerships
- 18.2.9 Recent Developments
- 18.2.10 Growth Strategy and Outlook
- 18.3 EY
- 18.4 PwC
- 18.5 McKinsey & Company
- 18.6 Boston Consulting Group
- 18.7 Environmental Resources Management (ERM)
- 18.8 Arcadis NV
- 18.9 Ramboll Group A/S
- 18.10 Stantec
- 18.11 Jacobs
- 18.12 Mott MacDonald
- 18.13 RSK Group
- 18.14 Other Relevant Market Participants
Note: Every listed company is profiled on the structure shown under the first company. The company list is preliminary and may change based on research findings, market developments, data availability and client requirements.
Chapter 19 Disclaimer
- 19.1 Research and Forecast Disclaimer
- 19.2 Data Source and Estimation Limitations
Note: The depth of individual sections depends on data availability for this market. Volume, capacity, trade and other unit-based metrics are included where applicable.

