Market Overview
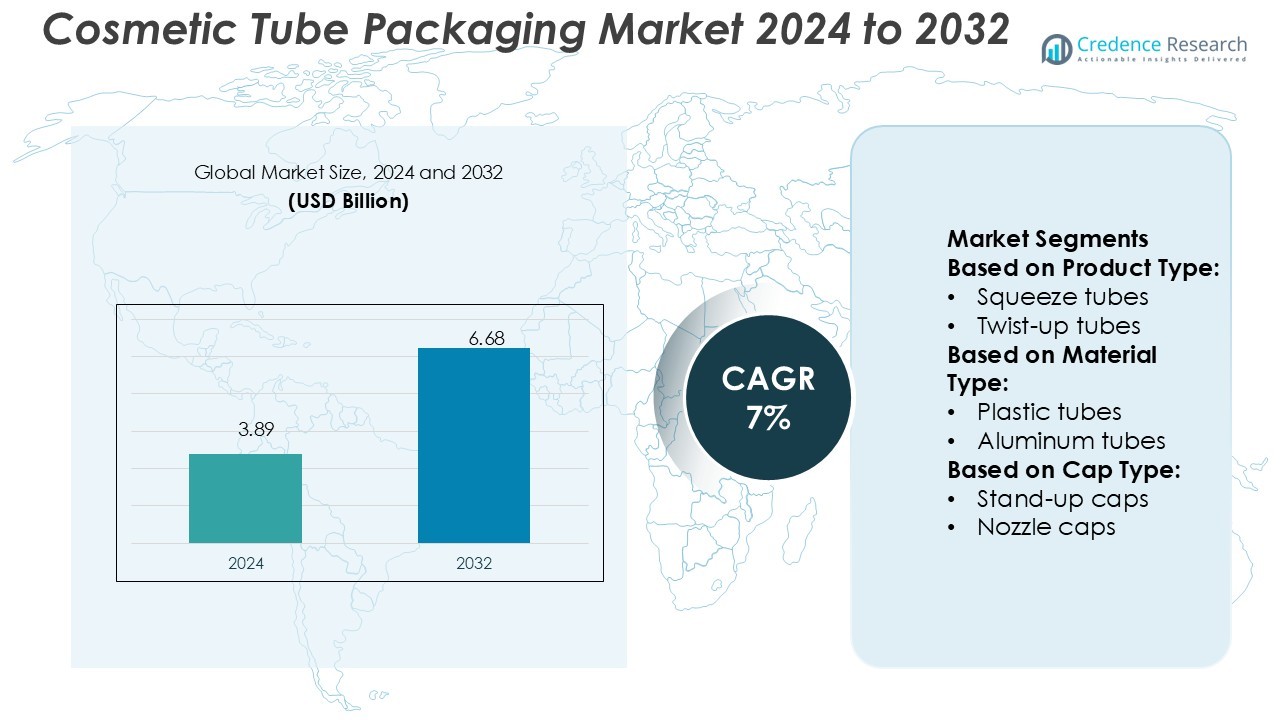
Cosmetic Tube Packaging Market size was valued USD 3.89 billion in 2024 and is anticipated to reach USD 6.68 billion by 2032, at a CAGR of 7% during the forecast period.
| REPORT ATTRIBUTE |
DETAILS |
| Historical Period |
2020-2023 |
| Base Year |
2024 |
| Forecast Period |
2025-2032 |
| Cosmetic Tube Packaging Market Size 2024 |
USD 3.89 Billion |
| Cosmetic Tube Packaging Market, CAGR |
7% |
| Cosmetic Tube Packaging Market Size 2032 |
USD 6.68 Billion |
The cosmetic tube packaging market is shaped by major players including Tubopress Italia Spa, CCL Industries Inc., Linhardt GmbH & Co KG, Albéa Beauty Holdings S.A, Berry Global Group, Inc., Intrapac International Corporation, Essel Propack Ltd, Montebello Packaging Inc., Hoffmann Neopac Ag, and Huhtamaki Oyj. These companies lead through advanced manufacturing capabilities, sustainable packaging solutions, and innovative tube designs tailored for skincare and personal care applications. They focus on eco-friendly materials, lightweight structures, and digital printing to enhance product appeal and meet regulatory goals. Asia Pacific holds the leading position with a 34% market share, supported by rapid beauty product consumption, strong local manufacturing, and expanding e-commerce channels. Strategic expansions and technology integration by top players continue to strengthen regional dominance and shape the market’s future growth trajectory.
Access crucial information at unmatched prices!
Request your sample report today & start making informed decisions powered by Credence Research Inc.!
Download Sample
Market Insights
- The cosmetic tube packaging market was valued at USD 3.89 billion in 2024 and is expected to reach USD 6.68 billion by 2032, growing at a CAGR of 7%.
- Rising skincare and personal care demand drives growth, supported by lightweight, eco-friendly, and travel-friendly tube formats.
- The market is shaped by major players focusing on recyclable materials, digital printing, and advanced manufacturing for competitive advantage.
- Regulatory pressure on sustainability and raw material cost fluctuations remain key restraints affecting profitability and expansion.
- Asia Pacific leads with a 34% market share, while squeeze tubes dominate the product segment, driven by strong demand across skincare and cosmetics categories.
Market Segmentation Analysis:
By Product Type
Squeeze tubes dominate the cosmetic tube packaging market with a major market share. Their popularity stems from cost-effectiveness, easy dispensing, and strong compatibility with creams, lotions, and gels. Brands favor squeeze tubes for their lightweight design and high printability, which enhances product appeal. For instance, several cosmetic firms use multi-layer squeeze tubes to improve product protection and extend shelf life. This sub-segment benefits from its flexibility in size customization and high-speed production capability, making it ideal for mass-market skincare and personal care products.
- For instance, Linhardt’s TopTube design reduces overall tube weight by shifting the shoulder function into the cap. In a 200 ml version (Ø 50 mm × 160 mm), this allows the tube wall thickness to be reduced from a standard 500 µm to a thinner layer (e.g., 300 µm), trimming the tube weight from approximately 22.8 g down to 12.0 g.
By Material Type
Plastic tubes hold the leading share in the material type segment due to their durability and cost efficiency. These tubes offer excellent flexibility and resistance to breakage, making them ideal for travel-friendly and daily-use products. The ability to incorporate advanced barrier layers enhances product protection against moisture and air exposure. Many manufacturers use recyclable or bio-based plastic to address sustainability concerns, strengthening their market position. Their adaptability in decoration and design also supports strong brand differentiation in premium and mass segments alike.
- For instance, Albéa developed its (Re)flex tube technology, a single-material PE Basic Cap is engineered for compatibility with 30, 35, 40, and 50 mm diameters, reducing component count while preserving barrier properties.
By Cap Type
Flip-top caps account for the largest share in the cap type segment. These caps are preferred for their user-friendly design, secure closure, and precise product dispensing. Cosmetics brands adopt flip-top caps to improve convenience, especially in skincare and haircare products where controlled application matters. Their compatibility with various tube materials and shapes enhances packaging versatility. In addition, the increasing use of tamper-evident features and sustainable cap materials is reinforcing their dominance in both premium and mid-range cosmetic packaging lines.
Key Growth Drivers
Rising Demand for Convenient and Portable Packaging
The growing preference for on-the-go cosmetics is driving strong demand for tube packaging. Consumers favor lightweight, travel-friendly formats that ensure ease of use and controlled dispensing. Squeeze and flip-top tube designs meet this demand effectively. Brands are also adopting compact formats to align with changing lifestyles and urban mobility. For instance, major skincare brands are launching mini and travel-size tubes for serums and moisturizers. This shift toward portability enhances market penetration across retail, e-commerce, and personal care segments.
- For instance, Berry responds through its DecoFusion™ tube technology, achieving up to 27 % weight saving compared to standard tubes while retaining full 360° printability.
Expansion of Skincare and Personal Care Segments
The rapid growth of skincare and personal care categories is a key market driver. Tubes are ideal for creams, gels, and lotions due to their product protection and hygienic dispensing. Global beauty brands increasingly prefer tubes for premium formulations, targeting both mass and luxury segments. For instance, several international cosmetic firms use multi-layer barrier tubes to prevent contamination and extend shelf life. This rising product adoption in moisturizers, sunscreens, and anti-aging products significantly boosts demand for cosmetic tube packaging.
- For instance, laminate tube lines can achieve impressive production rates, the figure of “exceeding 18,000 tubes per hour” is a high-end capability, not a standard for all lines. More common speeds for high-volume machines are in the range of 100-250 tubes per minute, depending on the machine, tube dimensions, and line complexity.
Focus on Sustainable and Recyclable Solutions
Sustainability initiatives are fueling innovation in eco-friendly tube packaging. Companies are investing in recyclable plastics, bio-based materials, and mono-material tubes to reduce environmental impact. Brands are also adopting lightweight designs to minimize transportation emissions. For instance, several leading cosmetic companies introduced fully recyclable tubes with reduced resin use. These innovations align with global sustainability goals and regulatory guidelines, driving market adoption. The growing consumer preference for green packaging further accelerates the shift toward sustainable tube packaging solutions.
Key Trends & Opportunities
Adoption of Premium and Customizable Designs
Brands are increasingly using premium and customized tube designs to enhance product appeal. High-end decoration techniques like soft-touch finishes, metallic foils, and digital printing are gaining traction. These designs help differentiate products in competitive skincare and cosmetic categories. For instance, luxury beauty brands use airless and multi-layer tubes for a premium look and improved functionality. This trend creates opportunities for packaging manufacturers to offer value-added services and expand their presence in the premium beauty segment.
- For instance, EPL Limited (formerly Essel Propack) has developed the Platina lamitube, which contains less than 5% barrier resin and has passed APR HDPE critical guidance, combining recyclability with barrier protection.
Digital Printing and Smart Packaging Integration
The growing adoption of digital printing allows faster turnaround and high-quality graphics on tubes. This trend supports limited-edition launches and personalized packaging strategies. Many brands also integrate QR codes and smart labels to enhance consumer engagement. For instance, cosmetic firms are embedding scannable codes that link to product information, tutorials, or promotions. This integration of digital features with packaging creates new branding opportunities and helps companies strengthen consumer loyalty and marketing efficiency.
- For instance, Montebello uses HP Indigo digital presses to print directly on laminate tube webs, supporting up to 6-color (CMYKOVG) extended-gamut graphics. Vignettes, small text reproduction, and photographic images with tight registration.
Growing Penetration of E-Commerce Channels
E-commerce growth is expanding opportunities for durable, protective, and lightweight packaging formats. Tube packaging is well-suited for online retail because it resists breakage and ensures secure product delivery. Many cosmetic brands are optimizing tube formats to fit e-commerce packaging standards and reduce shipping costs. For instance, skincare and makeup brands are launching compact tubes designed for direct-to-consumer channels. This shift strengthens market reach and supports product differentiation in a highly competitive digital marketplace.
Key Challenges
Regulatory and Sustainability Compliance
Strict environmental and packaging waste regulations pose challenges for manufacturers. Companies must invest in recyclable and compliant materials while maintaining cost efficiency. For instance, upcoming single-use plastic restrictions in several countries are pushing brands to redesign packaging formats. Compliance with extended producer responsibility (EPR) schemes also raises operational costs. Balancing sustainability goals with production economics remains a major challenge for cosmetic tube packaging suppliers and brands.
Volatility in Raw Material Prices
Fluctuating prices of plastic resins, aluminum, and laminate materials impact overall production costs. Many manufacturers face margin pressure due to rising input costs and transportation expenses. For instance, increases in crude oil prices directly affect plastic resin rates, leading to unstable supply chains. This volatility limits pricing flexibility and affects contract stability with cosmetic brands. As a result, companies must adopt efficient sourcing and cost-optimization strategies to remain competitive.
Regional Analysis
North America
North America holds a 32% share of the global cosmetic tube packaging market. Strong demand for skincare, haircare, and personal grooming products drives regional growth. Leading cosmetic brands in the U.S. and Canada increasingly adopt eco-friendly and premium tube designs to align with sustainability goals. The presence of advanced manufacturing infrastructure and major beauty companies supports product innovation. For instance, several top skincare brands use recyclable and mono-material tubes to meet regulatory standards. High disposable income and growing e-commerce penetration further strengthen market expansion across premium and mass-market segments.
Europe
Europe accounts for 28% of the global cosmetic tube packaging market. The region leads in sustainable packaging initiatives due to strict environmental regulations and consumer awareness. European cosmetic brands prioritize recyclable, bio-based, and paper-based tube solutions to meet regulatory targets. For instance, several companies have introduced compostable and lightweight tubes to reduce carbon emissions. Strong demand for natural skincare and personal care products boosts premium packaging adoption. The presence of established cosmetic clusters in France, Germany, and Italy drives continuous product innovation and regional market dominance.
Asia Pacific
Asia Pacific leads the global market with a 34% share, driven by rising beauty product consumption in China, Japan, South Korea, and India. Expanding middle-class populations and increasing urbanization boost demand for affordable yet high-quality packaging. Local and international brands use flexible squeeze and airless tubes to cater to skincare and makeup demand. For instance, several leading Asian brands have launched travel-friendly tubes designed for e-commerce and retail formats. Growing investment in sustainable and smart packaging technologies further accelerates market growth in this high-potential region.
Latin America
Latin America represents 4% of the global cosmetic tube packaging market. Countries like Brazil and Mexico are key contributors due to rising personal care and grooming trends. Regional brands increasingly adopt flexible tube formats to reduce costs and enhance product accessibility. For instance, several manufacturers produce low-cost squeeze tubes to target mass-market consumers. Urban lifestyle changes and the growing influence of international beauty trends support demand growth. Although price sensitivity remains a factor, increasing investments in local packaging facilities are improving market competitiveness in the region.
Middle East & Africa
The Middle East & Africa region holds a 2% share of the global cosmetic tube packaging market. The demand is supported by growing beauty and personal care product adoption, particularly in GCC countries and South Africa. Rising disposable income and the expansion of modern retail channels are creating opportunities for local packaging suppliers. For instance, several cosmetic companies are introducing premium tube formats for skincare products. Though the market is still developing, increasing interest from global cosmetic brands and sustainability initiatives is driving gradual growth in the region.
Market Segmentations:
By Product Type:
- Squeeze tubes
- Twist-up tubes
By Material Type:
- Plastic tubes
- Aluminum tubes
By Cap Type:
- Stand-up caps
- Nozzle caps
By Geography
- North America
- Europe
- Germany
- France
- U.K.
- Italy
- Spain
- Rest of Europe
- Asia Pacific
- China
- Japan
- India
- South Korea
- South-east Asia
- Rest of Asia Pacific
- Latin America
- Brazil
- Argentina
- Rest of Latin America
- Middle East & Africa
- GCC Countries
- South Africa
- Rest of the Middle East and Africa
Competitive Landscape
The competitive landscape of the cosmetic tube packaging market features key players such as Tubopress Italia Spa, CCL Industries Inc., Linhardt GmbH & Co KG, Albéa Beauty Holdings S.A, Berry Global Group, Inc., Intrapac International Corporation, Essel Propack Ltd, Montebello Packaging Inc., Hoffmann Neopac Ag, and Huhtamaki Oyj. The cosmetic tube packaging market is defined by strong innovation, sustainability initiatives, and strategic expansion. Companies are investing heavily in advanced packaging technologies to meet evolving consumer preferences for convenience and eco-friendly solutions. The market is witnessing a clear shift toward recyclable, bio-based, and lightweight tube formats to align with global sustainability goals. Manufacturers are also adopting high-quality printing, smart labeling, and customized designs to enhance brand visibility and consumer engagement. Strategic mergers, acquisitions, and capacity expansions strengthen global supply capabilities. Intense competition encourages continuous product development, driving higher standards in quality, functionality, and environmental compliance.
Shape Your Report to Specific Countries or Regions & Enjoy 30% Off!
Key Player Analysis
- Tubopress Italia Spa
- CCL Industries Inc.
- Linhardt GmbH & Co KG
- Albéa Beauty Holdings S.A
- Berry Global Group, Inc.
- Intrapac International Corporation
- Essel Propack Ltd
- Montebello Packaging Inc.
- Hoffmann Neopac Ag
- Huhtamaki Oyj
Recent Developments
- In June 2025, Tubex introduces two new models of its all-aluminum tubes. The company states the solution saves 70% of CO2 and 95% of production energy and is available in post-industrial and post-consumer recycled materials. It was developed for compact tubes, travel sizes, and sampling sizes.
- In November 2024, Ego Pharmaceuticals has started shifting the non-recyclable laminate packaging of its QV tube products to 100% recyclable low-density polyethylene (LDPE) packaging in honor of National Recycling Week. The move represents Ego’s objective of enhancing environmental sustainability and fulfilling its targets with the Australian Packaging Covenant Organization (APCO) and ANZPAC (Plastics Pact).
- In May 2024, Neopac showcased a number of new product launches and functional improvements. Neopac unveiled a new line of cosmetics tubes and some of its most recent developments in tube packaging at its exhibit stand. Additionally, the company introduced Polyfoil® Sensation, a brand-new product to its EcoDesign line.
- In March 2024, GEKA announced the launch of a pioneering recycled polypropylene (PP) material tailored for cosmetic packaging applications. This newly developed post-consumer-recycled (PCR) polypropylene (PP) is to comply with stringent formulation requirements for crucial cosmetic packaging.
Report Coverage
The research report offers an in-depth analysis based on Product Type, Material Type, Cap Type and Geography. It details leading market players, providing an overview of their business, product offerings, investments, revenue streams, and key applications. Additionally, the report includes insights into the competitive environment, SWOT analysis, current market trends, as well as the primary drivers and constraints. Furthermore, it discusses various factors that have driven market expansion in recent years. The report also explores market dynamics, regulatory scenarios, and technological advancements that are shaping the industry. It assesses the impact of external factors and global economic changes on market growth. Lastly, it provides strategic recommendations for new entrants and established companies to navigate the complexities of the market.
Future Outlook
- The market will see strong adoption of recyclable and bio-based tube materials.
- Digital printing will become a key tool for faster customization and branding.
- Premium and airless tube formats will gain more traction in skincare and cosmetics.
- Manufacturers will invest in lightweight designs to reduce transport and production costs.
- Smart packaging with QR codes and interactive labels will enhance consumer engagement.
- Sustainability regulations will shape material choices and design strategies.
- E-commerce expansion will drive demand for durable and compact tube packaging.
- Regional manufacturing facilities will grow to support faster supply chain delivery.
- Strategic collaborations between packaging firms and cosmetic brands will increase.
- Innovation in barrier technology will improve product protection and shelf life.



