Biofertilizers Market Overview:
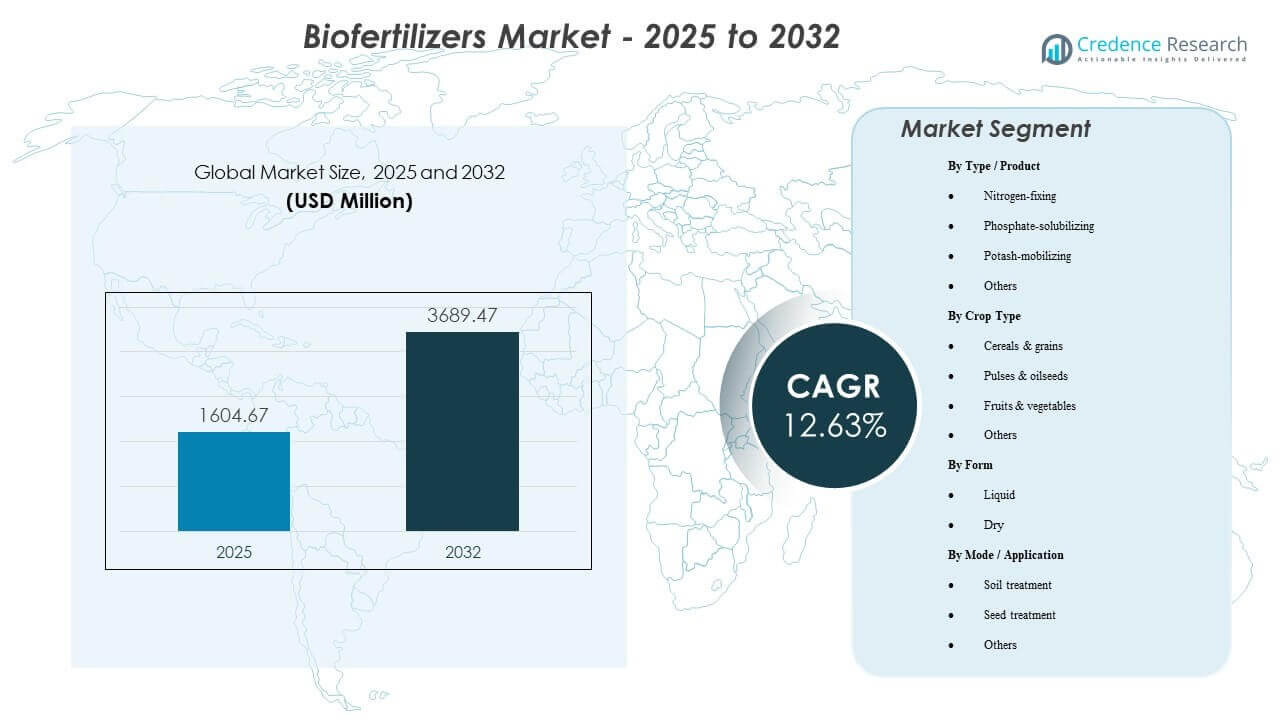
The global Biofertilizers market size was estimated at USD 1604.67 million in 2025 and is expected to reach USD 3689.47 million by 2032, growing at a CAGR of 12.63% from 2025 to 2032. Growth is primarily supported by rising demand for sustainable nutrient management practices that improve soil biological activity and nutrient-use efficiency across major crop systems. Expansion is additionally supported by wider product availability across key agricultural regions and increasing integration of biological inputs into standard crop nutrition programs.
| REPORT ATTRIBUTE |
DETAILS |
| Historical Period |
2020-2023 |
| Base Year |
2024 |
| Forecast Period |
2025-2032 |
| Biofertilizers Market Size 2025 |
USD 1604.67 million |
| Biofertilizers Market, CAGR |
12.63% |
| Biofertilizers Market Size 2032 |
USD 3689.47 million |
Key Market Trends & Insights
- The Biofertilizers Market is projected to expand at a CAGR of 63% during 2025–2032.
- Asia Pacific accounted for 41% revenue share in 2025, supported by large cultivated areas and intensive input usage.
- North America represented 18% share in 2025, reflecting mature distribution and higher adoption of biological inputs in integrated programs.
- Nitrogen-fixing products accounted for the largest share of 2% in 2025, supported by strong alignment with yield and nutrient-efficiency priorities.
- Dry biofertilizers accounted for 5% share in 2025, reflecting shelf-life and handling advantages across distribution chains.
Segment Analysis
The Biofertilizers Market is shaped by demand for biological nutrient solutions that fit existing farm workflows and deliver measurable outcomes on nutrient efficiency, crop vigor, and soil conditioning. Product selection is strongly influenced by field compatibility, storage stability, and ease of application through seed or soil routes. Adoption improves when formulations demonstrate repeatable performance across variable soil conditions, irrigation practices, and climate zones. Commercial-scale farms typically favor products that reduce operational complexity, whereas smallholder systems prioritize affordability and clarity of usage instructions.
Access crucial information at unmatched prices!
Request your sample report today & start making informed decisions powered by Credence Research Inc.!
Download Sample
Segment performance is also influenced by channel strength and agronomy support. Wider dealer coverage, training programs, and demonstration trials increase conversion from trial to repeat purchase. Portfolio expansion toward multi-strain and crop-specific formulations supports better positioning across cereals & grains, pulses & oilseeds, and horticulture systems. Market growth is further supported by increasing integration of biological inputs into nutrient management programs rather than one-time seasonal trials.
By Type / Product Insights
Nitrogen-fixing accounted for the largest share of 44.2% in 2025. Leadership is supported by strong relevance across staple crops where nitrogen availability and fertilizer efficiency are central to farm economics. Nitrogen-fixing solutions also benefit from broad compatibility with seed treatment and soil treatment routes, enabling flexible deployment across mechanized and smallholder systems. Improving formulation stability and multi-strain offerings further support consistent outcomes and repeat usage.
By Crop Type Insights
Biofertilizer adoption across cereals & grains, pulses & oilseeds, and fruits & vegetables is influenced by the balance between application economics and performance consistency. Cereals & grains typically support larger volume demand due to acreage scale and standardized agronomy practices. Fruits & vegetables often support higher willingness to pay where quality outcomes and soil conditioning are priority decision factors. Adoption growth across crop categories remains closely tied to agronomic advisory availability and clear product-use protocols.
By Form Insights
Dry accounted for the largest share of 54.5% in 2025. Demand is supported by easier storage and transport, which improves distributor reach and reduces product degradation risk across handling conditions. Longer shelf-life performance supports retailer confidence and reduces perceived risk for growers during seasonal procurement cycles. Operational fit with common seed treatment and application practices also supports scalable usage across multiple crop systems.
By Mode / Application Insights
Application choice is driven by farm workflow fit, crop system requirements, and targeted agronomic outcomes. Seed treatment is often preferred where precision placement, low-dose usage, and planting-time convenience are priorities. Soil treatment remains important where growers target rhizosphere conditioning and longer-run soil biological improvement. Selection between the two approaches commonly depends on soil baseline, irrigation practices, and available application infrastructure.
Market Drivers
Expansion of sustainable nutrient management practices
Sustainable farming practices increasingly prioritize improvements in soil biological activity and nutrient-use efficiency, supporting biofertilizer adoption. Biofertilizers are positioned as complementary tools within integrated nutrient programs, particularly when growers aim to reduce synthetic intensity without sacrificing productivity. Demand rises when products demonstrate measurable impact on nutrient uptake and crop vigor across key crop systems. Broader awareness of soil health benefits further supports usage beyond one-time trials.
Cost pressure and efficiency focus in conventional fertilizer programs
Input cost volatility and margin pressure encourage growers to seek solutions that improve fertilizer efficiency and reduce wastage. Biofertilizers are increasingly evaluated for nutrient mobilization and root-zone performance benefits that support better utilization of applied nutrients. Adoption accelerates when products integrate smoothly with existing fertilization schedules and do not add operational complexity. Performance visibility through on-farm comparisons supports conversion to repeat purchasing.
- For instance, Pivot Bio’s PROVEN® 40 in-plant nitrogen study reports that 94.6% of field visits where 5–40 lbs./ac of synthetic nitrogen was replaced with PROVEN® 40 showed increased plant nitrogen levels versus the grower standard nitrogen practice, and it also reports an estimated 10% increase in pounds of nitrogen per acre during R1–R4 growth stages for PROVEN® 40-treated plants.
Improved formulation stability and product availability
Formulation improvements increase shelf stability and reduce performance variability across storage and distribution environments. Dry products in particular support wider geographic reach due to easier logistics and lower cold-chain dependency. Product consistency strengthens trust across dealer networks and improves grower confidence in outcomes. Wider portfolio availability across crop types and application modes further strengthens market penetration.
- For instance, Lallemand’s LALFIX® SPHERICAL LENTIL, PEA & BEAN GR is specified as a dual-strain in-furrow spherical inoculant with 7.5 × 10⁷ CFU per gram, reflecting a defined, quantified live-microbial loading that supports more consistent dosing in distribution and field application.
Strengthening agronomy support and channel enablement
Dealer education, demonstration trials, and technical guidance materially improve correct usage and perceived efficacy. Better application protocols reduce under-dosing, mis-timing, and compatibility issues with other inputs, supporting stronger field performance. Channel partnerships also enable broader distribution coverage, especially in high-volume agricultural regions. Enhanced technical support increases repeat purchase likelihood and supports adoption across additional crop categories.
Market Challenges
Product performance variability across soil types, climatic conditions, and farming practices remains a major challenge for market scaling. Biofertilizer outcomes can depend heavily on correct application timing, handling, and compatibility with other inputs, creating inconsistency when agronomy support is limited. Quality variation across suppliers can also affect trust and lead to slower repeat adoption in price-sensitive segments. Standardization and stronger field validation remain important to reduce perceived risk for growers.
- For instance, Novozymes’ TagTeam® Soybean Granular Inoculant discloses a “minimum guarantee” of 1.0 × 10^8 viable CFU/g Bradyrhizobium japonicum and 1.0 × 10^5 CFU/g Penicillium bilaiae—an example of supplier-side specification and labeling discipline that can help reduce perceived quality ambiguity at the farmgate
Distribution and storage constraints also influence adoption, especially in regions with fragmented dealer networks. Inconsistent handling conditions can reduce biological viability, which impacts farmer satisfaction and increases churn risk. Limited awareness and insufficient technical training can delay conversion from trial usage to programmatic adoption. Pricing sensitivity in emerging markets can further constrain uptake when short-term yield response is not clearly demonstrated.
Market Trends and Opportunities
Integration of biofertilizers into broader biological inputs programs is increasing, with growing interest in multi-strain and crop-specific formulations. Product positioning is shifting toward measurable nutrient-use efficiency and soil conditioning outcomes rather than standalone replacement narratives. Demand is also expanding across high-value horticulture systems where residue preferences and soil conditioning priorities are stronger. Partnerships across input providers and channels create opportunities for bundled nutrition programs that improve ease of adoption.
Expansion opportunities are also supported by increasing focus on regenerative agriculture and soil health metrics across supply chains. Wider adoption in cereals & grains can materially increase volume demand due to acreage scale. Growth is likely to accelerate where agronomy enablement improves correct application and where distribution coverage expands into underpenetrated farming regions. Product innovation that improves stability under varied storage conditions can further unlock adoption in rural and remote markets.
- For instance, BASF states its Vault IP Plus seed treatment delivers up to 60 days of on-seed survival, and its safety data sheet lists storage stability of 24 months when stored at 2–8 °C—attributes that directly address viability and logistics constraints.
Regional Insights
North America
North America accounted for 35.18% revenue share in 2025, supported by mature distribution ecosystems and higher adoption of integrated crop nutrition programs. Demand benefits from stronger product standardization, clearer use protocols, and broader agronomy advisory availability. Row-crop systems support consistent usage patterns where nutrient-use efficiency is a key purchasing driver. Market expansion is reinforced by increased focus on soil health outcomes and sustainability-aligned input programs.
Europe
Europe held 14.86% share in 2025, supported by stronger emphasis on sustainable farming practices and biological input adoption across multiple crop systems. Demand is strengthened by established channels and higher acceptance of biological solutions in soil conditioning and nutrient management practices. Adoption is supported by farm practices that prioritize reduced chemical intensity and improved long-run soil performance. Product differentiation often focuses on reliability, compatibility with existing agronomy, and demonstrated field outcomes.
Asia Pacific
Asia Pacific represented 40.41% share in 2025, reflecting large cultivated areas, high cropping intensity, and increasing emphasis on soil fertility improvement. Demand is supported by strong use across cereals & grains and expanding adoption in horticulture segments. Wider product availability and stronger awareness of biological solutions support market penetration across both commercial farms and smallholder systems. Market growth benefits from ongoing efforts to improve nutrient-use efficiency and maintain soil productivity.
Latin America
Latin America accounted for 5.92% share in 2025, supported by adoption in large-scale commercial agriculture and increasing use of biological inputs in integrated crop management programs. Demand is influenced by the scale of row-crop cultivation and the need to improve nutrient efficiency and soil resilience. Adoption remains uneven across countries due to variability in distribution reach and agronomy support depth. Market expansion is expected to improve as dealer coverage and technical support capabilities strengthen.
Middle East & Africa
Middle East & Africa held 3.63% share in 2025, reflecting an emerging adoption base influenced by soil quality challenges and the need for improved nutrient efficiency in water-constrained systems. Usage growth is supported by gradual expansion of distribution and increasing awareness of biological solutions in selected crop systems. Adoption is more visible in high-value crops and controlled-environment agriculture where soil conditioning and input optimization are priorities. Constraints include affordability, fragmented access to technical guidance, and uneven product availability.
Competitive Landscape
Competition in the Biofertilizers Market is shaped by microbial strain portfolios, formulation stability, and demonstrated field performance across diverse agronomic conditions. Suppliers increasingly differentiate through crop-specific positioning, compatibility with existing nutrient programs, and technical advisory support delivered through dealer networks. Channel partnerships and broader biological input portfolios strengthen go-to-market reach and improve adoption consistency. Competitive intensity increases as suppliers expand across multiple regions and invest in product stability and efficacy validation to support repeat purchasing.
Novozymes A/S plays a significant role through microbial and biological solutions capabilities that support product development and scalability across agricultural applications. Market positioning for Novozymes A/S typically emphasizes technical depth, formulation know-how, and collaboration with channel partners to strengthen commercialization. Portfolio breadth enables alignment with multiple crop systems and application modes, supporting wider market access. Continued emphasis on product reliability and agronomy enablement supports adoption in farm programs that prioritize consistent outcomes.
The industry research and growth report includes detailed analyses of the competitive landscape of the market and information about key companies, including:
- Novozymes A/S
- Symborg S.L.
- Hansen Holding A/S
- Syngenta
- UPL (UPL Limited)
- Rizobacter Argentina S.A.
- Lallemand Inc.
- Bioceres S.A.
- Agrinos Inc.
- CBF China Bio-Fertilizer AG
- Kiwa Bio-Tech Products Group Corporation
- Gujarat State Fertilizers & Chemicals Ltd. (GSFC)
- Rashtriya Chemicals & Fertilizers Ltd. (RCF)
- IPL Biologicals (International Panaacea Limited)
Qualitative and quantitative analysis of companies has been conducted to help clients understand the wider business environment as well as the strengths and weaknesses of key industry players. Data is qualitatively analyzed to categorize companies as pure play, category-focused, industry-focused, and diversified; it is quantitatively analyzed to categorize companies as dominant, leading, strong, tentative, and weak.
Shape Your Report to Specific Countries or Regions & Enjoy 30% Off!
Recent Developments
- In January 2026, company Bioprime AgriSolutions Pvt Ltd reported it had begun exporting its biofertilizer and biocontrol products to the US and Southeast Asia and said it had formed partnerships to start operations in multiple Southeast Asian countries. In the same report, Bioprime also stated it partnered with Israel Chemicals Limited (ICL) to help distribute its phosphate-solubilizing bacteria product across India
- In July 2025, company Koppert introduced “Veni Calcium” as a biofertilizer formulated for foliar application, positioned to help prevent and correct calcium deficiency in crops. The launch was reported from New Delhi as part of Koppert’s biologicals-focused portfolio messaging.
- In July 2025, company BioConsortia, Inc. announced it raised $15 million to accelerate the launch of its next-generation nitrogen-fixing biofertilizer product “Always-N” and support global expansion plans. The company framed Always-N as a microbial (including gene-edited) technology intended to improve sustainability in corn production.
- In January 2025, company Super Crop Safe Ltd. announced the launch of its bio-fertilizer product “Super Gold WP+” in New Delhi, positioning it as a microbial/mycorrhiza-based solution aimed at reducing chemical fertilizer use while improving crop productivity. In the same announcement, the company said it planned to roll out the product range across multiple Indian states as part of its market expansion.
Report Scope
| Report Attribute |
Details |
| Market size value in 2025 |
USD 1604.67 million |
| Revenue forecast in 2032 |
USD 3689.47 million |
| Growth rate (CAGR) |
12.63% |
| Base year |
2025 |
| Forecast period |
2026-2032 |
| Quantitative units |
USD million |
| Segments covered |
By Type / Product Outlook: Nitrogen-fixing, Phosphate-solubilizing, Potash-mobilizing, Others; By Crop Type Outlook: Cereals & grains, Pulses & oilseeds, Fruits & vegetables, Others; By Form Outlook: Liquid, Dry; By Mode / Application Outlook: Soil treatment, Seed treatment, Others |
| Regional scope |
North America, Europe, Asia Pacific, Latin America, Middle East & Africa |
| Key companies profiled |
Novozymes A/S, Symborg S.L., Chr. Hansen Holding A/S, Syngenta, UPL (UPL Limited), Rizobacter Argentina S.A., Lallemand Inc., Bioceres S.A., Agrinos Inc., CBF China Bio-Fertilizer AG, Kiwa Bio-Tech Products Group Corporation, Gujarat State Fertilizers & Chemicals Ltd. (GSFC), Rashtriya Chemicals & Fertilizers Ltd. (RCF), IPL Biologicals (International Panaacea Limited) |
| No. of Pages |
338 |
Segmentation
BY TYPE / PRODUCT
- Nitrogen-fixing
- Phosphate-solubilizing
- Potash-mobilizing
- Others
BY CROP TYPE
- Cereals & grains
- Pulses & oilseeds
- Fruits & vegetables
- Others
BY FORM
BY MODE / APPLICATION
- Soil treatment
- Seed treatment
- Others
BY REGION
- North America
- Europe
- Germany
- France
- U.K.
- Italy
- Spain
- Rest of Europe
- Asia Pacific
- China
- Japan
- India
- South Korea
- South-east Asia
- Rest of Asia Pacific
- Latin America
- Brazil
- Argentina
- Rest of Latin America
- Middle East & Africa
- GCC Countries
- South Africa
- Rest of the Middle East and Africa


