
Azotobacter-Based Biofertilizer Market Overview:
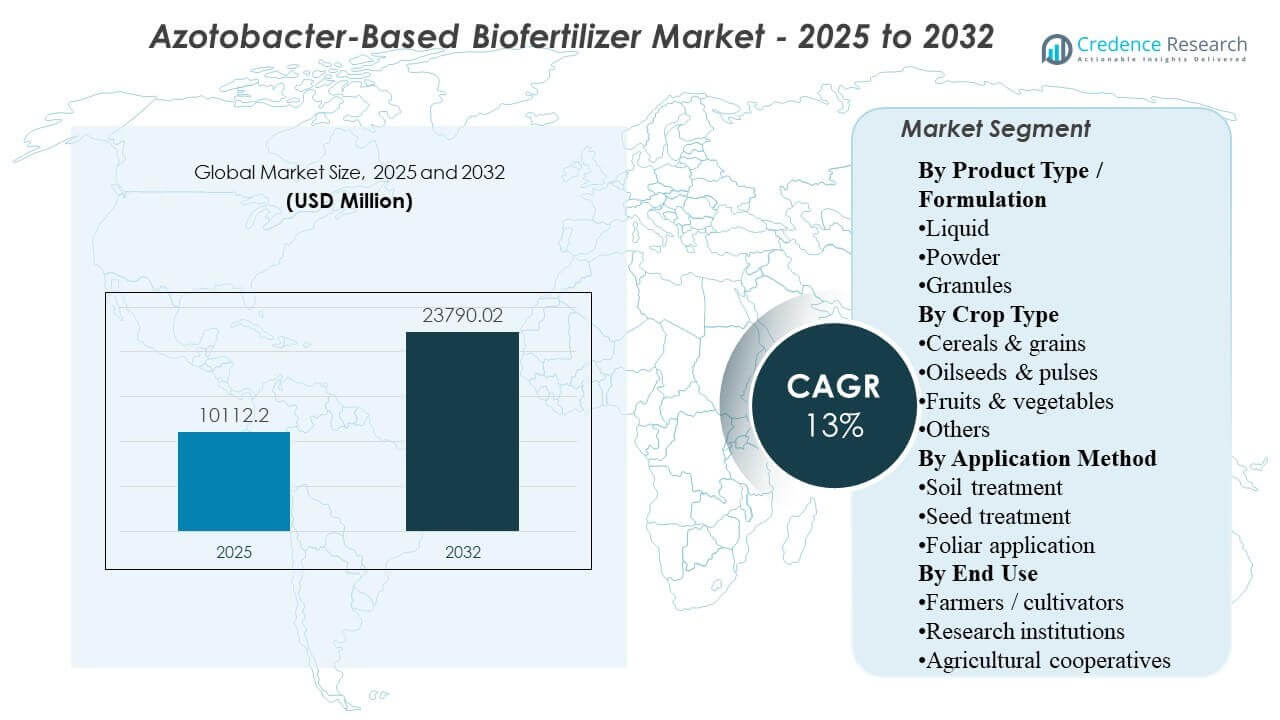
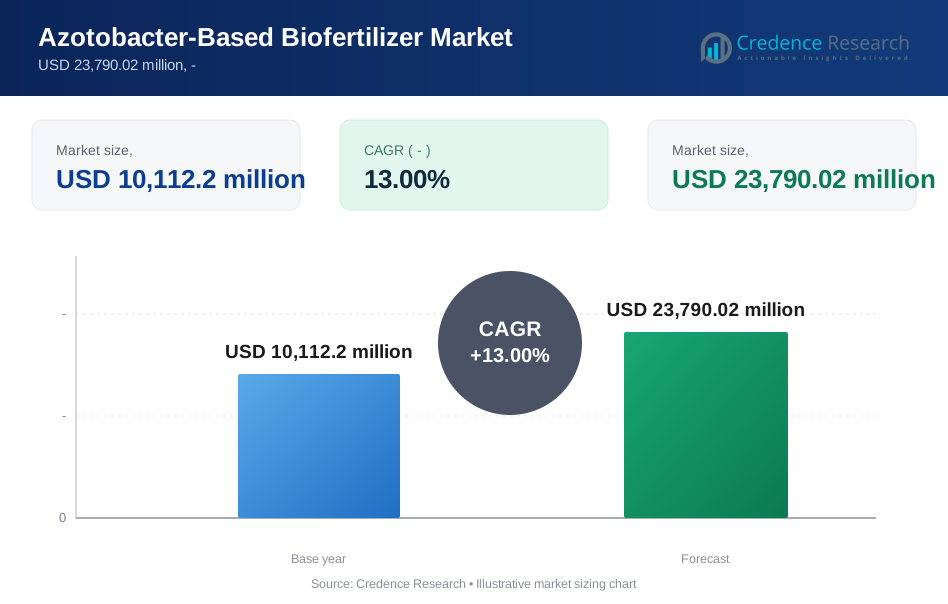
The global Azotobacter-Based Biofertilizer Market size was estimated at USD 10,112.2 million in 2025 and is expected to reach USD 23,790.02 million by 2032, growing at a CAGR of 13% from 2025 to 2032. Growth is primarily supported by increasing adoption of microbial nitrogen-fixation solutions as growers and cooperatives pursue higher nutrient-use efficiency, improved soil biology, and partial substitution of synthetic nitrogen inputs. Expanding availability of liquid and carrier-based products through organized agri-input channels and advisory-led programs is strengthening product penetration across both staple and horticultural crop systems.
| REPORT ATTRIBUTE | DETAILS |
|---|---|
| Historical Period | 2020-2023 |
| Base Year | 2024 |
| Forecast Period | 2025-2032 |
| Azotobacter-Based Biofertilizer Market Size 2025 | USD 10,112.2 million |
| Azotobacter-Based Biofertilizer Market, CAGR | 13% |
| Azotobacter-Based Biofertilizer Market Size 2032 | USD 23,790.02 million |
Key Market Trends & Insights
- The market is projected to expand at a 13% CAGR from 2025–2032, supported by rising demand for biological nutrient solutions across commercial agriculture.
- Liquid formulations accounted for the largest share at 55.6%, driven by dosing convenience, application flexibility, and broader retail preference.
- Cereals & grains represented 43.9% of demand, supported by high acreage and repeatable use across staple crop nutrient programs.
- Soil treatment held a 52.2% share, reflecting grower preference for baseline application aligned with routine soil nutrition practices.
- Farmers / cultivators accounted for 66.8% of total consumption, indicating that direct on-farm adoption remains the primary revenue driver.
Segment Analysis
Formulation performance and ease-of-use strongly influence purchase decisions in Azotobacter-based biofertilizers. Liquid products continue to gain traction due to simpler handling, faster mixing, and better alignment with existing spray and fertigation routines. Carrier-based formats such as powder and granules remain important for regions where distribution, storage, and on-farm handling conditions favor more stable physical forms. Buyers increasingly assess products based on field response consistency, recommended dose rates, and compatibility with integrated nutrient management programs.
Crop demand is led by broad-acre systems where nitrogen efficiency is continuously optimized across seasons. Cereals and grains form the largest demand pool due to scale and repeat usage, while oilseeds and pulses benefit from soil health priorities and crop rotation patterns that encourage biological soil amendments. Fruits and vegetables show strong adoption where growers prioritize yield quality, root vigor, and soil microbiome improvement, often supported by advisory-driven recommendations. Across application routes, soil and seed-based usage remains dominant because these methods better support rhizosphere establishment and persistence compared to purely foliar approaches.
By Product Type / Formulation Insights
Liquid accounted for the largest share at 55.6%. Wider adoption is supported by ease of dilution and uniform application across large areas using existing farm equipment. Product availability across organized agri-input retail and cooperative distribution increases repeat purchase potential for liquid SKUs. Improvements in formulation stability and shelf-life also strengthen buyer confidence and reduce perceived performance variability.
By Crop Type Insights
Cereals & grains accounted for the largest share at 43.9%. Large cultivated acreage and staple-crop production intensity sustain consistent demand for nitrogen-support solutions that complement chemical fertilizers. Growers also tend to standardize inputs for cereals, which supports repeatable adoption when field outcomes meet expectations. Extension and cooperative-led guidance further reinforces usage in high-volume cereal belts.
By Application Method Insights
Soil treatment accounted for the largest share at 52.2%. Soil application fits naturally into basal nutrient practices and is frequently bundled with organic amendments and soil conditioners. Growers view soil-route inoculation as improving rhizosphere establishment and persistence compared to other routes. Dealer recommendations also commonly position soil treatment as the default approach for broad-acre adoption.
By End Use Insights
Farmers / cultivators accounted for the largest share at 66.8%. The purchasing decision is primarily driven by yield response expectations, input-cost optimization, and soil health improvement goals. Increasing product access through local agri-dealer networks and cooperatives supports direct procurement by farmers. Demonstration trials and advisory programs further encourage adoption and repeat buying cycles.
Azotobacter-Based Biofertilizer Market Drivers
Rising focus on nitrogen-use efficiency and sustainable nutrient management
Growers are increasingly prioritizing nutrient-use efficiency due to rising fertilizer costs, tightening sustainability expectations, and the need to protect soil productivity over multiple seasons. Azotobacter-based solutions are positioned as biological inputs that support nitrogen fixation and improve nutrient availability in the rhizosphere. Adoption is also supported by integrated nutrient management strategies that blend biologicals with reduced synthetic fertilizer dosage rather than full replacement. This positioning increases addressable demand across both conventional and transitioning-to-sustainable farms.
- For instance, a field study on hybrid maize showed that Azotobacter inoculation combined with 60 kg N from urea achieved grain yields above 3 t/ha, comparable to 120 kg N from urea, effectively halving mineral N input without reducing yield.
Expansion of biological input distribution through cooperatives and organized retail
Cooperatives and organized distribution channels increase product visibility, expand availability in rural markets, and support standardized application guidance. Stronger distribution reduces barriers linked to inconsistent supply, limited product knowledge, and unclear usage protocols. As these channels scale, they also improve after-sales agronomy support, which can reduce trial failure risk. Wider distribution directly improves conversion from trial to repeat purchases.
- For instance, Indian Farmers Fertiliser Cooperative Ltd. (IFFCO) now distributes fertilizers and allied inputs through more than 39,800 cooperative societies across India, illustrating how cooperative networks can deliver biofertilizers at scale into remote rural markets.
Increasing adoption in commercial farming and horticulture driven by yield-quality priorities
Commercial growers evaluate biofertilizers not only on yield impact but also on root health, plant vigor, and crop quality parameters. Horticulture systems, in particular, adopt bioinputs where soil biology and nutrient uptake are key to quality outcomes and stress resilience. Azotobacter-based products align well with programs aimed at improving soil structure and microbial activity, which strengthens the value proposition in high-value crops. This demand pool expands addressable market beyond staple crops and supports premiumization in certain channels.
Product innovation focused on formulation stability and field-performance consistency
Buyers often cite inconsistent field results as a key hurdle for microbial inputs, which drives suppliers to improve formulation stability and microbial viability through better carriers, stabilizers, and packaging. Improved performance consistency reduces buyer uncertainty and increases repeat adoption. Innovation also supports compatibility with broader farm input programs, including micronutrients and soil conditioners. Over time, better formulations strengthen market credibility and widen adoption across diverse climates and soil conditions.
Azotobacter-Based Biofertilizer Market Challenges
Performance variability across soil types, climates, and farm practices remains a central challenge for Azotobacter-based products. Microbial viability and establishment can be affected by storage conditions, heat exposure, soil moisture, pH levels, and chemical residue in the field. This variability increases the need for advisory support and can limit repeat purchases when results are not visible in early trials. In addition, product differentiation can be difficult for buyers when labeling, strain claims, and application guidance appear similar across brands.
- For instance, Novozymes’ BioAg best practice data report a bag contamination rate below 0.1% and a labeled active ingredient density of approximately 10 billion viable cfu/ml for TagTeam LCO XC, illustrating how tightly controlled formulation and packaging are needed to maintain viability from plant to field.
Market development is also constrained by limited standardization in product quality and efficacy validation across many geographies. Inconsistent quality across suppliers can reduce trust and slow category growth, particularly among larger commercial farms that require predictable outcomes. Distribution constraints in remote rural areas, combined with limited training, can lead to improper application and weaker outcomes. Competitive pressure from chemical fertilizers and blended nutrient products also requires biofertilizer suppliers to strengthen field evidence and farmer education.
Azotobacter-Based Biofertilizer Market Trends and Opportunities
Formulation upgrades and user-friendly packaging are emerging as strong growth levers, especially for liquid products that require better shelf stability under varied storage conditions. Suppliers are increasingly investing in practical dosing formats and clearer application protocols to reduce adoption friction. This trend supports stronger conversion from first-time trials to repeat purchases and improves channel confidence for dealers and cooperatives. As product experience improves, the market can expand deeper into broad-acre segments.
- For instance, Azotobacter liquid biofertilizers are now commonly supplied with calibrated seed-treatment and fertigation guidelines such as 4–5 ml per kg of seed or 500–1,000 ml per acre through drip irrigation, which standardizes use across crops and improves dose accuracy for first-time users.
Opportunities are also rising in advisory-led selling, where agronomy programs position Azotobacter as part of integrated soil and nutrient solutions. Bundled offerings with complementary biologicals and soil-health products can increase wallet share per acre and strengthen stickiness. Growth in export-oriented horticulture and higher-value crop production also creates space for premium biological programs. Expansion into underpenetrated regions through cooperative partnerships and localized field trials remains a key commercialization opportunity.
Regional Insights
North America
North America is supported by increasing adoption of biological inputs across row crops and horticulture, especially where nutrient efficiency and soil biology are prioritized. The region benefits from organized distribution and farm advisory networks that improve correct application and repeat purchase likelihood. North America accounted for 19.41% of market revenue, reflecting steady uptake across large commercial farms and specialty crop growers.
Europe
Europe is shaped by sustainability-linked farming practices, strong interest in soil health programs, and rising emphasis on biological alternatives within nutrient strategies. Growers evaluate biofertilizers as complements to mineral fertilizers to improve nutrient efficiency and maintain soil productivity. Europe represented 15.58% of revenue, supported by structured adoption channels and regulatory-driven sustainability goals.
Asia Pacific
Asia Pacific benefits from large agricultural activity, extensive acreage under cereals and grains, and broad use of nutrient solutions through dealer and cooperative networks. Adoption is also supported by rising awareness of soil health and productivity improvement programs. Asia Pacific accounted for 43.62% of market revenue, remaining the largest regional demand center.
Latin America
Latin America is supported by large-scale commercial agriculture, high focus on soil productivity, and strong acceptance of biological inputs in certain crop systems. Market expansion is encouraged by demand for cost-effective yield support and soil restoration practices in intensive farming areas. Latin America held 12.97% of revenue, supported by continued penetration in high-acreage farming regions.
Middle East & Africa
Middle East & Africa is driven by increasing interest in soil restoration, sustainable nutrient management, and improving productivity in resource-constrained farming environments. Distribution depth and training gaps can still limit adoption, but targeted programs and dealer expansion support growth. Middle East & Africa contributed 8.42% of revenue, with gradual expansion in commercially focused agricultural zones.
Competitive Landscape
Competition in the Azotobacter-Based Biofertilizer Market is shaped by formulation differentiation, distribution reach, advisory capability, and field-performance credibility. Companies compete on strain viability, shelf stability, ease of application, and compatibility with integrated nutrient programs. Strong dealer and cooperative networks remain critical for driving adoption at scale, particularly in broad-acre crops. Product education, demonstration trials, and localized agronomy support are also key to improving repeat purchase behavior.
Gujarat State Fertilizers & Chemicals Ltd. (GSFC) typically competes through scale, portfolio breadth, and established channel access in agricultural inputs. Stronger distribution capability supports consistent product availability and wider farmer outreach through organized networks. The company’s approach is reinforced by relationships with institutional buyers and channel partners that can accelerate adoption. Portfolio positioning alongside broader nutrient offerings can support cross-selling into integrated nutrient management programs.
The industry research and growth report includes detailed analyses of the competitive landscape of the market and information about key companies, including:
- Gujarat State Fertilizers & Chemicals Ltd. (GSFC)
- Indian Farmers Fertiliser Cooperative Limited (IFFCO)
- National Fertilizers Limited (NFL)
- Rashtriya Chemicals and Fertilizers Ltd. (RCF)
- Madras Fertilizers Ltd.
- IPL Biologicals Limited
- T. Stanes and Company Limited
- Unisun Agro Pvt. Ltd.
- Green Vision Life Sciences Pvt. Ltd.
- PHMS Technocare Pvt. Ltd.
- SOM Phytopharma India Ltd.
- Peptech Biosciences Ltd.
- Novozymes
- Lallemand Inc.
- Rizobacter Argentina S.A.
Qualitative and quantitative analysis of companies has been conducted to help clients understand the wider business environment as well as the strengths and weaknesses of key industry players. Data is qualitatively analyzed to categorize companies as pure play, category-focused, industry-focused, and diversified; it is quantitatively analyzed to categorize companies as dominant, leading, strong, tentative, and weak.
Recent Developments
- In July 2025, IPL Biologicals leadership discussed plans to invest in a bio-fertilizer and bio-pesticide production facility in Gujarat, supporting supply expansion and faster scaling of microbial input availability.
- In May 2025, Indian Farmers Fertiliser Cooperative Limited (IFFCO) reported FY 2024–25 performance and highlighted expanding activity in innovation-led nutrient solutions, reinforcing scale and channel influence relevant to biological adoption pathways.
- In September 2024, Lallemand inaugurated new R&D laboratories in France, expanding laboratory capacity to support development and validation of microorganism-based solutions.
Report Scope
| Report Attribute | Details |
| Market size value in 2025 | USD 10112.2 million |
| Revenue forecast in 2032 | USD 23790.02 million |
| Growth rate (CAGR) | 13% (2025–2032) |
| Base year | 2025 |
| Forecast period | 2026-2032 |
| Quantitative units | USD million |
| Segments covered | By Product Type / Formulation Outlook: Liquid, powder, granules; By Crop Type Outlook: Cereals & grains, Oilseeds & pulses, Fruits & vegetables, Others; By Application Method Outlook: Soil treatment, Seed treatment, Foliar application; By End Use Outlook: Farmers / cultivators, Research institutions, Agricultural cooperatives |
| Regional scope | North America, Europe, Asia Pacific, Latin America, Middle East & Africa |
| Key companies profiled | Gujarat State Fertilizers & Chemicals Ltd. (GSFC), Indian Farmers Fertiliser Cooperative Limited (IFFCO), National Fertilizers Limited (NFL), Rashtriya Chemicals and Fertilizers Ltd. (RCF), Madras Fertilizers Ltd., IPL Biologicals Limited, T. Stanes and Company Limited, Unisun Agro Pvt. Ltd., Green Vision Life Sciences Pvt. Ltd., PHMS Technocare Pvt. Ltd., SOM Phytopharma India Ltd., Peptech Biosciences Ltd., Novozymes, Lallemand Inc., Rizobacter Argentina S.A. |
| No. of Pages | 336 |
Segmentation
BY PRODUCT TYPE / FORMULATION
- Liquid
- powder
- granules
BY CROP TYPE
- Cereals & grains
- Oilseeds & pulses
- Fruits & vegetables
- Others
BY APPLICATION METHOD
- Soil treatment
- Seed treatment
- Foliar application
BY END USE
- Farmers / cultivators
- Research institutions
- Agricultural cooperatives
BY REGION
- North America
- U.S.
- Canada
- Mexico
- Europe
- Germany
- France
- U.K.
- Italy
- Spain
- Rest of Europe
- Asia Pacific
- China
- Japan
- India
- South Korea
- South-east Asia
- Rest of Asia Pacific
- Latin America
- Brazil
- Argentina
- Rest of Latin America
- Middle East & Africa
- GCC Countries
- South Africa
- Rest of the Middle East and Africa
Request a Free Sample
Fill in your details and we'll send you a free sample report.
- Sample data tables & charts
- Research methodology
Need a Custom Version of This Report?
Tailor the scope, geography, or segments to your exact requirements.
- Custom geography or segment scope
- Direct access to our analyst team
Frequently Asked Questions
What is the market size of the Azotobacter-Based Biofertilizer Market?
What is the CAGR for the Azotobacter-Based Biofertilizer Market?
Which segment holds the largest share in the Azotobacter-Based Biofertilizer Market?
What are the key factors driving market growth?
Who are the leading companies in the Azotobacter-Based Biofertilizer Market?
Which region leads the Azotobacter-Based Biofertilizer Market?
Table of Content
Chapter 1. Report Introduction
- 1.1 Report Description & Purpose
- 1.1.1 Report Title & Market Definition
- 1.1.2 Unique Selling Propositions (USP) & Key Differentiators
- 1.1.3 Value Proposition for Stakeholders
- 1.2 Research Objectives
- 1.2.1 Market Sizing Objectives (Volume & Revenue)
- 1.2.2 Segmentation Objectives
- 1.2.3 Competitive Intelligence Objectives
- 1.2.4 Forecast & Scenario Objectives
- 1.3 Report Scope
- 1.3.1 Azotobacter-Based Biofertilizer Scope – Types & Subtypes Covered
- 1.3.2 Geographic Scope – Regions & Countries Covered
- 1.3.3 Historical Period, Base Year & Forecast Period (the historical period; forecast to the forecast period)
- 1.3.4 Inclusions & Exclusions
- 1.4 HS Code & Classification Framework
- 1.5 Currency, Units & Pricing Basis
- 1.6 Target Stakeholders
- 1.7 Limitations & Assumptions
Chapter 2. Executive Summary
- 2.1 Global Azotobacter-Based Biofertilizer Market Snapshot
- 2.1.1 Market Size – Historical (the historical period) & Forecast (the forecast period) (base year: USD 10,112.2 million → forecast year: USD 23,790.02 million)
- 2.1.2 Volume & Revenue – Global Totals
- 2.1.3 Key Market Highlights – Top Five Facts
- 2.2 Azotobacter-Based Biofertilizer Market Segmentation Snapshot
- 2.2.1 Market Split by Region – vs.
- 2.3 Competitive Snapshot
- 2.3.1 Top 10 Players by Revenue Share –
- 2.3.2 Top 10 Players by Volume Share –
- 2.3.3 Recent Strategic Developments (18-Month Summary)
- 2.4 Key Investment Highlights & Strategic Conclusions
Chapter 3. Azotobacter-Based Biofertilizer Market Dynamics & Industry Analysis
- 3.1 Market Overview & Context
- 3.1.1 Azotobacter-Based Biofertilizer Market Position in the Broader Automotive Value Chain
- 3.1.2 OEM vs. Replacement Market Dynamics
- 3.1.3 Market Maturity & Development Stage by Region
- 3.2 Azotobacter-Based Biofertilizer Market Drivers
- 3.3 Azotobacter-Based Biofertilizer Market Restraints & Challenges
- 3.4 Azotobacter-Based Biofertilizer Market Opportunities
- 3.5 Porter's Five Forces Analysis
- 3.5.1 Threat of New Entrants
- 3.5.2 Bargaining Power of Suppliers
- 3.5.3 Bargaining Power of Buyers
- 3.5.4 Threat of Substitutes
- 3.5.5 Competitive Rivalry – Intensity Assessment
- 3.6 Azotobacter-Based Biofertilizer Value Chain Analysis
- 3.6.1 Upstream – Raw Material/Input Suppliers
- 3.6.1.1 Raw Material/Input 1
- 3.6.1.2 Raw Material/Input 2
- 3.6.1.3 Raw Material/Input 3
- 3.6.2 Midstream – Production/Manufacturing/Service Delivery
- 3.6.2.1 Production/Process Overview
- 3.6.2.2 Key Facility Locations & Capacity by Manufacturer
- 3.6.3 Downstream – Distribution & End Consumer
- 3.6.3.1 Primary Channel – B2B/OEM
- 3.6.3.2 Secondary Channels – Dealer, Retail, Online, Direct
- 3.6.4 Value Chain Profitability Analysis
- 3.6.1 Upstream – Raw Material/Input Suppliers
- 3.7 PESTEL Analysis
- 3.7.1 Political Factors
- 3.7.2 Economic Factors
- 3.7.3 Social Factors
- 3.7.4 Technological Factors
- 3.7.5 Environmental Factors
- 3.7.6 Legal Factors
- 3.8 Azotobacter-Based Biofertilizer Supply Chain Analysis
- 3.8.1 Raw Material/Input Supply Risk Assessment
- 3.8.2 Manufacturing Concentration Risk (Geographic Exposure)
- 3.8.3 Trade Disruption Impact Analysis
- 3.9 Regulatory & Policy Landscape
Note: The regulatory and policy landscape section covers regulations based on their applicability to the market, Azotobacter-Based Biofertilizer category, geography, and scope of the study. Only regulatory frameworks with a material impact on operations, compliance, trade, sustainability, or market access are analyzed in detail.
Chapter 4. Key Investment Pockets & Opportunity Analysis
- 4.1 Azotobacter-Based Biofertilizer Market Attractiveness Analysis
- 4.1.1 By Region – Investment Attractiveness Matrix (Volume × CAGR)
- 4.2 Absolute Revenue Growth Opportunity
- 4.2.1 By Region – Absolute USD Growth Through the forecast period
- 4.3 Incremental Volume Opportunity
- 4.3.1 By Region – Incremental Volume Through the forecast period
- 4.3.2 Segment – Incremental Volume
- 4.4 Emerging Submarket Opportunity Deep Dive (Subject to Applicability)
- 4.5 Emerging Market Opportunity Scorecards
- 4.5.1 United States
- 4.5.2 Europe
- 4.5.3 Asia
- 4.5.4 Middle East & Africa
Note: Emerging Market Opportunity Scorecards will be included based on relevance and strategic importance. Regions listed are indicative and may vary depending on data availability and market dynamics.
Chapter 5. Azotobacter-Based Biofertilizer Import-Export Analysis & Trade Flows
- 5.1 Global Trade Overview
- 5.1.1 Global Export Value by Country (the historical period)
- 5.1.2 Global Export Volume by Country (the historical period)
- 5.1.3 Global Import Value by Country (the historical period)
- 5.1.4 Global Import Volume by Country (the historical period)
- 5.1.5 Net Trade Balance by Country (the historical period)
- 5.2 Export Analysis – Segment
- 5.2.1 Type 1 (HS Code)
- 5.2.2 Type 2 (HS Code)
- 5.2.3 Type 3 (HS Code)
- 5.2.4 Type 4 (HS Code)
- 5.2.5 Type 5 (HS Code)
- 5.3 Import Analysis – Segment
- 5.3.1 Type 1 (HS Code)
- 5.3.2 Type 2 (HS Code)
- 5.3.3 Type 3 (HS Code)
- 5.3.4 Type 4 (HS Code)
- 5.3.5 Type 5 (HS Code)
- 5.4 Average Unit Trade Prices
- 5.4.1 Average Export Price – Segment & Country
- 5.4.2 Average Import Price – Segment & Source Country
- 5.4.3 Price Trends (the historical period)
- 5.5 Key Trade Route Analysis
- 5.5.1 Trade Route 1
- 5.5.2 Trade Route 2
- 5.5.3 Trade Route 3
- 5.5.4 Trade Route 4
- 5.5.5 Trade Route 5
- 5.6 Trade Policy Impact Assessment
- 5.6.1 US Anti-Dumping & Section 301 Tariffs
- 5.6.2 EU Customs Union Impact
- 5.6.3 Major Free Trade Agreements
- 5.6.4 USMCA Rules of Origin
Note: Trade policy analysis will be included only where relevant to the Azotobacter-Based Biofertilizer market.
Chapter 6. Competitive Landscape & Company Benchmarking
- 6.1 Azotobacter-Based Biofertilizer Market Concentration & Structure
- 6.1.1 Herfindahl-Hirschman Index (HHI) – vs.
- 6.1.2 Tier 1, Tier 2 & Tier 3 Market Structure
- 6.1.3 Global, Regional & Local Player Dynamics
- 6.2 Azotobacter-Based Biofertilizer Market Share Analysis –
- 6.2.1 Global Revenue Share by Company
- 6.2.2 Global Volume Share by Company
- 6.2.3 Regional Revenue Share
- 6.2.4 Market Share Evolution ( vs. )
- 6.2.5 OEM Segment Share by Company
- 6.2.6 Replacement Segment Share by Company
- 6.3 Production/Delivery Capacity & Facility Analysis
- 6.3.1 Global Installed Capacity
- 6.3.2 Capacity Utilization Rates
- 6.3.3 Production/Output Volume
- 6.3.4 Facility Locations & Capacity Map
- 6.3.5 Planned Capacity Additions
- 6.4 Azotobacter-Based Biofertilizer Competitive Benchmarking Matrix
- 6.4.1 Revenue, Volume, CAGR & Profitability Comparison
- 6.4.2 Channel Revenue Mix
- 6.4.3 Geographic Revenue Exposure
- 6.4.4 R&D Intensity
- 6.4.5 Sustainability Maturity
- 6.5 Strategic Developments in Azotobacter-Based Biofertilizer (Last 24 Months)
- 6.5.1 Mergers, Acquisitions & Divestments
- 6.5.2 New Azotobacter-Based Biofertilizer Launches
- 6.5.3 Facility Expansions
- 6.5.4 Strategic Alliances, Joint Ventures & Partnerships
- 6.5.5 Distribution Expansion & Market Entry
- 6.5.6 Sustainability & ESG Initiatives
- 6.6 Competitive Strategy Mapping
- 6.6.1 Leader, Challenger, Follower & Niche Classification
- 6.6.2 Pricing Strategy Comparison
- 6.6.3 Channel Strategy Matrix
Note: Strategic developments are included based on their materiality and the availability of reliable information.
Chapter 7. Global Azotobacter-Based Biofertilizer Market – By Distribution Channel
- 7.1 Segment Overview
- 7.1.1 Volume & Revenue Split by Channel ( & )
- 7.1.2 Channel Mix Evolution (the forecast period)
Chapter 8. Regional Market Analysis – Global Overview
- 8.1 Global Regional Overview
- 8.1.1 Regional Volume Share
- 8.1.2 Regional Revenue Share
- 8.1.3 Regional Volume by Region
- 8.1.4 Regional Revenue by Region
- 8.1.5 Regional Forecast Through the forecast period
- 8.2 Cross-Regional Segment Analysis
- 8.2.1 By Distribution Channel
- 8.2.2 By Brand/Price Tier
Chapter 9. North America Azotobacter-Based Biofertilizer Market
- 9.1 United States
- 9.2 Canada
- 9.3 Mexico
Chapter 10. Europe Azotobacter-Based Biofertilizer Market
- 10.1 Germany
- 10.2 France
- 10.3 Italy
- 10.4 United Kingdom
- 10.5 Spain
- 10.6 Poland
- 10.7 Russia
- 10.8 Netherlands
- 10.9 Belgium
- 10.10 Sweden
- 10.11 Denmark
- 10.12 Norway
- 10.13 Rest of Europe
Chapter 11. Asia Pacific Azotobacter-Based Biofertilizer Market
- 11.1 China
- 11.2 India
- 11.3 Japan
- 11.4 South Korea
- 11.5 Thailand
- 11.6 Indonesia
- 11.7 Vietnam
- 11.8 Malaysia
- 11.9 Australia
- 11.10 Rest of Asia Pacific
Chapter 12. Latin America Azotobacter-Based Biofertilizer Market
- 12.1 Brazil
- 12.2 Argentina
- 12.3 Colombia
- 12.4 Chile
- 12.5 Rest of Latin America
Chapter 13. Middle East Azotobacter-Based Biofertilizer Market
- 13.1 Saudi Arabia
- 13.2 United Arab Emirates
- 13.3 Turkey
- 13.4 Israel
- 13.5 Iran
- 13.6 Rest of the Middle East
Chapter 14. Africa Azotobacter-Based Biofertilizer Market
- 14.1 South Africa
- 14.2 Egypt
- 14.3 Nigeria
- 14.4 Morocco
- 14.5 Rest of Africa
Chapter 15. Azotobacter-Based Biofertilizer Company Profiles
- 15.1 [Company 01]
- 15.1.1 Company Overview
- 15.1.2 Key Management Personnel
- 15.1.3 Products & Services Portfolio
- 15.1.4 Financial Performance
- 15.1.5 Key Market Focus & Geographic Presence
- 15.1.6 Recent Developments & Strategic Initiatives
Note: The company profile list is preliminary and may change based on research findings, market developments, data availability, and client requirements.
Chapter 16. Appendices
- Appendix A – List of Abbreviations & Acronyms
- Appendix B – Industry Classification Code Reference – Full Series
- Appendix C – Production & Capacity Data Tables
- Appendix D – End-Use & Demand Base Tables
- Appendix E – Consumption & Replacement Rate Assumptions
- Appendix F – ASP Reference Tables
- Appendix G – Manufacturing & Facility Database
- Appendix H – Import-Export Data Tables
- Appendix I – Regulatory Summary Tables
- Appendix J – Primary Research Participant List (Anonymized)
- Appendix K – Primary Research Questionnaire Framework
- Appendix L – Data Sources & Bibliography
- Appendix M – Market Size Divergence & Source Comparison
Chapter 17. Research Methodology
- 17.1 Research Framework & Philosophy
- 17.2 Secondary Research – Sources, Hierarchy & Data Extraction
- 17.3 Data Modeling – Bottom-Up & Top-Down Market Sizing
- 17.4 Primary Research – Stakeholder Framework, LOI & Sample Sizes
- 17.5 Forecast Methodology – Regression, Scenario & Sensitivity Analysis
- 17.6 Quality Control – Four-Layer Validation Framework
- 17.7 Limitations & Standard Assumptions
- 17.8 Disclaimer
