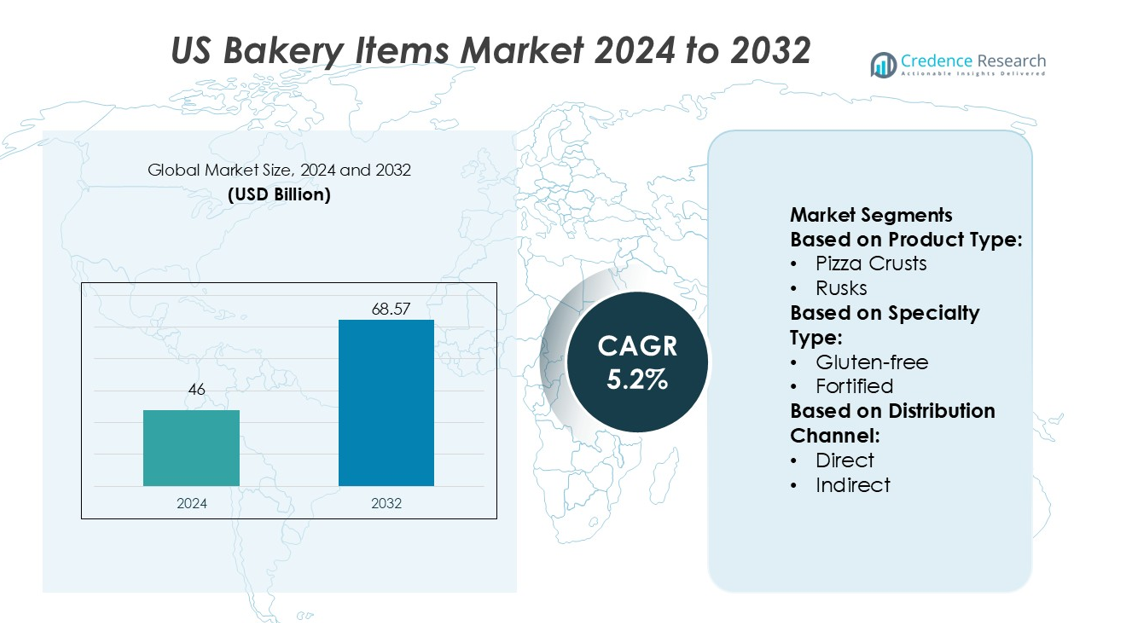
Home » Food & Beverage » US Bakery Items Market

US Bakery Items Market By Bread (White Bread, Whole Wheat Bread, Multigrain Bread, Artisanal Bread) By Pastries (Croissants, Danish Pastries, Turnovers, Strudels) Growth, Future Prospects & Competitive Analysis, 2016 – 2030

Price: $1999

Published: | Report ID: 21138 | Report Format : PDF

Market Insights

  • The US demand for bakery items was valued at USD 72.5 Billion in 2022 and is expected to reach USD 86.28 Billion in 2030, growing at a CAGR of 2.2% between 2023 and 2030.
  • The whole wheat bread segment is the market leader, accounting for more than 30% of total value in 2022, while the multigrain bread segment is expected to grow rapidly throughout the projection period.
  • The croissants segment dominates the US need for bakery items in terms of pastries, accounting for more than 33% in 2022 and is predicted to expand at a high CAGR.
  • The cupcakes segment accounted for the largest market share of over 35% in 2022 and is anticipated to register the highest CAGR over the estimated period.
  • The chocolate chip cookies are predicted to grow fastest over the projection period, while the peanut butter cookies segment had a market share of more than 28% in 2022.
  • With a projected high CAGR growth rate and a market share of over 40% in 2022, the yeast-raised doughnuts category will continue dominating US demand for bakery items.
  • The blueberry muffins segment is predicted to grow rapidly over the coming years, while the banana nut muffins category holds the largest market share in 2022.
  • The gluten-free bakery items category is the market leader in special dietary items, accounting for more than 41% of total value in 2022, while the vegan bakery items segment is expected to grow fast during the forecasted period.
  • The hamburger buns segment held the most market share of more than 38% in 2022 and is expected to grow fastest over the coming years.
  • Scones lead café and specialty items, accounting for over 40% of the demand in 2022 due to their versatile flavors and textures.
  • Retail grocery stores dominate the US need for bakery items in terms of distribution channels, accounting for more than 34% in 2022 and are predicted to expand at a high CAGR.
  • Health-conscious trends influence bakery product innovation, developing gluten-free, organic, and low-sugar options to cater to various dietary needs.
  • The growing popularity of online food delivery platforms and e-commerce channels enables bakeries to reach a wider audience and drive sales through digital platforms.

Executive Summary

Market Definition

Bakery products are food items manufactured and sold by bakeries and businesses specializing in baking and selling baked goods. These include various items created using sugar, flour, eggs, and other ingredients. Bread, cakes, cookies, pastries, bagels, muffins, and croissants are among the bakery products. This market encompasses various bakery products that cater to diverse consumer preferences and occasions, such as daily consumption, special events, and celebrations. It involves both artisanal and commercial bakeries, as well as the retail and food service establishments that offer bakery products to consumers. The US bakery items market is characterized by innovation, diverse flavors, and evolving consumer demands influenced by convenience, health consciousness, and taste preferences.

Design Element 2

Access crucial information at unmatched prices!

Request your free sample report today & start making informed decisions powered by Credence Research!

Download Free Sample

CTA Design Element 3

Market Overview

The US bakery items market has witnessed rapid growth in recent years and is expected to grow at a CAGR of 2.2% between 2023 and 2030. The market was valued at USD 72.5 billion in 2022 and is expected to reach USD 86.28 billion in 2030.

The US bakery items market showcases a vibrant landscape of baked goods catering to diverse consumer preferences and lifestyles. From traditional staples like freshly baked bread and classic pastries to innovative gluten-free and plant-based options, the market offers an array of choices that reflect changing dietary needs and culinary trends. The market is driven by the production and distribution of bakery products and the cultural significance of baked goods in American society. The ongoing demand for convenience and on-the-go options has also led to the expansion of bakery products in various retail formats, from standalone bakeries and cafes to supermarket shelves.

The changing lifestyles and evolving dietary preferences primarily drive US consumers toward convenient, ready-to-eat bakery products. Besides, the demand for healthier options, such as whole-grain bread and low-sugar pastries, has increased dramatically. In addition, the rise of urbanization and busy schedules have led to a surge in demand for packaged and on-the-go bakery products, catering to the fast-paced lifestyle of US consumers.

Customers also pay a premium for high-quality, artisanal bakery goods. The emphasis on craftsmanship and distinctive flavors has boosted sales of premium bread items. Aside from that, the expansion of e-commerce platforms has facilitated the availability of bakery items to consumers, allowing them to order effortlessly from the comfort of their homes.

Segmentation by Bread

  • The multigrain bread segment will exhibit the highest CAGR in the projected period. The growing emphasis on health and nutrition among consumers fuels the appeal of multigrain products.
  • Leading the market share with over 30% in 2022, whole wheat bread resonates with health-conscious consumers. Its rich fiber content and nutrient profile align with modern dietary preferences.

Segmentation by Pastries

  • Emerging as the growth leader with the highest projected CAGR, Danish pastries offer a delectable fusion of flavors and textures. Their versatility and artisanal appeal make them a sought-after choice among consumers.
  • In 2022, capturing over 33% of the market share, croissants maintain their status as a beloved classic. Their flaky layers and delightful taste continue to attract consumers.

Segmentation by Cakes

  • Cupcakes are a dominant category, accounting for more than 35% of the U.S. demand for bakery items in 2022 and is expected to grow at a high CAGR. Their single-serving convenience and customizable designs contribute to their enduring popularity.
  • Addressing diverse preferences, the layer and Bundt cakes segment offers various options, from elegant celebrations to traditional flavors, ensuring a comprehensive choice for consumers.

Segmentation by Cookies

  • The chocolate chip cookies segment is expected to grow significantly over the forecast period. Variations and innovations in recipes contribute to sustained consumer interest.
  • Leading the market share with over 28% in 2022, peanut butter cookies maintain their classic appeal. Their familiar taste and comforting texture ensure their prominent position.

Segmentation by Pies

  • The cream pies (e.g., banana cream, coconut cream) segment is anticipated to register the highest CAGR in the projection period. Their velvety textures and rich flavors make them a coveted dessert choice.
  • With a market share of nearly 40% in 2022, the fruit pies (e.g., apple, cherry, blueberry) category is leading. Their timeless appeal and seasonal variety contribute to their growth.

Segmentation by Doughnuts

  • The cake doughnuts segment will achieve the highest CAGR in the estimated period. Innovations in flavors and toppings contribute to their attractiveness to a diverse audience.
  • Leading with almost 40% of the market share in 2022, yeast-raised doughnuts retain their popularity, appealing to traditional tastes and a wide range of flavor preferences.

Segmentation by Bagels

  • Dominating with over 44% in 2022, plain bagels remain a staple choice. Their simplicity and versatility make them a go-to option for various spreads and fillings.
  • Catering to unique tastes, asiago cheese and cinnamon raisin bagels offer distinctive flavors that appeal to a niche market while enriching the broader selection.

Segmentation by Muffins

  • Capturing a significant 46% share of the US bakery items market in 2022, blueberry muffins are a beloved breakfast and snack choice.
  • Expected to grow rapidly in the forecast period, banana nut muffins offer a blend of flavors and textures that resonate with consumers seeking a satisfying treat.

Segmentation by Rolls and Buns

  • Currently dominating with over 38% of the US bakery items demand in 2022, the hamburger buns category continues to thrive, driven by the enduring popularity of burgers and sandwiches.
  • Providing options for different occasions, hot dog buns and cinnamon rolls cater to diverse preferences. Hot dog buns complement outdoor gatherings, while cinnamon rolls offer sweet indulgence.

Segmentation by Special Dietary Items

  • Leading with over 41% share in value in 2022, gluten-free bakery items address the needs of consumers seeking dietary alternatives. The focus on gluten-conscious choices aligns with evolving health considerations.
  • Projected to exhibit a significant CAGR, the vegan bakery items segment is at the forefront of catering to ethical and plant-based consumption trends.

Segmentation by Seasonal and Holiday Items

  • Anticipated to achieve the highest CAGR, the holiday cookies segment resonates with festive celebrations and gifting traditions, making them a seasonal favorite.
  • Continuously shaping the industry with a substantial 46% share in 2022, fruitcakes remain a symbol of tradition and celebration during special occasions.

Segmentation by Frozen Bakery Products

  • Set to exhibit the highest CAGR, frozen croissants offer convenience and premium quality. Their ability to deliver freshly baked goodness from the freezer contributes to their appeal.
  • Leading the frozen bakery product segment in 2022, frozen dough remains a versatile choice for professional bakers and home enthusiasts. Its convenience and quality uphold its prominent position.

Segmentation by Café and Specialty Items

  • Dominating with over 40% of the US bakery items demand in 2022, scones complement café culture and offer versatile flavors that cater to diverse preferences.
  • Addressing unique tastes, quiches and focaccia bread enhances café menus with savory offerings that cater to consumers seeking flavorful and satisfying options.

Segmentation by Distribution Channels

  • Retail grocery stores are a dominant distribution channel category, accounting for more than 34% of the US demand for bakery items in 2022 and are expected to grow at a high CAGR. Retail grocery stores provide consumers with a one-stop shopping experience by bringing a diverse range of products, including bakery items, under one roof. This convenience draws many shoppers who want to meet their shopping and bakery needs in one visit. In addition, retail grocery stores have substantial and well-established distribution networks. Their large-scale operations and efficient supply chains allow them to access a larger client base, contributing to their market dominance.
  • The artisanal bakeries segment addresses the remaining need for bakery items. Artisanal bakeries often offer competitive prices and discounts, which appeal to budget-conscious customers. Their ability to provide discounts and package deals increases client loyalty and encourages repeat business. They increase sales of bakery products and other commodities through enticing displays and promotional activities.

Segmentation by Flavor and Ingredient Variations

  • The seasonal flavors segment is expected to grow significantly over the forecast period. These limited-time offerings create excitement and anticipation.
  • Leading the market revenue with over 40% share in 2022, the exotic ingredients segment introduces novel taste dimensions, satisfying consumers seeking innovative and diverse bakery offerings.

The increasing customer preferences for convenience and health-conscious options, culinary innovation, the cultural significance of baked products, and the expanding reach through e-commerce platforms are the primary drivers of growth in the US bakery items industry.

The growing health and wellness awareness has increased the demand for bakery items with organic, natural, and functional ingredients. Moreover, effective marketing techniques and strong branding are important in influencing consumer decisions and developing brand loyalty in the competitive baking sector. Bakeries constantly innovate to bring new flavors, styles, and healthier ingredients. Product variety attracts a broader consumer base and maintains the market dynamic.

Key Highlights of the Report

The US bakery items market is segmented by Bread, Pastries, Cakes, Cookies, Pies, Doughnuts, Bagels, Muffins, Rolls and Buns, Special Dietary Items, Seasonal and Holiday Items, Frozen Bakery Products, Café and Specialty Items, Distribution Channels, Flavor and Ingredient Variations. Multigrain and whole wheat breads are positioned for growth, driven by health-conscious consumer preferences. Pastries, led by croissants and Danish pastries, are popular, while cupcakes dominate the cake category. Fruit and cream pies exhibit distinct appeal, while doughnuts, bagels, muffins, and rolls cater to varied tastes. The market showcases gluten-free and vegan bakery items to align with dietary preferences. In terms of distribution channels, retail grocery stores dominate the market’s distribution landscape, catering to a significant portion of consumer demand for bakery items. Holiday items, seasonal flavors, and exotic ingredients emerge as influential market drivers, while frozen bakery products and specialty café items offer convenience and unique flavors.

Health consciousness and indulgence are parallel trends dominating the United States bakery items market. The demand for bakery products that can be quickly prepared at home or grabbed on the go has increased in the U.S. owing to an increase in busy lives and the desire for rapid and simple meals. The market is expanding due to the convenience offered in terms of time savings and the low effort required for meal preparation.

Baked items have very high permissibility, and American consumers like the occasional baked fulfillment as part of daily life. According to the American Bakers Association, 84% of Americans feel it acceptable to occasionally treat themselves to baked goods such as cookies, cupcakes, doughnuts, or pie. Customers from Generation Z and Millennials in the United States liked baked items such as pizza, flatbreads, wraps, and tortillas. As per the same source, nearly 90% have purchased various products. The growing demand for convenient and frozen bakery items propels the market expansion.

What Are The Main Drivers Of The US Bakery Items Market?

The main drivers of the US bakery items market include evolving consumer preferences and lifestyles, where convenience and on-the-go options are sought after, driving demand for a variety of baked goods that cater to diverse tastes and dietary needs. Besides, the cultural significance of bakery products in American cuisine and celebrations fuels consistent demand, fostering the growth of local bakeries and commercial establishments. The influence of culinary trends and innovations, such as artisanal baking techniques, novel flavor combinations, and health-conscious offerings, further stimulates consumer interest and consumption. The rise of e-commerce and online food delivery services also provides greater accessibility to bakery products, contributing to market expansion and convenience-driven growth.

What Are The Major Challenges Faced By The US Bakery Items Market?

The major challenges the US bakery items market faces are the rising ingredient and production costs, which can impact profit margins for both small and large-scale bakeries. Health and dietary trends, while driving innovation, also pose challenges in reformulating recipes to meet changing consumer demands for healthier options without compromising taste and texture.

What Are The Growth Opportunities In The US Bakery Items Market?

The US bakery items market presents several growth opportunities fueled by evolving consumer preferences and industry trends. The increasing demand for health-conscious and dietary-specific products creates avenues for developing gluten-free, organic, and plant-based bakery items to cater to a wider range of US consumer needs. Furthermore, tapping into the convenience and on-the-go trend, bakeries can expand their product lines to include ready-to-eat snacks and portable options that align with busy lifestyles. Embracing e-commerce and digital platforms for online ordering and delivery services also opens new channels for reaching consumers directly. Exploring creative packaging solutions and offering customizable bakery items for special occasions drives market revenue share.

Changing Consumer Preferences

Health-conscious customers increasingly seek bakery foods corresponding to their dietary preferences and nutritional requirements. Products manufactured from whole grains, seeds, and other healthy components are in high demand as they are regarded to have higher nutritional value. In addition, there has been an increase in demand for bakery items with lower sugar content and those that cater to special dietary demands, such as dairy-free, gluten-free, or vegan alternatives.

Moreover, the expanding working population and improved consumer lifestyles have increased the consumption of ready-to-eat (RTE) food items such as nutritious bread, chicken puffs, pizza rolls, and muffins nationwide. Launching products containing wholegrain, high fiber, or other health-promoting components cater to the health-conscious consumer. For instance, in January 2023, Bimbo Bakeries United States brand Sara Lee introduced new white bread with vegetables. According to the manufacturer, the product is cooked with one cup of vegetables per loaf and enriched with vitamins A, D, and E.

Rising Ingredient and Production Costs

The escalating ingredients and production costs are a major restraint in the US bakery items market. Fluctuations in commodity prices, supply chain disruptions, and increased demand for specialty and organic ingredients can strain the profitability of bakery businesses. Bakeries may face challenges in maintaining affordable consumer prices while ensuring consistent quality. Managing these rising costs without compromising on product quality requires careful sourcing, production efficiency improvements, and potential adjustments to pricing strategies.

Diversification of Product Offerings

One key opportunity in the US bakery items market is the diversification of product offerings to cater to evolving consumer preferences. As consumers seek convenience and unique experiences, bakeries can expand beyond traditional baked goods to offer a wider range of options. This includes introducing ready-to-eat snacks, breakfast items, and healthier alternatives. For example, bakeries can develop protein-packed muffins, energy bars, and portable snack packs to cater to on-the-go lifestyles.

Product innovation is an important aspect of driving customer interest and brand loyalty. Companies also experiment with novel flavors, textures, and shapes to attract and retain customers. Furthermore, they are focused on healthier alternatives, which has resulted in the development of bakery items that include superfoods, natural ingredients, and functional elements such as probiotics and fortified nutrients.

Competitive Landscape

Key Players

A diverse mix of artisanal bakeries, commercial establishments, and retail chains characterizes the competitive landscape of the US bakery items market. Some of the major players in the market and their market share are as follows:

  • Mondelez International Inc
  • Kellogg Company
  • Hostess Brands Inc
  • Campbell Soup Company
  • Gruma SAB de CV
  • General Mills Inc
  • Grupo Bimbo SAB De CV
  • Alpha Baking Co. Inc
  • Sara Lee Frozen Bakery
  • Flowers Foods Inc
  • Others

Intense competition is driven by the pursuit of culinary innovation, product differentiation, and catering to changing consumer preferences. The market showcases a range of bakery items, from traditional offerings to health-conscious and specialty products, each vying for consumer attention. Brands that successfully combine high-quality ingredients, distinctive flavors, and appealing presentations will likely capture consumer loyalty. Effective marketing strategies, such as leveraging social media platforms, participating in local events, and emphasizing sustainability efforts, play a key role in establishing a competitive edge.

In March 2021, Mmmly, a company based in the United States, introduced plant-based reinvented cookies. These cookies are made with clean ingredients, including prebiotic fiber, root fruits and veggies, and nutritious fats that fuel the brain and support digestive health and well-being.

In February 2020, Nestlé increased its KitKat premium collection of two-finger biscuits by introducing two new bakery items in three different flavors.

Shape Your Report to Specific Countries or Regions & Enjoy 30% Off!

Summary of Key Findings

  • The US bakery items market is experiencing steady growth driven by shifting consumer preferences and diverse product offerings.
  • Market segmented by Bread, Pastries, Cakes, Cookies, Pies, Doughnuts, Bagels, Muffins, Rolls and Buns, Special Dietary Items, Seasonal and Holiday Items, Frozen Bakery Products, Café and Specialty Items, Distribution Channels, Flavor and ingredient Variations.
  • Multigrain bread demonstrates a strong potential for growth, projecting the highest market CAGR in the projected period.
  • Cupcakes lead the cake segment, capturing more than 35% market share in 2022, driven by their convenience and customizable designs.
  • Danish pastries are poised for substantial expansion, with an expected highest CAGR among pastries.
  • Gluten-free bakery items address dietary preferences, leading the special dietary items segment.
  • In 2022, exotic ingredients lead the flavor and ingredient variations segment, contributing to over 40% of the market revenue.
  • Bakeries are embracing technology for customer engagement and production efficiency, with online ordering platforms, mobile apps, and digital loyalty programs enhancing the overall customer experience.
  • The market is witnessing a rise in demand for clean-label products, with consumers paying close attention to ingredient lists and seeking products made with recognizable and natural ingredients.

Future Outlook

  • Social media platforms play a significant role in marketing bakery items, allowing bakeries to showcase their products visually and engage with customers through creative content and promotions.
  • Sustainability and ethical practices are gaining importance, with consumers preferring bakeries that prioritize eco-friendly packaging, responsible sourcing, and waste reduction.
  • Collaborations with local cafes, restaurants, and food service providers are expanding the reach of bakery products, creating opportunities for cross-promotion, and increasing visibility.

Segmentation

  • By Bread
    • White Bread
    • Whole Wheat Bread
    • Multigrain Bread
    • Artisanal Bread
  • By Pastries
    • Croissants
    • Danish Pastries
    • Turnovers
    • Strudels
  • By Cakes
    • Layer Cakes
    • Bundt Cakes
    • Cupcakes
    • Cheesecakes
  • By Cookies
    • Chocolate Chip Cookies
    • Sugar Cookies
    • Snickerdoodles
    • Oatmeal Raisin Cookies
    • Peanut Butter Cookies
  • By Pies
    • Fruit Pies (e.g., apple, cherry, blueberry)
    • Cream Pies (e.g., banana cream, coconut cream)
    • Custard Pies (e.g., pumpkin, sweet potato)
  • By Doughnuts
    • Yeast-Raised Doughnuts
    • Cake Doughnuts
    • Filled Doughnuts
  • By Bagels
    • Plain Bagels
    • Cinnamon Raisin Bagels
    • Asiago Cheese Bagels
  • By Muffins
    • Blueberry Muffins
    • Chocolate Chip Muffins
    • Banana Nut Muffins
  • By Rolls and Buns
    • Dinner Rolls
    • Hamburger Buns
    • Hot Dog Buns
    • Cinnamon Rolls
  • By Special Dietary Items
    • Gluten-Free Bakery Items
    • Vegan Bakery Items
    • Sugar-Free Bakery Items
  • By Seasonal and Holiday Items
    • Gingerbread Houses
    • Fruitcakes
    • Holiday Cookies
  • By Frozen Bakery Products
    • Frozen Dough
    • Frozen Pies and Tarts
    • Frozen Croissants
  • By Café and Specialty Items
    • Scones
    • Quiches
    • Focaccia Bread
  • By Distribution Channels
    • Retail Grocery Stores
    • Artisanal Bakeries
    • Cafés and Coffee Shops
    • Others
  • By Flavor and Ingredient Variations
    • Seasonal Flavors
    • Exotic Ingredients

Adjacent Markets

Several adjacent markets in the US bakery items market have high revenue growth opportunities. The key adjacent markets for the US bakery items market –

1. Preface
1.1. Report Description
1.1.1. Purpose of the Report
1.1.2. Target Audience
1.1.3. USP and Key Offerings
1.2. Research Scope
1.3. Market Introduction

2. Executive Summary
2.1. Market Snapshot: US Bakery Items Market
2.1.1. US Bakery Items Market, By Bread
2.1.2. US Bakery Items Market, By Pastries
2.1.3. US Bakery Items Market, By Cakes
2.1.4. US Bakery Items Market, By Cookies
2.1.5. US Bakery Items Market, By Pies
2.1.6. US Bakery Items Market, By Doughnuts
2.1.7. US Bakery Items Market, By Bagels
2.1.8. US Bakery Items Market, By Muffins
2.1.9. US Bakery Items Market, By Rolls and Buns
2.1.10. US Bakery Items Market, By Special Dietary Items
2.1.11. US Bakery Items Market, By Seasonal and Holiday Items
2.1.12. US Bakery Items Market, By Frozen Bakery Products
2.1.13. US Bakery Items Market, By Café and Specialty Items
2.1.14. US Bakery Items Market, By Distribution Channels
2.1.15. US Bakery Items Market, By Flavor and Ingredient Variations
2.2. Insights from Primary Respondents

3. Market Dynamics & Factors Analysis
3.1. Introduction
3.1.1. US Bakery Items Market Value, 2017-2030, (US$ Bn)
3.1.2. Y-o-Y Growth Trend Analysis
3.2. Market Dynamics
3.2.1. US Bakery Items Market Drivers
3.2.2. US Bakery Items Market Restraints
3.2.3. US Bakery Items Market Opportunities
3.2.4. Major United States Bakery Items Industry Challenges
3.3. Growth and Development Patterns
3.4. Investment Feasibility Analysis
3.5. Market Opportunity Analysis
3.5.1. Bread
3.5.2. Pastries
3.5.3. Cakes
3.5.4. Cookies
3.5.5. Pies
3.5.6. Doughnuts
3.5.7. Bagels
3.5.8. Muffins
3.5.9. Rolls and Buns
3.5.10. Special Dietary Items
3.5.11. Seasonal and Holiday Items
3.5.12. Frozen Bakery Products
3.5.13. Café and Specialty Items
3.5.14. Distribution Channels
3.5.15. Flavor and Ingredient Variations
3.5.16. Geography

4. Market Competitive Landscape Analysis
4.1. Company Market Share Analysis, 2022
4.1.1. US Bakery Items Market: Company Market Share, Value 2022
4.1.2. US Bakery Items Market: Top 6 Company Market Share, Value 2022
4.1.3. US Bakery Items Market: Top 3 Company Market Share, Value 2022
4.2. US Bakery Items Market: Company Revenue Share Analysis, 2022
4.3. Company Assessment Metrics, 2022
4.3.1. Stars
4.3.2. Emerging Leaders
4.3.3. Pervasive Players
4.3.4. Participants
4.4. Startups/ SMEs Assessment Metrics, 2022
4.4.1. Progressive Companies
4.4.2. Responsive Companies
4.4.3. Dynamic Companies
4.4.4. Starting Blocks
4.5. Strategic Development
4.5.1. Acquisition and Mergers
4.5.2. New Product Launch
4.5.3. Regional Expansion
4.5.4. Partnerships
4.6. Key Player Product Matrix
4.7. Potential for New Players in the US Bakery Items Market

5. Premium Insights
5.1. STAR (Situation, Task, Action, Results) Analysis
5.2. Porter’s Five Forces Analysis
5.2.1. Threat of New Entrants
5.2.2. Bargaining Power of Buyers/Consumers
5.2.3. Bargaining Power of Suppliers
5.2.4. Threat of Substitute Types
5.2.5. Intensity of Competitive Rivalry
5.3. PESTEL Analysis
5.3.1. Political Factors
5.3.2. Economic Factors
5.3.3. Social Factors
5.3.4. Technological Factors
5.3.5. Environmental Factors
5.3.6. Legal Factors
5.4. Key Market Trends
5.4.1. Demand Side Trends
5.4.2. Supply Side Trends
5.5. Value Chain Analysis
5.6. Technology Analysis
5.6.1. Research and development in the market
5.6.2. Patent Analysis
5.6.3. Emerging technologies and their potential disruption to the market
5.7. Consumer Behaviour Analysis
5.7.1. Consumer Preferences and Expectations
5.7.2. Factors Influencing Consumer Buying Decisions
5.7.3. Consumer Pain Points
5.8. Analysis and Recommendations
5.9. Adjacent Market Analysis

6. Market Positioning of Key Players, 2022
6.1. Company market share of key players, 2022
6.2. Competitive Benchmarking
6.3. Market Positioning of Key Vendors
6.4. Geographical Presence Analysis
6.5. Major Strategies Adopted by Key Players
6.5.1. Key Strategies Analysis
6.5.2. Mergers and Acquisitions
6.5.3. Partnerships
6.5.4. Product Launch
6.5.5. Geographical Expansion
6.5.6. Others

7. Impact Analysis of COVID-19 and Russia – Ukraine War on US Bakery Items Market
7.1. Ukraine-Russia War Impact
7.1.1. Uncertainty and Economic Instability
7.1.2. Supply chain disruptions
7.1.3. Regional market shifts
7.1.4. Shift in government priorities
7.2. COVID-19 Impact Analysis
7.2.1. Supply Chain Disruptions
7.2.2. Demand Fluctuations
7.2.3. Shift in Product Mix
7.2.4. Reduced Industrial Activity

8. US Bakery Items Market, By Bread
8.1. US Bakery Items Market Overview, by Bread
8.1.1. US Bakery Items Market Revenue Share, By Bread, 2022 Vs 2030 (in %)
8.2. White Bread
8.2.1. US Bakery Items Market, By White Bread, By Country, 2017-2030 (US$ Bn)
8.2.2. Market Dynamics for White Bread
8.2.2.1. Drivers
8.2.2.2. Restraints
8.2.2.3. Opportunities
8.2.2.4. Trends
8.3. Whole Wheat Bread
8.3.1. US Bakery Items Market, By Whole Wheat Bread, By Country, 2017-2030 (US$ Bn)
8.3.2. Market Dynamics for Whole Wheat Bread
8.3.2.1. Drivers
8.3.2.2. Restraints
8.3.2.3. Opportunities
8.3.2.4. Trends
8.4. Multigrain Bread
8.4.1. US Bakery Items Market, By Multigrain Bread, By Country, 2017-2030 (US$ Bn)
8.4.2. Market Dynamics for Multigrain Bread
8.4.2.1. Drivers
8.4.2.2. Restraints
8.4.2.3. Opportunities
8.4.2.4. Trends
8.5. Artisanal Bread
8.5.1. US Bakery Items Market, By Artisanal Bread, By Country, 2017-2030 (US$ Bn)
8.5.2. Market Dynamics for Artisanal Bread
8.5.2.1. Drivers
8.5.2.2. Restraints
8.5.2.3. Opportunities
8.5.2.4. Trends

9. US Bakery Items Market, By Pastries
9.1. US Bakery Items Market Overview, by Pastries
9.1.1. US Bakery Items Market Revenue Share, By Pastries, 2022 Vs 2030 (in %)
9.2. Croissants
9.2.1. US Bakery Items Market, By Croissants, By Country, 2017-2030 (US$ Bn)
9.2.2. Market Dynamics for Croissants
9.2.2.1. Drivers
9.2.2.2. Restraints
9.2.2.3. Opportunities
9.2.2.4. Trends
9.3. Danish Pastries
9.3.1. US Bakery Items Market, By Danish Pastries, By Country, 2017-2030 (US$ Bn)
9.3.2. Market Dynamics for Danish Pastries
9.3.2.1. Drivers
9.3.2.2. Restraints
9.3.2.3. Opportunities
9.3.2.4. Trends
9.4. Turnovers
9.4.1. US Bakery Items Market, By Turnovers, By Country, 2017-2030 (US$ Bn)
9.4.2. Market Dynamics for Turnovers
9.4.2.1. Drivers
9.4.2.2. Restraints
9.4.2.3. Opportunities
9.4.2.4. Trends
9.5. Strudels
9.5.1. US Bakery Items Market, By Strudels, By Country, 2017-2030 (US$ Bn)
9.5.2. Market Dynamics for Strudels
9.5.2.1. Drivers
9.5.2.2. Restraints
9.5.2.3. Opportunities
9.5.2.4. Trends

10. US Bakery Items Market, By Cakes
10.1. US Bakery Items Market Overview, by Cakes
10.1.1. US Bakery Items Market Revenue Share, By Cakes, 2022 Vs 2030 (in %)
10.2. Layer Cakes
10.2.1. US Bakery Items Market, By Layer Cakes, By Country, 2017-2030 (US$ Bn)
10.2.2. Market Dynamics for Layer Cakes
10.2.2.1. Drivers
10.2.2.2. Restraints
10.2.2.3. Opportunities
10.2.2.4. Trends
10.3. Bundt Cakes
10.3.1. US Bakery Items Market, By Bundt Cakes, By Country, 2017-2030 (US$ Bn)
10.3.2. Market Dynamics for Bundt Cakes
10.3.2.1. Drivers
10.3.2.2. Restraints
10.3.2.3. Opportunities
10.3.2.4. Trends
10.4. Cupcakes
10.4.1. US Bakery Items Market, By Cupcakes, By Country, 2017-2030 (US$ Bn)
10.4.2. Market Dynamics for Cupcakes
10.4.2.1. Drivers
10.4.2.2. Restraints
10.4.2.3. Opportunities
10.4.2.4. Trends
10.5. Cheesecakes
10.5.1. US Bakery Items Market, By Cheesecakes, By Country, 2017-2030 (US$ Bn)
10.5.2. Market Dynamics for Cheesecakes
10.5.2.1. Drivers
10.5.2.2. Restraints
10.5.2.3. Opportunities
10.5.2.4. Trends

11. US Bakery Items Market, By Cookies
11.1. US Bakery Items Market Overview, by Cookies
11.1.1. US Bakery Items Market Revenue Share, By Cookies, 2022 Vs 2030 (in %)
11.2. Chocolate Chip Cookies
11.2.1. US Bakery Items Market, By Chocolate Chip Cookies, By Country, 2017-2030 (US$ Bn)
11.2.2. Market Dynamics for Chocolate Chip Cookies
11.2.2.1. Drivers
11.2.2.2. Restraints
11.2.2.3. Opportunities
11.2.2.4. Trends
11.3. Sugar Cookies
11.3.1. US Bakery Items Market, By Sugar Cookies, By Country, 2017-2030 (US$ Bn)
11.3.2. Market Dynamics for Sugar Cookies
11.3.2.1. Drivers
11.3.2.2. Restraints
11.3.2.3. Opportunities
11.3.2.4. Trends
11.4. Snickerdoodles
11.4.1. US Bakery Items Market, By Snickerdoodles, By Country, 2017-2030 (US$ Bn)
11.4.2. Market Dynamics for Snickerdoodles
11.4.2.1. Drivers
11.4.2.2. Restraints
11.4.2.3. Opportunities
11.4.2.4. Trends
11.5. Oatmeal Raisin Cookies
11.5.1. US Bakery Items Market, By Oatmeal Raisin Cookies, By Country, 2017-2030 (US$ Bn)
11.5.2. Market Dynamics for Oatmeal Raisin Cookies
11.5.2.1. Drivers
11.5.2.2. Restraints
11.5.2.3. Opportunities
11.5.2.4. Trends
11.6. Peanut Butter Cookies
11.6.1. US Bakery Items Market, By Peanut Butter Cookies, By Country, 2017-2030 (US$ Bn)
11.6.2. Market Dynamics for Peanut Butter Cookies
11.6.2.1. Drivers
11.6.2.2. Restraints
11.6.2.3. Opportunities
11.6.2.4. Trends

12. US Bakery Items Market, By Pies
12.1. US Bakery Items Market Overview, by Pies
12.1.1. US Bakery Items Market Revenue Share, By Pies, 2022 Vs 2030 (in %)
12.2. Fruit Pies (e.g., apple, cherry, blueberry)
12.2.1. US Bakery Items Market, By Fruit Pies (e.g., apple, cherry, blueberry), By Country, 2017-2030 (US$ Bn)
12.2.2. Market Dynamics for Fruit Pies (e.g., apple, cherry, blueberry)
12.2.2.1. Drivers
12.2.2.2. Restraints
12.2.2.3. Opportunities
12.2.2.4. Trends
12.3. Cream Pies (e.g., banana cream, coconut cream)
12.3.1. US Bakery Items Market, By Cream Pies (e.g., banana cream, coconut cream), By Country, 2017-2030 (US$ Bn)
12.3.2. Market Dynamics for Cream Pies (e.g., banana cream, coconut cream)
12.3.2.1. Drivers
12.3.2.2. Restraints
12.3.2.3. Opportunities
12.3.2.4. Trends
12.4. Custard Pies (e.g., pumpkin, sweet potato)
12.4.1. US Bakery Items Market, By Custard Pies (e.g., pumpkin, sweet potato), By Country, 2017-2030 (US$ Bn)
12.4.2. Market Dynamics for Custard Pies (e.g., pumpkin, sweet potato)
12.4.2.1. Drivers
12.4.2.2. Restraints
12.4.2.3. Opportunities
12.4.2.4. Trends

13. US Bakery Items Market, By Doughnuts
13.1. US Bakery Items Market Overview, by Doughnuts
13.1.1. US Bakery Items Market Revenue Share, By Doughnuts, 2022 Vs 2030 (in %)
13.2. Yeast-Raised Doughnuts
13.2.1. US Bakery Items Market, By Yeast-Raised Doughnuts, By Country, 2017-2030 (US$ Bn)
13.2.2. Market Dynamics for Yeast-Raised Doughnuts
13.2.2.1. Drivers
13.2.2.2. Restraints
13.2.2.3. Opportunities
13.2.2.4. Trends
13.3. Cake Doughnuts
13.3.1. US Bakery Items Market, By Cake Doughnuts, By Country, 2017-2030 (US$ Bn)
13.3.2. Market Dynamics for Cake Doughnuts
13.3.2.1. Drivers
13.3.2.2. Restraints
13.3.2.3. Opportunities
13.3.2.4. Trends
13.4. Filled Doughnuts
13.4.1. US Bakery Items Market, By Filled Doughnuts, By Country, 2017-2030 (US$ Bn)
13.4.2. Market Dynamics for Filled Doughnuts
13.4.2.1. Drivers
13.4.2.2. Restraints
13.4.2.3. Opportunities
13.4.2.4. Trends

14. US Bakery Items Market, By Bagels
14.1. US Bakery Items Market Overview, by Bagels
14.1.1. US Bakery Items Market Revenue Share, By Bagels, 2022 Vs 2030 (in %)
14.2. Plain Bagels
14.2.1. US Bakery Items Market, By Plain Bagels, By Country, 2017-2030 (US$ Bn)
14.2.2. Market Dynamics for Plain Bagels
14.2.2.1. Drivers
14.2.2.2. Restraints
14.2.2.3. Opportunities
14.2.2.4. Trends
14.3. Cinnamon Raisin Bagels
14.3.1. US Bakery Items Market, By Cinnamon Raisin Bagels, By Country, 2017-2030 (US$ Bn)
14.3.2. Market Dynamics for Cinnamon Raisin Bagels
14.3.2.1. Drivers
14.3.2.2. Restraints
14.3.2.3. Opportunities
14.3.2.4. Trends
14.4. Asiago Cheese Bagels
14.4.1. US Bakery Items Market, By Asiago Cheese Bagels, By Country, 2017-2030 (US$ Bn)
14.4.2. Market Dynamics for Asiago Cheese Bagels
14.4.2.1. Drivers
14.4.2.2. Restraints
14.4.2.3. Opportunities
14.4.2.4. Trends

15. US Bakery Items Market, By Muffins
15.1. US Bakery Items Market Overview, by Muffins
15.1.1. US Bakery Items Market Revenue Share, By Muffins, 2022 Vs 2030 (in %)
15.2. Blueberry Muffins
15.2.1. US Bakery Items Market, By Blueberry Muffins, By Country, 2017-2030 (US$ Bn)
15.2.2. Market Dynamics for Blueberry Muffins
15.2.2.1. Drivers
15.2.2.2. Restraints
15.2.2.3. Opportunities
15.2.2.4. Trends
15.3. Chocolate Chip Muffins
15.3.1. US Bakery Items Market, By Chocolate Chip Muffins, By Country, 2017-2030 (US$ Bn)
15.3.2. Market Dynamics for Chocolate Chip Muffins
15.3.2.1. Drivers
15.3.2.2. Restraints
15.3.2.3. Opportunities
15.3.2.4. Trends
15.4. Banana Nut Muffins
15.4.1. US Bakery Items Market, By Banana Nut Muffins, By Country, 2017-2030 (US$ Bn)
15.4.2. Market Dynamics for Banana Nut Muffins
15.4.2.1. Drivers
15.4.2.2. Restraints
15.4.2.3. Opportunities
15.4.2.4. Trends

16. US Bakery Items Market, By Rolls and Buns
16.1. US Bakery Items Market Overview, by Rolls and Buns
16.1.1. US Bakery Items Market Revenue Share, By Rolls and Buns, 2022 Vs 2030 (in %)
16.2. Dinner Rolls
16.2.1. US Bakery Items Market, By Dinner Rolls, By Country, 2017-2030 (US$ Bn)
16.2.2. Market Dynamics for Dinner Rolls
16.2.2.1. Drivers
16.2.2.2. Restraints
16.2.2.3. Opportunities
16.2.2.4. Trends
16.3. Hamburger Buns
16.3.1. US Bakery Items Market, By Hamburger Buns, By Country, 2017-2030 (US$ Bn)
16.3.2. Market Dynamics for Hamburger Buns
16.3.2.1. Drivers
16.3.2.2. Restraints
16.3.2.3. Opportunities
16.3.2.4. Trends
16.4. Hot Dog Buns
16.4.1. US Bakery Items Market, By Hot Dog Buns, By Country, 2017-2030 (US$ Bn)
16.4.2. Market Dynamics for Hot Dog Buns
16.4.2.1. Drivers
16.4.2.2. Restraints
16.4.2.3. Opportunities
16.4.2.4. Trends
16.5. Cinnamon Rolls
16.5.1. US Bakery Items Market, By Cinnamon Rolls, By Country, 2017-2030 (US$ Bn)
16.5.2. Market Dynamics for Cinnamon Rolls
16.5.2.1. Drivers
16.5.2.2. Restraints
16.5.2.3. Opportunities
16.5.2.4. Trends

17. US Bakery Items Market, By Special Dietary Items
17.1. US Bakery Items Market Overview, by Special Dietary Items
17.1.1. US Bakery Items Market Revenue Share, By Special Dietary Items, 2022 Vs 2030 (in %)
17.2. Gluten-Free Bakery Items
17.2.1. US Bakery Items Market, By Gluten-Free Bakery Items, By Country, 2017-2030 (US$ Bn)
17.2.2. Market Dynamics for Gluten-Free Bakery Items
17.2.2.1. Drivers
17.2.2.2. Restraints
17.2.2.3. Opportunities
17.2.2.4. Trends
17.3. Vegan Bakery Items
17.3.1. US Bakery Items Market, By Vegan Bakery Items, By Country, 2017-2030 (US$ Bn)
17.3.2. Market Dynamics for Vegan Bakery Items
17.3.2.1. Drivers
17.3.2.2. Restraints
17.3.2.3. Opportunities
17.3.2.4. Trends
17.4. Sugar-Free Bakery Items
17.4.1. US Bakery Items Market, By Sugar-Free Bakery Items, By Country, 2017-2030 (US$ Bn)
17.4.2. Market Dynamics for Sugar-Free Bakery Items
17.4.2.1. Drivers
17.4.2.2. Restraints
17.4.2.3. Opportunities
17.4.2.4. Trends

18. US Bakery Items Market, By Seasonal and Holiday Items
18.1. US Bakery Items Market Overview, by Seasonal and Holiday Items
18.1.1. US Bakery Items Market Revenue Share, By Seasonal and Holiday Items, 2022 Vs 2030 (in %)
18.2. Gingerbread Houses
18.2.1. US Bakery Items Market, By Gingerbread Houses, By Country, 2017-2030 (US$ Bn)
18.2.2. Market Dynamics for Gingerbread Houses
18.2.2.1. Drivers
18.2.2.2. Restraints
18.2.2.3. Opportunities
18.2.2.4. Trends
18.3. Fruitcakes
18.3.1. US Bakery Items Market, By Fruitcakes, By Country, 2017-2030 (US$ Bn)
18.3.2. Market Dynamics for Fruitcakes
18.3.2.1. Drivers
18.3.2.2. Restraints
18.3.2.3. Opportunities
18.3.2.4. Trends
18.4. Holiday Cookies
18.4.1. US Bakery Items Market, By Holiday Cookies, By Country, 2017-2030 (US$ Bn)
18.4.2. Market Dynamics for Holiday Cookies
18.4.2.1. Drivers
18.4.2.2. Restraints
18.4.2.3. Opportunities
18.4.2.4. Trends

19. US Bakery Items Market, By Frozen Bakery Products
19.1. US Bakery Items Market Overview, by Frozen Bakery Products
19.1.1. US Bakery Items Market Revenue Share, By Frozen Bakery Products, 2022 Vs 2030 (in %)
19.2. Frozen Dough
19.2.1. US Bakery Items Market, By Frozen Dough, By Country, 2017-2030 (US$ Bn)
19.2.2. Market Dynamics for Frozen Dough
19.2.2.1. Drivers
19.2.2.2. Restraints
19.2.2.3. Opportunities
19.2.2.4. Trends
19.3. Frozen Pies and Tarts
19.3.1. US Bakery Items Market, By Frozen Pies and Tarts, By Country, 2017-2030 (US$ Bn)
19.3.2. Market Dynamics for Frozen Pies and Tarts
19.3.2.1. Drivers
19.3.2.2. Restraints
19.3.2.3. Opportunities
19.3.2.4. Trends
19.4. Frozen Croissants
19.4.1. US Bakery Items Market, By Frozen Croissants, By Country, 2017-2030 (US$ Bn)
19.4.2. Market Dynamics for Frozen Croissants
19.4.2.1. Drivers
19.4.2.2. Restraints
19.4.2.3. Opportunities
19.4.2.4. Trends

20. US Bakery Items Market, By Café and Specialty Items
20.1. US Bakery Items Market Overview, by Café and Specialty Items
20.1.1. US Bakery Items Market Revenue Share, By Café and Specialty Items, 2022 Vs 2030 (in %)
20.2. Scones
20.2.1. US Bakery Items Market, By Scones, By Country, 2017-2030 (US$ Bn)
20.2.2. Market Dynamics for Scones
20.2.2.1. Drivers
20.2.2.2. Restraints
20.2.2.3. Opportunities
20.2.2.4. Trends
20.3. Quiches
20.3.1. US Bakery Items Market, By Quiches, By Country, 2017-2030 (US$ Bn)
20.3.2. Market Dynamics for Quiches
20.3.2.1. Drivers
20.3.2.2. Restraints
20.3.2.3. Opportunities
20.3.2.4. Trends
20.4. Focaccia Bread
20.4.1. US Bakery Items Market, By Focaccia Bread, By Country, 2017-2030 (US$ Bn)
20.4.2. Market Dynamics for Focaccia Bread
20.4.2.1. Drivers
20.4.2.2. Restraints
20.4.2.3. Opportunities
20.4.2.4. Trends

21. US Bakery Items Market, By Distribution Channels
21.1. US Bakery Items Market Overview, by Distribution Channels
21.1.1. US Bakery Items Market Revenue Share, By Distribution Channels, 2022 Vs 2030 (in %)
21.2. Retail Grocery Stores
21.2.1. US Bakery Items Market, By Retail Grocery Stores, By Country, 2017-2030 (US$ Bn)
21.2.2. Market Dynamics for Retail Grocery Stores
21.2.2.1. Drivers
21.2.2.2. Restraints
21.2.2.3. Opportunities
21.2.2.4. Trends
21.3. Artisanal Bakeries
21.3.1. US Bakery Items Market, By Artisanal Bakeries, By Country, 2017-2030 (US$ Bn)
21.3.2. Market Dynamics for Artisanal Bakeries
21.3.2.1. Drivers
21.3.2.2. Restraints
21.3.2.3. Opportunities
21.3.2.4. Trends
21.4. Cafés and Coffee Shops
21.4.1. US Bakery Items Market, By Cafés and Coffee Shops, By Country, 2017-2030 (US$ Bn)
21.4.2. Market Dynamics for Cafés and Coffee Shops
21.4.2.1. Drivers
21.4.2.2. Restraints
21.4.2.3. Opportunities
21.4.2.4. Trends
21.5. Others
21.5.1. US Bakery Items Market, By Others, By Country, 2017-2030 (US$ Bn)
21.5.2. Market Dynamics for Others
21.5.2.1. Drivers
21.5.2.2. Restraints
21.5.2.3. Opportunities
21.5.2.4. Trends

22. US Bakery Items Market, By Flavor and Ingredient Variations
22.1. US Bakery Items Market Overview, by Flavor and Ingredient Variations
22.1.1. US Bakery Items Market Revenue Share, By Flavor and Ingredient Variations, 2022 Vs 2030 (in %)
22.2. Seasonal Flavors
22.2.1. US Bakery Items Market, By Seasonal Flavors, By Country, 2017-2030 (US$ Bn)
22.2.2. Market Dynamics for Seasonal Flavors
22.2.2.1. Drivers
22.2.2.2. Restraints
22.2.2.3. Opportunities
22.2.2.4. Trends
22.3. Exotic Ingredients
22.3.1. US Bakery Items Market, By Exotic Ingredients, By Country, 2017-2030 (US$ Bn)
22.3.2. Market Dynamics for Exotic Ingredients
22.3.2.1. Drivers
22.3.2.2. Restraints
22.3.2.3. Opportunities
22.3.2.4. Trends

23. Company Profiles
23.1. Mondelez International Inc
23.1.1. Company Overview
23.1.2. Products/Services Portfolio
23.1.3. Geographical Presence
23.1.4. SWOT Analysis
23.1.5. Financial Summary
23.1.5.1. Market Revenue and Net Profit (2019-2022)
23.1.5.2. Business Segment Revenue Analysis
23.1.5.3. Geographical Revenue Analysis
23.2. Kellogg Company
23.3. Hostess Brands Inc
23.4. Campbell Soup Company
23.5. Gruma SAB de CV
23.6. General Mills Inc
23.7. Grupo Bimbo SAB De CV
23.8. Alpha Baking Co. Inc
23.9. Sara Lee Frozen Bakery
23.10. Flowers Foods Inc
23.11. Others

24. Research Methodology
24.1. Research Methodology
24.2. Phase I – Secondary Research
24.3. Phase II – Data Modelling
24.3.1. Company Share Analysis Model
24.3.2. Revenue-Based Modelling
24.4. Phase III – Primary Research
24.5. Research Limitations
24.5.1. Assumptions

List of Figures
FIG. 1 US Bakery Items Market: Research Methodology
FIG. 2 Market Size Estimation – Top Down & Bottom Up Approach
FIG. 3 US Bakery Items Market Segmentation
FIG. 4 US Bakery Items Market, by Bread, 2022 (US$ Bn)
FIG. 5 US Bakery Items Market, by Pastries, 2022 (US$ Bn)
FIG. 6 US Bakery Items Market, by Cakes, 2022 (US$ Bn)
FIG. 7 US Bakery Items Market, by Cookies, 2022 (US$ Bn)
FIG. 8 US Bakery Items Market, by Pies, 2022 (US$ Bn)
FIG. 9 US Bakery Items Market, by Doughnuts, 2022 (US$ Bn)
FIG. 10 US Bakery Items Market, by Bagels, 2022 (US$ Bn)
FIG. 11 US Bakery Items Market, by Muffins, 2022 (US$ Bn)
FIG. 12 US Bakery Items Market, by Rolls and Buns, 2022 (US$ Bn)
FIG. 13 US Bakery Items Market, by Special Dietary Items, 2022 (US$ Bn)
FIG. 14 US Bakery Items Market, by Seasonal and Holiday Items, 2022 (US$ Bn)
FIG. 15 US Bakery Items Market, by Frozen Bakery Products, 2022 (US$ Bn)
FIG. 16 US Bakery Items Market, by Café and Specialty Items, 2022 (US$ Bn)
FIG. 17 US Bakery Items Market, by Distribution Channels, 2022 (US$ Bn)
FIG. 18 US Bakery Items Market, by Flavor and Ingredient Variations, 2022 (US$ Bn)
FIG. 19 US Bakery Items Market, by Geography, 2022 (US$ Bn)
FIG. 20 Attractive Investment Proposition, by Bread, 2022
FIG. 21 Attractive Investment Proposition, by Pastries, 2022
FIG. 22 Attractive Investment Proposition, by Cakes, 2022
FIG. 23 Attractive Investment Proposition, by Cookies, 2022
FIG. 24 Attractive Investment Proposition, by Pies, 2022
FIG. 25 Attractive Investment Proposition, by Doughnuts, 2022
FIG. 26 Attractive Investment Proposition, by Bagels, 2022
FIG. 27 Attractive Investment Proposition, by Muffins, 2022
FIG. 28 Attractive Investment Proposition, by Rolls and Buns, 2022
FIG. 29 Attractive Investment Proposition, by Special Dietary Items, 2022
FIG. 30 Attractive Investment Proposition, by Seasonal and Holiday Items, 2022
FIG. 31 Attractive Investment Proposition, by Frozen Bakery Products, 2022
FIG. 32 Attractive Investment Proposition, by Café and Specialty Items, 2022
FIG. 33 Attractive Investment Proposition, by Distribution Channels, 2022
FIG. 34 Attractive Investment Proposition, by Flavor and Ingredient Variations, 2022
FIG. 35 Attractive Investment Proposition, by Geography, 2022
FIG. 36 Market Share Analysis of Key US Bakery Items Market Manufacturers, 2022
FIG. 37 Market Positioning of Key US Bakery Items Market Manufacturers, 2022
FIG. 38 US Bakery Items Market Value Contribution, By Bread, 2022 & 2030 (Value %)
FIG. 39 US Bakery Items Market, by White Bread, Value, 2017-2030 (US$ Bn)
FIG. 40 US Bakery Items Market, by Whole Wheat Bread, Value, 2017-2030 (US$ Bn)
FIG. 41 US Bakery Items Market, by Multigrain Bread, Value, 2017-2030 (US$ Bn)
FIG. 42 US Bakery Items Market, by Artisanal Bread, Value, 2017-2030 (US$ Bn)
FIG. 43 US Bakery Items Market Value Contribution, By Pastries, 2022 & 2030 (Value %)
FIG. 44 US Bakery Items Market, by Croissants, Value, 2017-2030 (US$ Bn)
FIG. 45 US Bakery Items Market, by Danish Pastries, Value, 2017-2030 (US$ Bn)
FIG. 46 US Bakery Items Market, by Turnovers, Value, 2017-2030 (US$ Bn)
FIG. 47 US Bakery Items Market, by Strudels, Value, 2017-2030 (US$ Bn)
FIG. 48 US Bakery Items Market Value Contribution, By Cakes, 2022 & 2030 (Value %)
FIG. 49 US Bakery Items Market, by Layer Cakes, Value, 2017-2030 (US$ Bn)
FIG. 50 US Bakery Items Market, by Bundt Cakes, Value, 2017-2030 (US$ Bn)
FIG. 51 US Bakery Items Market, by Cupcakes, Value, 2017-2030 (US$ Bn)
FIG. 52 US Bakery Items Market, by Cheesecakes, Value, 2017-2030 (US$ Bn)
FIG. 53 US Bakery Items Market Value Contribution, By Cookies, 2022 & 2030 (Value %)
FIG. 54 US Bakery Items Market, by Chocolate Chip Cookies, Value, 2017-2030 (US$ Bn)
FIG. 55 US Bakery Items Market, by Sugar Cookies, Value, 2017-2030 (US$ Bn)
FIG. 56 US Bakery Items Market, by Snickerdoodles, Value, 2017-2030 (US$ Bn)
FIG. 57 US Bakery Items Market, by Oatmeal Raisin Cookies, Value, 2017-2030 (US$ Bn)
FIG. 58 US Bakery Items Market, by Peanut Butter Cookies, Value, 2017-2030 (US$ Bn)
FIG. 59 US Bakery Items Market Value Contribution, By Pies, 2022 & 2030 (Value %)
FIG. 60 US Bakery Items Market, by Fruit Pies (e.g., apple, cherry, blueberry), Value, 2017-2030 (US$ Bn)
FIG. 61 US Bakery Items Market, by Cream Pies (e.g., banana cream, coconut cream), Value, 2017-2030 (US$ Bn)
FIG. 62 US Bakery Items Market, by Custard Pies (e.g., pumpkin, sweet potato), Value, 2017-2030 (US$ Bn)
FIG. 63 US Bakery Items Market Value Contribution, By Doughnuts, 2022 & 2030 (Value %)
FIG. 64 US Bakery Items Market, by Yeast-Raised Doughnuts, Value, 2017-2030 (US$ Bn)
FIG. 65 US Bakery Items Market, by Cake Doughnuts, Value, 2017-2030 (US$ Bn)
FIG. 66 US Bakery Items Market, by Filled Doughnuts, Value, 2017-2030 (US$ Bn)
FIG. 67 US Bakery Items Market Value Contribution, By Bagels, 2022 & 2030 (Value %)
FIG. 68 US Bakery Items Market, by Plain Bagels, Value, 2017-2030 (US$ Bn)
FIG. 69 US Bakery Items Market, by Cinnamon Raisin Bagels, Value, 2017-2030 (US$ Bn)
FIG. 70 US Bakery Items Market, by Asiago Cheese Bagels, Value, 2017-2030 (US$ Bn)
FIG. 71 US Bakery Items Market Value Contribution, By Muffins, 2022 & 2030 (Value %)
FIG. 72 US Bakery Items Market, by Blueberry Muffins, Value, 2017-2030 (US$ Bn)
FIG. 73 US Bakery Items Market, by Chocolate Chip Muffins, Value, 2017-2030 (US$ Bn)
FIG. 74 US Bakery Items Market, by Banana Nut Muffins, Value, 2017-2030 (US$ Bn)
FIG. 75 US Bakery Items Market Value Contribution, By Rolls and Buns, 2022 & 2030 (Value %)
FIG. 76 US Bakery Items Market, by Dinner Rolls, Value, 2017-2030 (US$ Bn)
FIG. 77 US Bakery Items Market, by Hamburger Buns, Value, 2017-2030 (US$ Bn)
FIG. 78 US Bakery Items Market, by Hot Dog Buns, Value, 2017-2030 (US$ Bn)
FIG. 79 US Bakery Items Market, by Cinnamon Rolls, Value, 2017-2030 (US$ Bn)
FIG. 80 US Bakery Items Market Value Contribution, By Special Dietary Items, 2022 & 2030 (Value %)
FIG. 81 US Bakery Items Market, by Gluten-Free Bakery Items, Value, 2017-2030 (US$ Bn)
FIG. 82 US Bakery Items Market, by Vegan Bakery Items, Value, 2017-2030 (US$ Bn)
FIG. 83 US Bakery Items Market, by Sugar-Free Bakery Items, Value, 2017-2030 (US$ Bn)
FIG. 84 US Bakery Items Market Value Contribution, By Seasonal and Holiday Items, 2022 & 2030 (Value %)
FIG. 85 US Bakery Items Market, by Gingerbread Houses, Value, 2017-2030 (US$ Bn)
FIG. 86 US Bakery Items Market, by Fruitcakes, Value, 2017-2030 (US$ Bn)
FIG. 87 US Bakery Items Market, by Holiday Cookies, Value, 2017-2030 (US$ Bn)
FIG. 88 US Bakery Items Market Value Contribution, By Frozen Bakery Products, 2022 & 2030 (Value %)
FIG. 89 US Bakery Items Market, by Frozen Dough, Value, 2017-2030 (US$ Bn)
FIG. 90 US Bakery Items Market, by Frozen Pies and Tarts, Value, 2017-2030 (US$ Bn)
FIG. 91 US Bakery Items Market, by Frozen Croissants, Value, 2017-2030 (US$ Bn)
FIG. 92 US Bakery Items Market Value Contribution, By Café and Specialty Items, 2022 & 2030 (Value %)
FIG. 93 US Bakery Items Market, by Scones, Value, 2017-2030 (US$ Bn)
FIG. 94 US Bakery Items Market, by Quiches, Value, 2017-2030 (US$ Bn)
FIG. 95 US Bakery Items Market, by Focaccia Bread, Value, 2017-2030 (US$ Bn)
FIG. 96 US Bakery Items Market Value Contribution, By Distribution Channels, 2022 & 2030 (Value %)
FIG. 97 US Bakery Items Market, by Retail Grocery Stores, Value, 2017-2030 (US$ Bn)
FIG. 98 US Bakery Items Market, by Artisanal Bakeries, Value, 2017-2030 (US$ Bn)
FIG. 99 US Bakery Items Market, by Cafés and Coffee Shops, Value, 2017-2030 (US$ Bn)
FIG. 100 US Bakery Items Market, by Others, Value, 2017-2030 (US$ Bn)
FIG. 101 US Bakery Items Market Value Contribution, By Flavor and Ingredient Variations, 2022 & 2030 (Value %)
FIG. 102 US Bakery Items Market, by Seasonal Flavors, Value, 2017-2030 (US$ Bn)
FIG. 103 US Bakery Items Market, by Exotic Ingredients, Value, 2017-2030 (US$ Bn)

List of Tables
TABLE 1 Market Snapshot: US Bakery Items Market
TABLE 2 US Bakery Items Market: Market Drivers Impact Analysis
TABLE 3 US Bakery Items Market: Market Restraints Impact Analysis
TABLE 4 US Bakery Items Market, by Competitive Benchmarking, 2022
TABLE 5 US Bakery Items Market, by Geographical Presence Analysis, 2022
TABLE 6 US Bakery Items Market, by Key Strategies Analysis, 2022
TABLE 7 US Bakery Items Market, by White Bread, By Country, 2017-2022 (US$ Bn)
TABLE 8 US Bakery Items Market, by White Bread, By Country, 2023-2030 (US$ Bn)
TABLE 9 US Bakery Items Market, by Whole Wheat Bread, By Country, 2017-2022 (US$ Bn)
TABLE 10 US Bakery Items Market, by Whole Wheat Bread, By Country, 2023-2030 (US$ Bn)
TABLE 11 US Bakery Items Market, by Multigrain Bread, By Country, 2017-2022 (US$ Bn)
TABLE 12 US Bakery Items Market, by Multigrain Bread, By Country, 2023-2030 (US$ Bn)
TABLE 13 US Bakery Items Market, by Artisanal Bread, By Country, 2017-2022 (US$ Bn)
TABLE 14 US Bakery Items Market, by Artisanal Bread, By Country, 2023-2030 (US$ Bn)
TABLE 15 US Bakery Items Market, by Croissants, By Country, 2017-2022 (US$ Bn)
TABLE 16 US Bakery Items Market, by Croissants, By Country, 2023-2030 (US$ Bn)
TABLE 17 US Bakery Items Market, by Danish Pastries, By Country, 2017-2022 (US$ Bn)
TABLE 18 US Bakery Items Market, by Danish Pastries, By Country, 2023-2030 (US$ Bn)
TABLE 19 US Bakery Items Market, by Turnovers, By Country, 2017-2022 (US$ Bn)
TABLE 20 US Bakery Items Market, by Turnovers, By Country, 2023-2030 (US$ Bn)
TABLE 21 US Bakery Items Market, by Strudels, By Country, 2017-2022 (US$ Bn)
TABLE 22 US Bakery Items Market, by Strudels, By Country, 2023-2030 (US$ Bn)
TABLE 23 US Bakery Items Market, by Layer Cakes, By Country, 2017-2022 (US$ Bn)
TABLE 24 US Bakery Items Market, by Layer Cakes, By Country, 2023-2030 (US$ Bn)
TABLE 25 US Bakery Items Market, by Bundt Cakes, By Country, 2017-2022 (US$ Bn)
TABLE 26 US Bakery Items Market, by Bundt Cakes, By Country, 2023-2030 (US$ Bn)
TABLE 27 US Bakery Items Market, by Cupcakes, By Country, 2017-2022 (US$ Bn)
TABLE 28 US Bakery Items Market, by Cupcakes, By Country, 2023-2030 (US$ Bn)
TABLE 29 US Bakery Items Market, by Cheesecakes, By Country, 2017-2022 (US$ Bn)
TABLE 30 US Bakery Items Market, by Cheesecakes, By Country, 2023-2030 (US$ Bn)
TABLE 31 US Bakery Items Market, by Chocolate Chip Cookies, By Country, 2017-2022 (US$ Bn)
TABLE 32 US Bakery Items Market, by Chocolate Chip Cookies, By Country, 2023-2030 (US$ Bn)
TABLE 33 US Bakery Items Market, by Sugar Cookies, By Country, 2017-2022 (US$ Bn)
TABLE 34 US Bakery Items Market, by Sugar Cookies, By Country, 2023-2030 (US$ Bn)
TABLE 35 US Bakery Items Market, by Snickerdoodles, By Country, 2017-2022 (US$ Bn)
TABLE 36 US Bakery Items Market, by Snickerdoodles, By Country, 2023-2030 (US$ Bn)
TABLE 37 US Bakery Items Market, by Oatmeal Raisin Cookies, By Country, 2017-2022 (US$ Bn)
TABLE 38 US Bakery Items Market, by Oatmeal Raisin Cookies, By Country, 2023-2030 (US$ Bn)
TABLE 39 US Bakery Items Market, by Peanut Butter Cookies, By Country, 2017-2022 (US$ Bn)
TABLE 40 US Bakery Items Market, by Peanut Butter Cookies, By Country, 2023-2030 (US$ Bn)
TABLE 41 US Bakery Items Market, by Fruit Pies (e.g., apple, cherry, blueberry), By Country, 2017-2022 (US$ Bn)
TABLE 42 US Bakery Items Market, by Fruit Pies (e.g., apple, cherry, blueberry), By Country, 2023-2030 (US$ Bn)
TABLE 43 US Bakery Items Market, by Cream Pies (e.g., banana cream, coconut cream), By Country, 2017-2022 (US$ Bn)
TABLE 44 US Bakery Items Market, by Cream Pies (e.g., banana cream, coconut cream), By Country, 2023-2030 (US$ Bn)
TABLE 45 US Bakery Items Market, by Custard Pies (e.g., pumpkin, sweet potato), By Country, 2017-2022 (US$ Bn)
TABLE 46 US Bakery Items Market, by Custard Pies (e.g., pumpkin, sweet potato), By Country, 2023-2030 (US$ Bn)
TABLE 47 US Bakery Items Market, by Yeast-Raised Doughnuts, By Country, 2017-2022 (US$ Bn)
TABLE 48 US Bakery Items Market, by Yeast-Raised Doughnuts, By Country, 2023-2030 (US$ Bn)
TABLE 49 US Bakery Items Market, by Cake Doughnuts, By Country, 2017-2022 (US$ Bn)
TABLE 50 US Bakery Items Market, by Cake Doughnuts, By Country, 2023-2030 (US$ Bn)
TABLE 51 US Bakery Items Market, by Filled Doughnuts, By Country, 2017-2022 (US$ Bn)
TABLE 52 US Bakery Items Market, by Filled Doughnuts, By Country, 2023-2030 (US$ Bn)
TABLE 53 US Bakery Items Market, by Plain Bagels, By Country, 2017-2022 (US$ Bn)
TABLE 54 US Bakery Items Market, by Plain Bagels, By Country, 2023-2030 (US$ Bn)
TABLE 55 US Bakery Items Market, by Cinnamon Raisin Bagels, By Country, 2017-2022 (US$ Bn)
TABLE 56 US Bakery Items Market, by Cinnamon Raisin Bagels, By Country, 2023-2030 (US$ Bn)
TABLE 57 US Bakery Items Market, by Asiago Cheese Bagels, By Country, 2017-2022 (US$ Bn)
TABLE 58 US Bakery Items Market, by Asiago Cheese Bagels, By Country, 2023-2030 (US$ Bn)
TABLE 59 US Bakery Items Market, by Blueberry Muffins, By Country, 2017-2022 (US$ Bn)
TABLE 60 US Bakery Items Market, by Blueberry Muffins, By Country, 2023-2030 (US$ Bn)
TABLE 61 US Bakery Items Market, by Chocolate Chip Muffins, By Country, 2017-2022 (US$ Bn)
TABLE 62 US Bakery Items Market, by Chocolate Chip Muffins, By Country, 2023-2030 (US$ Bn)
TABLE 63 US Bakery Items Market, by Banana Nut Muffins, By Country, 2017-2022 (US$ Bn)
TABLE 64 US Bakery Items Market, by Banana Nut Muffins, By Country, 2023-2030 (US$ Bn)
TABLE 65 US Bakery Items Market, by Dinner Rolls, By Country, 2017-2022 (US$ Bn)
TABLE 66 US Bakery Items Market, by Dinner Rolls, By Country, 2023-2030 (US$ Bn)
TABLE 67 US Bakery Items Market, by Hamburger Buns, By Country, 2017-2022 (US$ Bn)
TABLE 68 US Bakery Items Market, by Hamburger Buns, By Country, 2023-2030 (US$ Bn)
TABLE 69 US Bakery Items Market, by Hot Dog Buns, By Country, 2017-2022 (US$ Bn)
TABLE 70 US Bakery Items Market, by Hot Dog Buns, By Country, 2023-2030 (US$ Bn)
TABLE 71 US Bakery Items Market, by Cinnamon Rolls, By Country, 2017-2022 (US$ Bn)
TABLE 72 US Bakery Items Market, by Cinnamon Rolls, By Country, 2023-2030 (US$ Bn)
TABLE 73 US Bakery Items Market, by Gluten-Free Bakery Items, By Country, 2017-2022 (US$ Bn)
TABLE 74 US Bakery Items Market, by Gluten-Free Bakery Items, By Country, 2023-2030 (US$ Bn)
TABLE 75 US Bakery Items Market, by Vegan Bakery Items, By Country, 2017-2022 (US$ Bn)
TABLE 76 US Bakery Items Market, by Vegan Bakery Items, By Country, 2023-2030 (US$ Bn)
TABLE 77 US Bakery Items Market, by Sugar-Free Bakery Items, By Country, 2017-2022 (US$ Bn)
TABLE 78 US Bakery Items Market, by Sugar-Free Bakery Items, By Country, 2023-2030 (US$ Bn)
TABLE 79 US Bakery Items Market, by Gingerbread Houses, By Country, 2017-2022 (US$ Bn)
TABLE 80 US Bakery Items Market, by Gingerbread Houses, By Country, 2023-2030 (US$ Bn)
TABLE 81 US Bakery Items Market, by Fruitcakes, By Country, 2017-2022 (US$ Bn)
TABLE 82 US Bakery Items Market, by Fruitcakes, By Country, 2023-2030 (US$ Bn)
TABLE 83 US Bakery Items Market, by Holiday Cookies, By Country, 2017-2022 (US$ Bn)
TABLE 84 US Bakery Items Market, by Holiday Cookies, By Country, 2023-2030 (US$ Bn)
TABLE 85 US Bakery Items Market, by Frozen Dough, By Country, 2017-2022 (US$ Bn)
TABLE 86 US Bakery Items Market, by Frozen Dough, By Country, 2023-2030 (US$ Bn)
TABLE 87 US Bakery Items Market, by Frozen Pies and Tarts, By Country, 2017-2022 (US$ Bn)
TABLE 88 US Bakery Items Market, by Frozen Pies and Tarts, By Country, 2023-2030 (US$ Bn)
TABLE 89 US Bakery Items Market, by Frozen Croissants, By Country, 2017-2022 (US$ Bn)
TABLE 90 US Bakery Items Market, by Frozen Croissants, By Country, 2023-2030 (US$ Bn)
TABLE 91 US Bakery Items Market, by Scones, By Country, 2017-2022 (US$ Bn)
TABLE 92 US Bakery Items Market, by Scones, By Country, 2023-2030 (US$ Bn)
TABLE 93 US Bakery Items Market, by Quiches, By Country, 2017-2022 (US$ Bn)
TABLE 94 US Bakery Items Market, by Quiches, By Country, 2023-2030 (US$ Bn)
TABLE 95 US Bakery Items Market, by Focaccia Bread, By Country, 2017-2022 (US$ Bn)
TABLE 96 US Bakery Items Market, by Focaccia Bread, By Country, 2023-2030 (US$ Bn)
TABLE 97 US Bakery Items Market, by Retail Grocery Stores, By Country, 2017-2022 (US$ Bn)
TABLE 98 US Bakery Items Market, by Retail Grocery Stores, By Country, 2023-2030 (US$ Bn)
TABLE 99 US Bakery Items Market, by Artisanal Bakeries, By Country, 2017-2022 (US$ Bn)
TABLE 100 US Bakery Items Market, by Artisanal Bakeries, By Country, 2023-2030 (US$ Bn)
TABLE 101 US Bakery Items Market, by Cafés and Coffee Shops, By Country, 2017-2022 (US$ Bn)
TABLE 102 US Bakery Items Market, by Cafés and Coffee Shops, By Country, 2023-2030 (US$ Bn)
TABLE 103 US Bakery Items Market, by Others, By Country, 2017-2022 (US$ Bn)
TABLE 104 US Bakery Items Market, by Others, By Country, 2023-2030 (US$ Bn)
TABLE 105 US Bakery Items Market, by Seasonal Flavors, By Country, 2017-2022 (US$ Bn)
TABLE 106 US Bakery Items Market, by Seasonal Flavors, By Country, 2023-2030 (US$ Bn)
TABLE 107 US Bakery Items Market, by Exotic Ingredients, By Country, 2017-2022 (US$ Bn)
TABLE 108 US Bakery Items Market, by Exotic Ingredients, By Country, 2023-2030 (US$ Bn)
TABLE 109 US Bakery Items Market, by Bread, 2017-2022 (US$ Bn)
TABLE 110 US Bakery Items Market, by Bread, 2023-2030 (US$ Bn)
TABLE 111 US Bakery Items Market, by Pastries, 2017-2022 (US$ Bn)
TABLE 112 US Bakery Items Market, by Pastries, 2023-2030 (US$ Bn)
TABLE 113 US Bakery Items Market, by Cakes, 2017-2022 (US$ Bn)
TABLE 114 US Bakery Items Market, by Cakes, 2023-2030 (US$ Bn)
TABLE 115 US Bakery Items Market, by Cookies, 2017-2022 (US$ Bn)
TABLE 116 US Bakery Items Market, by Cookies, 2023-2030 (US$ Bn)
TABLE 117 US Bakery Items Market, by Pies, 2017-2022 (US$ Bn)
TABLE 118 US Bakery Items Market, by Pies, 2023-2030 (US$ Bn)
TABLE 119 US Bakery Items Market, by Doughnuts, 2017-2022 (US$ Bn)
TABLE 120 US Bakery Items Market, by Doughnuts, 2023-2030 (US$ Bn)
TABLE 121 US Bakery Items Market, by Bagels, 2017-2022 (US$ Bn)
TABLE 122 US Bakery Items Market, by Bagels, 2023-2030 (US$ Bn)
TABLE 123 US Bakery Items Market, by Muffins, 2017-2022 (US$ Bn)
TABLE 124 US Bakery Items Market, by Muffins, 2023-2030 (US$ Bn)
TABLE 125 US Bakery Items Market, by Rolls and Buns, 2017-2022 (US$ Bn)
TABLE 126 US Bakery Items Market, by Rolls and Buns, 2023-2030 (US$ Bn)
TABLE 127 US Bakery Items Market, by Special Dietary Items, 2017-2022 (US$ Bn)
TABLE 128 US Bakery Items Market, by Special Dietary Items, 2023-2030 (US$ Bn)
TABLE 129 US Bakery Items Market, by Seasonal and Holiday Items, 2017-2022 (US$ Bn)
TABLE 130 US Bakery Items Market, by Seasonal and Holiday Items, 2023-2030 (US$ Bn)
TABLE 131 US Bakery Items Market, by Frozen Bakery Products, 2017-2022 (US$ Bn)
TABLE 132 US Bakery Items Market, by Frozen Bakery Products, 2023-2030 (US$ Bn)
TABLE 133 US Bakery Items Market, by Café and Specialty Items, 2017-2022 (US$ Bn)
TABLE 134 US Bakery Items Market, by Café and Specialty Items, 2023-2030 (US$ Bn)
TABLE 135 US Bakery Items Market, by Distribution Channels, 2017-2022 (US$ Bn)
TABLE 136 US Bakery Items Market, by Distribution Channels, 2023-2030 (US$ Bn)
TABLE 137 US Bakery Items Market, by Flavor and Ingredient Variations, 2017-2022 (US$ Bn)
TABLE 138 US Bakery Items Market, by Flavor and Ingredient Variations, 2023-2030 (US$ Bn)

What is the current size of the US bakery items market?

The US bakery items market was valued at USD 72.5 Billion in 2022.

What is the expected growth rate of the US bakery items market between 2023 and 2030?

The US bakery items market is expected to grow at a CAGR of 2.2% between 2023 and 2030, reaching USD 86.28 Billion in 2030.

Which segment is leading the market share in terms of frozen bakery products?

Frozen dough is the leading segment, holding over 36% share in value in 2022.

Which distribution channel segment governs the US demand for bakery items?

The retail grocery stores segment governs the US demand for bakery items, holding a massive share of over 34% in 2022.

Which bread segment will post the highest CAGR in the forecast period?

The multigrain bread segment will post the highest CAGR in the projection period.

Who are the major players in the US bakery items market?

The top players include Mondelez International Inc., Kellogg Company, Hostess Brands Inc., Campbell Soup Company, Gruma SAB de CV, General Mills Inc., Grupo Bimbo SAB De CV, Alpha Baking Co. Inc., Sara Lee Frozen Bakery, Flowers Foods Inc, and Others.

What are the major market drivers of the US bakery items industry?

The major market drivers of the US bakery items industry include evolving consumer preferences, culinary innovation, and the cultural significance of bakery products.

What are the major market restraints of the US bakery items industry?

The major market restraints of the US bakery items industry include rising ingredient and production costs, health dietary concerns, and increasing competition within the market.

What are the major market opportunities of the US bakery items industry?

The major market opportunities of the US bakery items industry encompass e-commerce and digital presence, as well as sustainability and ethical practices to align with changing consumer values.

Breakfast Cereals Market

Published:
Report ID: 3282

UK Gluten Free Products Market

Published:
Report ID: 30545

India Pet Food Market

Published:
Report ID: 36785

Biostimulants Market

Published:
Report ID: 1671

Aloe Vera Extracts Market

Published:
Report ID: 11979

Sugar Alcohol Market

Published:
Report ID: 37467

Algae Oil Market

Published:
Report ID: 1288

Matcha Tea Market

Published:
Report ID: 37133

Natural Flavors Market

Published:
Report ID: 14378

Oat Milk Market

Published:
Report ID: 37052

Processed Meat Market

Published:
Report ID: 11443

Dill Juice Market

Published:
Report ID: 5087

Purchase Options

$999
Delivery Format: Excel.
$1999
Designed for the individual purchaser.
$2999
Users located at a single corporate site or regional office.
$3999
Allowed for unlimited sharing globally within one company.
Smallform of Sample request

Have a question?

User Profile

Don’t settle for less – trust Mitul to help you find the best solution.

Report delivery within 24 to 48 hours

– Other Info –

What people say?-

User Review

I am very impressed with the information in this report. The author clearly did their research when they came up with this product and it has already given me a lot of ideas.

Jana Schmidt
CEDAR CX Technologies

– Connect with us –

Phone

+91 6232 49 3207


support

24/7 Research Support


sales@credenceresearch.com

– Research Methodology –

Going beyond the basics: advanced techniques in research methodology

– Trusted By –

Pepshi, LG, Nestle
Motorola, Honeywell, Johnson and johnson
LG Chem, SIEMENS, Pfizer
Unilever, Samsonite, QIAGEN