
Market overview
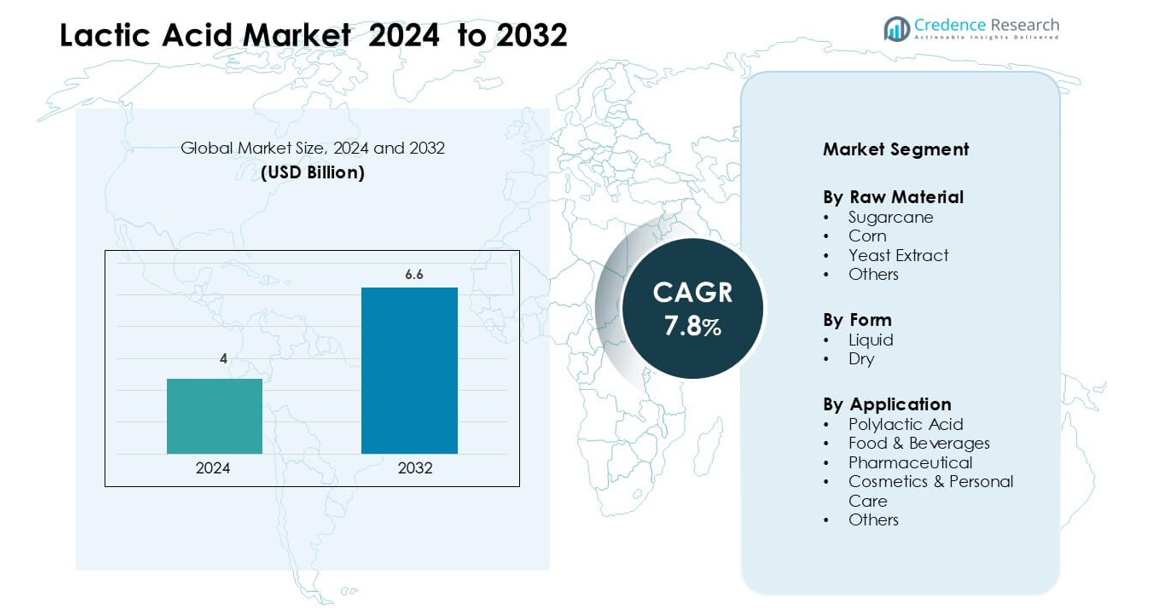
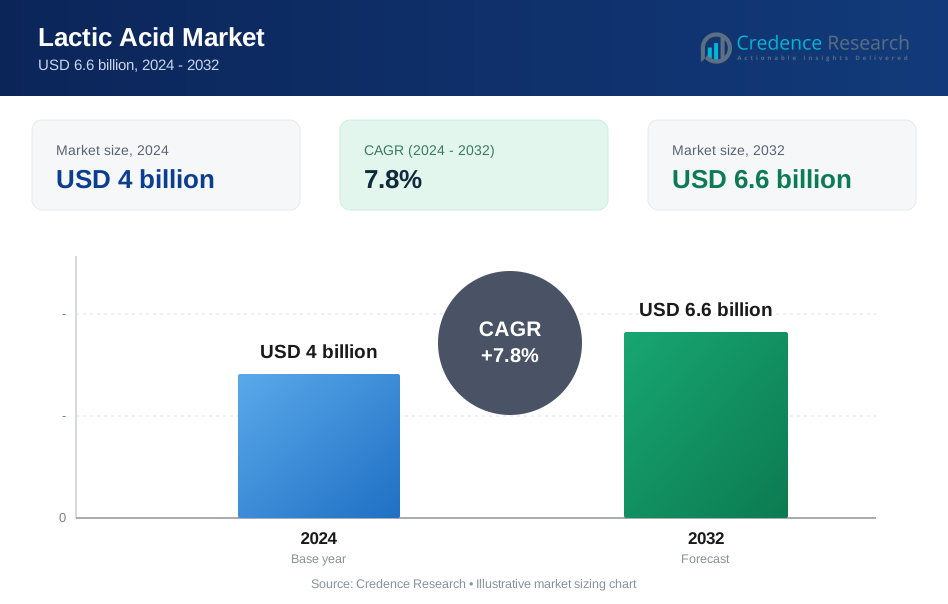
Lactic Acid Market was valued at USD 4 billion in 2024 and is anticipated to reach USD 6.6 billion by 2032, growing at a CAGR of 7.8 % during the forecast period.
| REPORT ATTRIBUTE | DETAILS |
|---|---|
| Historical Period | 2020-2023 |
| Base Year | 2024 |
| Forecast Period | 2025-2032 |
| Lactic Acid Market Size 2024 | USD 4 billion |
| Lactic Acid Market, CAGR | 7.8% |
| Lactic Acid Market Size 2032 | USD 6.6 billion |
The Lactic Acid Market is shaped by major producers such as Corbion, NatureWorks LLC, BASF SE, Cargill Incorporated, Galactic, Henan Jindan Lactic Acid Technology, Sulzer Ltd, GODAVARI BioRefineries Ltd., CELLULAC, and Kemin Industries. These companies compete through advancements in fermentation efficiency, expansion of high-purity grades, and integrated supply chains supported by sugarcane and corn feedstocks. Many players continue to scale production for PLA, driven by strong demand from packaging and consumer goods. Asia-Pacific leads the global market with a 26% share, supported by abundant agricultural resources, strong industrial growth, and rapid expansion of bioplastic manufacturing across major economies.
Market Insights
- The Lactic Acid Market reached USD 4 billion in 2024 and is projected to grow at a CAGR of 7.8 % through the forecast period.
- Strong demand from bioplastics, especially PLA, drives consumption, with the PLA segment holding a 38% share due to rising adoption in packaging and disposable products.
- Clean-label food trends, natural preservatives, and growth in cosmetics create steady expansion, while technologies that improve fermentation yield and reduce energy use continue shaping industry trends.
- Competition remains intense as firms like Corbion, NatureWorks, BASF, and Cargill expand capacity and secure feedstock supply, while new entrants focus on cost-efficient fermentation pathways.
- Asia-Pacific leads with a 26% regional share, followed by North America at 35%; liquid lactic acid dominates the form segment with a 55% share, supported by broad use in food and beverage processing.
Market Segmentation Analysis
By Raw Material
Sugarcane leads the Lactic Acid Market with a 46% share, driven by its high fermentation efficiency and strong availability in major producing countries. Manufacturers prefer sugarcane due to its stable supply chain and lower impurity levels, which support large-scale production. Growing adoption of bio-based inputs in bioplastics and food processing strengthens demand. Corn follows as a key option for regions with strong starch industries. Yeast extract and other sources serve niche uses in specialty formulations but show slower growth due to higher production costs and limited yield efficiency.
- For instance, the integrated NatureWorks facility at Cargill's Blair campus in Nebraska produces over 180,000 metric tons (400 million pounds) of lactic acid per year from corn-derived glucose, which is then converted into approximately 150,000 metric tons (330 million pounds) of Ingeo PLA resin annually.
By Form
Liquid lactic acid holds a 55% share, making it the dominant form due to wide use in food preservation, pH regulation, and beverage acidification. The liquid format offers better solubility and ease of mixing, which supports strong adoption across dairy, bakery, and drinks. Growth in natural preservatives accelerates demand. Dry lactic acid gains traction in pharmaceuticals and cosmetics because of its longer shelf life and easier transport, but its adoption remains lower as many large-scale food and PLA processors continue to prefer the liquid variant for processing efficiency.
- For instance, Corbion operated an existing lactic acid facility in Thailand at the Rayong site.
By Application
Polylactic Acid (PLA) is the dominant application with a 38% share, supported by rising bioplastic production for packaging, textiles, and disposable goods. Strong regulatory pressure to reduce petroleum-based plastics boosts PLA demand. Food and beverages remain a major consumer due to lactic acid’s role in flavor enhancement and shelf-life improvement. Pharmaceuticals use lactic acid in drug formulations and infusion solutions, while cosmetics rely on it for exfoliation and pH adjustment. Other applications grow modestly, driven by industrial cleaners and chemical intermediates but remain smaller compared to PLA and food processing.
Key Growth Drivers
Growing Demand for Biodegradable Plastics
Rising demand for biodegradable plastics drives strong growth in the Lactic Acid Market, mainly because brands shift toward sustainable packaging and reduce fossil-based materials. Many countries enforce rules that limit single-use plastics, which pushes firms toward PLA made from lactic acid and strengthens long-term demand across food packaging, consumer goods, and textile fibers. Major manufacturers expand PLA plants to meet higher orders, and this expansion creates steady raw material needs, stable contracts, and faster capacity growth for lactic-acid producers worldwide.
- For instance, NatureWorks currently operates one commercial-scale production facility in the U.S. (Blair, Nebraska) which has a nameplate capacity of 150,000 metric tons annually.
Expansion of Clean-Label and Natural Food Products
Global consumers pick food with natural additives, which supports rising use of lactic acid as a safe acidulant and preservative. Food makers prefer lactic acid because the ingredient improves taste, controls microbes, and meets clean-label rules across major regions. Growing sales of dairy, bakery, and ready meals increase demand for natural acidity control, and this trend encourages large processors to replace synthetic acids, producing a consistent rise in food-grade lactic-acid orders across several product lines.
- For instance, ADM is a major player in the global nutrition and biosolutions market and is involved in the lactic acid market, which is used in food, beverages, and other applications, including for clean-label initiatives.
Rising Pharmaceutical and Personal-Care Applications
Drug makers and skincare brands use lactic acid for pH control, exfoliation, and controlled-release systems, which increases demand for pharmaceutical and cosmetic grades. New product launches in topical treatments and medicated cleansers strengthen adoption, especially in markets shifting toward gentle and clinically supported ingredients. Strong growth in dermatology and higher spending on premium skincare raise long-term consumption, and these changes encourage producers to expand high-purity grades for regulated medical and cosmetic use.
Key Trends and Opportunities
Shift Toward Renewable Feedstocks
Lactic-acid producers invest in renewable feedstocks like sugarcane and corn because brands demand low-carbon materials and governments support bio-based chemicals. This trend increases supply stability, lowers dependence on petroleum sources, and supports wider use in bioplastics, food, and medical products. Many firms scale fermentation efficiency and reduce waste, creating lower production costs and stronger commercial feasibility for large-volume buyers across packaging and consumer goods.
- For instance, Corbion, through its joint venture TotalEnergies Corbion, does operate a lactic acid and PLA plant in Rayong, Thailand, which uses sugarcane as its primary renewable, non-GMO feedstock.
Advancement in Fermentation and Production Technologies
New fermentation systems improve yield, cut energy use, and increase purity, which helps suppliers meet rising industrial demand. Automation, continuous processing, and improved microorganism strains reduce batch time and enhance scalability. These improvements allow cheaper PLA production, faster food-grade output, and better quality, helping firms win contracts in regulated sectors where consistency and safety standards remain strict.
- For instance, Fed-batch fermentation is a common, effective technique for producing high concentrations of lactic acid (LA) by avoiding substrate or product inhibition.
Key Challenges
Volatility in Raw Material Supply
Fluctuating supply of corn and sugarcane challenges producers because weather events, farming issues, and trade limits affect crop output. These changes create unstable pricing for fermentation feedstocks and raise production costs for processors. Market players must manage supply risks through contracts and sourcing strategies, but shortages still increase pressure on profit margins for both small and large manufacturers.
High Production and Purification Costs
Lactic-acid production needs-controlled fermentation, strict hygiene, and advanced purification steps, which increase capital and operating costs. High-purity grades for PLA, pharmaceuticals, and cosmetics require costly equipment and quality checks that reduce profit flexibility. Smaller firms face barriers when entering regulated markets, and this challenge slows market expansion in regions with limited industrial infrastructure.
Regional Analysis
North America
The North American region dominated the global lactic acid market in 2024 with a share of approximately 35 %. Growth was driven by strong demand in pharmaceuticals, food, and personal-care sectors. The U.S. benefits from abundant corn feedstock and supportive regulations for bio-based chemicals. Increasing adoption of bioplastics particularly Polylactic Acid (PLA) — further reinforced regional leadership by pushing manufacturers to expand lactic acid production for biodegradable packaging and specialty applications.
Europe
Europe held about 20 % of the lactic acid market in 2024. Growth stemmed from strict EU regulations promoting biodegradable materials and the strong cosmetics and food-processing industries in Germany, France, and the UK. Local manufacturers expanded capacity to serve packaging, personal care, and food sectors, while feedstock sources like sugar beet and corn supported regional production efficiency. Challenges included feedstock cost volatility and competitiveness from Asia-Pacific producers.
Asia-Pacific
The Asia-Pacific region accounted for around 26 % of the global lactic acid market in 2024. Rapid industrialisation, urbanisation, and rising consumer spending in China, India, and Japan boosted demand across food, cosmetics, and packaging applications. Abundant agricultural feedstocks like sugarcane and cassava enabled cost-effective production. Investment by global bioplastic players further strengthened regional capabilities, making Asia-Pacific a key growth hub for both lactic acid and PLA.
Latin America
Latin America, though smaller than the major regions, is growing steadily and focused on the cosmetics and personal-care sectors, especially in Brazil and Argentina. Rising consumer incomes and expanding FMCG manufacturing created rising demand for lactic acid in skincare and food applications. The regional market remains somewhat hindered by limited large-scale production and feedstock supply chains, but favourable demographics and investment potential make it an attractive growth area for non-food applications.
Middle East & Africa
The Middle East & Africa region shows promising growth in the lactic acid market, particularly in upscale cosmetic and personal-care applications in the U.A.E., Saudi Arabia and Kuwait. A young population and increasing demand for premium skincare products drive regional uptake. However, the region’s share remains relatively modest compared to other regions due to limited domestic manufacturing and a dependence on imports. Infrastructure improvements and entry of global bioplastic supply chains may boost future growth.
Market Segmentations
By Raw Material
- Sugarcane
- Corn
- Yeast Extract
- Others
By Form
- Liquid
- Dry
By Application
- Polylactic Acid
- Food & Beverages
- Pharmaceutical
- Cosmetics & Personal Care
- Others
By Geography
- North America
- U.S.
- Canada
- Mexico
- Europe
- Germany
- France
- U.K.
- Italy
- Spain
- Rest of Europe
- Asia Pacific
- China
- Japan
- India
- South Korea
- South-east Asia
- Rest of Asia Pacific
- Latin America
- Brazil
- Argentina
- Rest of Latin America
- Middle East & Africa
- GCC Countries
- South Africa
- Rest of the Middle East and Africa
Competitive Landscape
The competitive landscape of the Lactic Acid Market features a mix of global chemical companies, biotechnology firms, and specialized fermentation-based producers that expand capacity to meet rising demand from bioplastics, food, pharmaceuticals, and cosmetics. Leading players such as Corbion, NatureWorks, BASF SE, Cargill, Galactic, and Henan Jindan Lactic Acid Technology focus on improving fermentation efficiency, scaling high-purity grades, and strengthening backward integration with sugarcane or corn feedstocks. Many companies invest in dedicated PLA production lines to support the global shift toward biodegradable packaging. Strategic partnerships, technology licensing, and regional expansions remain core strategies for strengthening market footprints and reducing supply-chain risks. Firms also compete on sustainability metrics by lowering energy use and carbon intensity, which increases their appeal to packaging and FMCG brands. Continuous innovation, strong certifications, and reliable raw-material sourcing help top players maintain long-term commercial advantage in this rapidly evolving bio-based chemicals market.
Key Player Analysis
- Galactic (Belgium)
- Cargill, Incorporated (U.S.)
- CELLULAC (U.K.)
- Henan Jindan Lactic Acid Technology Co. Ltd (Netherlands)
- BASF SE (Germany)
- GODAVARI BIOREFINERIES LTD. (India)
- NatureWorks LLC (U.S.)
- Kemin Industries, Inc. (U.S.)
- Sulzer Ltd (Switzerland)
- Corbion (Netherlands)
Recent Developments
- In May 2025, Galactic and its sister company Futerro announced a partnership to build a new lactic acid derivatives unit at Port-Jérôme-sur-Seine in Normandy, France. The Galactic plant will convert part of Futerro’s lactic acid into high-value derivatives and green solvents for agri-food and green chemistry markets, reinforcing a EUR 500 million integrated PLA and lactic-acid biorefinery project.
- In February 2024, Cargill, Incorporated (U.S.) A market report highlighted Cargill’s development of a new low-pH tolerant yeast biocatalyst that cuts raw material use and gypsum waste in lactic acid fermentation. This process innovation improves production efficiency and lowers environmental impact, supporting Cargill’s competitiveness in the global lactic acid market.
Report Coverage
The research report offers an in-depth analysis based on Raw Material, Form, Application and Geography. It details leading market players, providing an overview of their business, product offerings, investments, revenue streams, and key applications. Additionally, the report includes insights into the competitive environment, SWOT analysis, current market trends, as well as the primary drivers and constraints. Furthermore, it discusses various factors that have driven market expansion in recent years. The report also explores market dynamics, regulatory scenarios, and technological advancements that are shaping the industry. It assesses the impact of external factors and global economic changes on market growth. Lastly, it provides strategic recommendations for new entrants and established companies to navigate the complexities of the market.
Future Outlook
- Demand for PLA-based bioplastics will rise as regulations move toward sustainable packaging.
- Producers will expand fermentation capacity to meet higher industrial and food-grade demand.
- Adoption of clean-label ingredients will strengthen lactic acid use in global food processing.
- Cosmetic and skincare brands will increase uptake due to steady demand for mild exfoliants.
- Pharmaceutical applications will grow as high-purity grades become more available.
- Technological upgrades will improve yield, energy efficiency, and overall production stability.
- Companies will invest in bio-based feedstocks to reduce carbon footprints and supply risks.
- Asia-Pacific will attract more bioplastic investments due to strong feedstock access.
- Strategic partnerships and agreements will expand global distribution networks.
- R&D for next-generation PLA compounds will broaden lactic acid’s role in advanced materials.
Request a Free Sample
Fill in your details and we'll send you a free sample report.
- Sample data tables & charts
- Research methodology
Need a Custom Version of This Report?
Tailor the scope, geography, or segments to your exact requirements.
- Custom geography or segment scope
- Direct access to our analyst team
Frequently Asked Questions
What is the current market size for Lactic Acid Market, and what is its projected size in 2032?
At what Compound Annual Growth Rate is Lactic Acid Market projected to grow between 2025 and 2032?
What are the primary factors fueling the growth of Lactic Acid Market?
What are the most important elements driving the growth in the lactic acid marketplace?
What are the different forms of lactic acid available inside the market?
Which industries are the major consumers of lactic acid?
What are the key regions driving the lactic acid marketplace?
What are the challenges confronted via the lactic acid market?
How does the lactic acid marketplace make contributions to sustainability?
What are the current trends inside the lactic acid marketplace?
What are the major corporations operating within the lactic acid market?
What is the future outlook for the lactic acid marketplace?
Who are the leading companies in Lactic Acid Market?
Table of Content
Chapter 1. Report Introduction
- 1.1 Report Description & Purpose
- 1.1.1 Report Title & Market Definition
- 1.1.2 Unique Selling Propositions (USP) & Key Differentiators
- 1.1.3 Value Proposition for Stakeholders
- 1.2 Research Objectives
- 1.2.1 Market Sizing Objectives (Volume & Revenue)
- 1.2.2 Segmentation Objectives
- 1.2.3 Competitive Intelligence Objectives
- 1.2.4 Forecast & Scenario Objectives
- 1.3 Report Scope
- 1.3.1 Lactic Acid Scope – Types & Subtypes Covered
- 1.3.2 Geographic Scope – Regions & Countries Covered
- 1.3.3 Historical Period, Base Year & Forecast Period (2024; forecast to 2032)
- 1.3.4 Inclusions & Exclusions
- 1.4 HS Code & Classification Framework
- 1.5 Currency, Units & Pricing Basis
- 1.6 Target Stakeholders
- 1.7 Limitations & Assumptions
Chapter 2. Executive Summary
- 2.1 Global Lactic Acid Market Snapshot
- 2.1.1 Market Size – Historical (2024) & Forecast (2024-2032) (2024: USD 4 billion → 2032: USD 6.6 billion)
- 2.1.2 Volume & Revenue – Global Totals
- 2.1.3 Key Market Highlights – Top Five Facts
- 2.2 Lactic Acid Market Segmentation Snapshot
- 2.2.1 Market Split by Region – 2024 vs. 2032
- 2.3 Competitive Snapshot
- 2.3.1 Top 10 Players by Revenue Share – 2024
- 2.3.2 Top 10 Players by Volume Share – 2024
- 2.3.3 Recent Strategic Developments (18-Month Summary)
- 2.4 Key Investment Highlights & Strategic Conclusions
Chapter 3. Lactic Acid Market Dynamics & Industry Analysis
- 3.1 Market Overview & Context
- 3.1.1 Lactic Acid Market Position in the Broader Automotive Value Chain
- 3.1.2 OEM vs. Replacement Market Dynamics
- 3.1.3 Market Maturity & Development Stage by Region
- 3.2 Lactic Acid Market Drivers
- 3.3 Lactic Acid Market Restraints & Challenges
- 3.4 Lactic Acid Market Opportunities
- 3.5 Porter's Five Forces Analysis
- 3.5.1 Threat of New Entrants
- 3.5.2 Bargaining Power of Suppliers
- 3.5.3 Bargaining Power of Buyers
- 3.5.4 Threat of Substitutes
- 3.5.5 Competitive Rivalry – Intensity Assessment
- 3.6 Lactic Acid Value Chain Analysis
- 3.6.1 Upstream – Raw Material/Input Suppliers
- 3.6.1.1 Raw Material/Input 1
- 3.6.1.2 Raw Material/Input 2
- 3.6.1.3 Raw Material/Input 3
- 3.6.2 Midstream – Production/Manufacturing/Service Delivery
- 3.6.2.1 Production/Process Overview
- 3.6.2.2 Key Facility Locations & Capacity by Manufacturer
- 3.6.3 Downstream – Distribution & End Consumer
- 3.6.3.1 Primary Channel – B2B/OEM
- 3.6.3.2 Secondary Channels – Dealer, Retail, Online, Direct
- 3.6.4 Value Chain Profitability Analysis
- 3.6.1 Upstream – Raw Material/Input Suppliers
- 3.7 PESTEL Analysis
- 3.7.1 Political Factors
- 3.7.2 Economic Factors
- 3.7.3 Social Factors
- 3.7.4 Technological Factors
- 3.7.5 Environmental Factors
- 3.7.6 Legal Factors
- 3.8 Lactic Acid Supply Chain Analysis
- 3.8.1 Raw Material/Input Supply Risk Assessment
- 3.8.2 Manufacturing Concentration Risk (Geographic Exposure)
- 3.8.3 Trade Disruption Impact Analysis
- 3.9 Regulatory & Policy Landscape
Note: The regulatory and policy landscape section covers regulations based on their applicability to the market, Lactic Acid category, geography, and scope of the study. Only regulatory frameworks with a material impact on operations, compliance, trade, sustainability, or market access are analyzed in detail.
Chapter 4. Key Investment Pockets & Opportunity Analysis
- 4.1 Lactic Acid Market Attractiveness Analysis
- 4.1.1 By Region – Investment Attractiveness Matrix (Volume × CAGR)
- 4.2 Absolute Revenue Growth Opportunity
- 4.2.1 By Region – Absolute USD Growth Through 2032
- 4.3 Incremental Volume Opportunity
- 4.3.1 By Region – Incremental Volume Through 2032
- 4.3.2 Segment – Incremental Volume
- 4.4 Emerging Submarket Opportunity Deep Dive (Subject to Applicability)
- 4.5 Emerging Market Opportunity Scorecards
- 4.5.1 United States
- 4.5.2 Europe
- 4.5.3 Asia
- 4.5.4 Middle East & Africa
Note: Emerging Market Opportunity Scorecards will be included based on relevance and strategic importance. Regions listed are indicative and may vary depending on data availability and market dynamics.
Chapter 5. Lactic Acid Import-Export Analysis & Trade Flows
- 5.1 Global Trade Overview
- 5.1.1 Global Export Value by Country (2024)
- 5.1.2 Global Export Volume by Country (2024)
- 5.1.3 Global Import Value by Country (2024)
- 5.1.4 Global Import Volume by Country (2024)
- 5.1.5 Net Trade Balance by Country (2024)
- 5.2 Export Analysis – Segment
- 5.2.1 Type 1 (HS Code)
- 5.2.2 Type 2 (HS Code)
- 5.2.3 Type 3 (HS Code)
- 5.2.4 Type 4 (HS Code)
- 5.2.5 Type 5 (HS Code)
- 5.3 Import Analysis – Segment
- 5.3.1 Type 1 (HS Code)
- 5.3.2 Type 2 (HS Code)
- 5.3.3 Type 3 (HS Code)
- 5.3.4 Type 4 (HS Code)
- 5.3.5 Type 5 (HS Code)
- 5.4 Average Unit Trade Prices
- 5.4.1 Average Export Price – Segment & Country
- 5.4.2 Average Import Price – Segment & Source Country
- 5.4.3 Price Trends (2024)
- 5.5 Key Trade Route Analysis
- 5.5.1 Trade Route 1
- 5.5.2 Trade Route 2
- 5.5.3 Trade Route 3
- 5.5.4 Trade Route 4
- 5.5.5 Trade Route 5
- 5.6 Trade Policy Impact Assessment
- 5.6.1 US Anti-Dumping & Section 301 Tariffs
- 5.6.2 EU Customs Union Impact
- 5.6.3 Major Free Trade Agreements
- 5.6.4 USMCA Rules of Origin
Note: Trade policy analysis will be included only where relevant to the Lactic Acid market.
Chapter 6. Competitive Landscape & Company Benchmarking
- 6.1 Lactic Acid Market Concentration & Structure
- 6.1.1 Herfindahl-Hirschman Index (HHI) – vs. 2024
- 6.1.2 Tier 1, Tier 2 & Tier 3 Market Structure
- 6.1.3 Global, Regional & Local Player Dynamics
- 6.2 Lactic Acid Market Share Analysis – 2024
- 6.2.1 Global Revenue Share by Company
- 6.2.2 Global Volume Share by Company
- 6.2.3 Regional Revenue Share
- 6.2.4 Market Share Evolution ( vs. 2024)
- 6.2.5 OEM Segment Share by Company
- 6.2.6 Replacement Segment Share by Company
- 6.3 Production/Delivery Capacity & Facility Analysis
- 6.3.1 Global Installed Capacity
- 6.3.2 Capacity Utilization Rates
- 6.3.3 Production/Output Volume
- 6.3.4 Facility Locations & Capacity Map
- 6.3.5 Planned Capacity Additions
- 6.4 Lactic Acid Competitive Benchmarking Matrix
- 6.4.1 Revenue, Volume, CAGR & Profitability Comparison
- 6.4.2 Channel Revenue Mix
- 6.4.3 Geographic Revenue Exposure
- 6.4.4 R&D Intensity
- 6.4.5 Sustainability Maturity
- 6.5 Strategic Developments in Lactic Acid (Last 24 Months)
- 6.5.1 Mergers, Acquisitions & Divestments
- 6.5.2 New Lactic Acid Launches
- 6.5.3 Facility Expansions
- 6.5.4 Strategic Alliances, Joint Ventures & Partnerships
- 6.5.5 Distribution Expansion & Market Entry
- 6.5.6 Sustainability & ESG Initiatives
- 6.6 Competitive Strategy Mapping
- 6.6.1 Leader, Challenger, Follower & Niche Classification
- 6.6.2 Pricing Strategy Comparison
- 6.6.3 Channel Strategy Matrix
Note: Strategic developments are included based on their materiality and the availability of reliable information.
Chapter 7. Global Lactic Acid Market – By Distribution Channel
- 7.1 Segment Overview
- 7.1.1 Volume & Revenue Split by Channel (2024 & 2032)
- 7.1.2 Channel Mix Evolution (2024-2032)
Chapter 8. Regional Market Analysis – Global Overview
- 8.1 Global Regional Overview
- 8.1.1 Regional Volume Share
- 8.1.2 Regional Revenue Share
- 8.1.3 Regional Volume by Region
- 8.1.4 Regional Revenue by Region
- 8.1.5 Regional Forecast Through 2032
- 8.2 Cross-Regional Segment Analysis
- 8.2.1 By Distribution Channel
- 8.2.2 By Brand/Price Tier
Chapter 9. North America Lactic Acid Market
- 9.1 United States
- 9.2 Canada
- 9.3 Mexico
Chapter 10. Europe Lactic Acid Market
- 10.1 Germany
- 10.2 France
- 10.3 Italy
- 10.4 United Kingdom
- 10.5 Spain
- 10.6 Poland
- 10.7 Russia
- 10.8 Netherlands
- 10.9 Belgium
- 10.10 Sweden
- 10.11 Denmark
- 10.12 Norway
- 10.13 Rest of Europe
Chapter 11. Asia Pacific Lactic Acid Market
- 11.1 China
- 11.2 India
- 11.3 Japan
- 11.4 South Korea
- 11.5 Thailand
- 11.6 Indonesia
- 11.7 Vietnam
- 11.8 Malaysia
- 11.9 Australia
- 11.10 Rest of Asia Pacific
Chapter 12. Latin America Lactic Acid Market
- 12.1 Brazil
- 12.2 Argentina
- 12.3 Colombia
- 12.4 Chile
- 12.5 Rest of Latin America
Chapter 13. Middle East Lactic Acid Market
- 13.1 Saudi Arabia
- 13.2 United Arab Emirates
- 13.3 Turkey
- 13.4 Israel
- 13.5 Iran
- 13.6 Rest of the Middle East
Chapter 14. Africa Lactic Acid Market
- 14.1 South Africa
- 14.2 Egypt
- 14.3 Nigeria
- 14.4 Morocco
- 14.5 Rest of Africa
Chapter 15. Lactic Acid Company Profiles
- 15.1 [Company 01]
- 15.1.1 Company Overview
- 15.1.2 Key Management Personnel
- 15.1.3 Products & Services Portfolio
- 15.1.4 Financial Performance
- 15.1.5 Key Market Focus & Geographic Presence
- 15.1.6 Recent Developments & Strategic Initiatives
Note: The company profile list is preliminary and may change based on research findings, market developments, data availability, and client requirements.
Chapter 16. Appendices
- Appendix A – List of Abbreviations & Acronyms
- Appendix B – Industry Classification Code Reference – Full Series
- Appendix C – Production & Capacity Data Tables
- Appendix D – End-Use & Demand Base Tables
- Appendix E – Consumption & Replacement Rate Assumptions
- Appendix F – ASP Reference Tables
- Appendix G – Manufacturing & Facility Database
- Appendix H – Import-Export Data Tables
- Appendix I – Regulatory Summary Tables
- Appendix J – Primary Research Participant List (Anonymized)
- Appendix K – Primary Research Questionnaire Framework
- Appendix L – Data Sources & Bibliography
- Appendix M – Market Size Divergence & Source Comparison
Chapter 17. Research Methodology
- 17.1 Research Framework & Philosophy
- 17.2 Secondary Research – Sources, Hierarchy & Data Extraction
- 17.3 Data Modeling – Bottom-Up & Top-Down Market Sizing
- 17.4 Primary Research – Stakeholder Framework, LOI & Sample Sizes
- 17.5 Forecast Methodology – Regression, Scenario & Sensitivity Analysis
- 17.6 Quality Control – Four-Layer Validation Framework
- 17.7 Limitations & Standard Assumptions
- 17.8 Disclaimer
