Market Overview
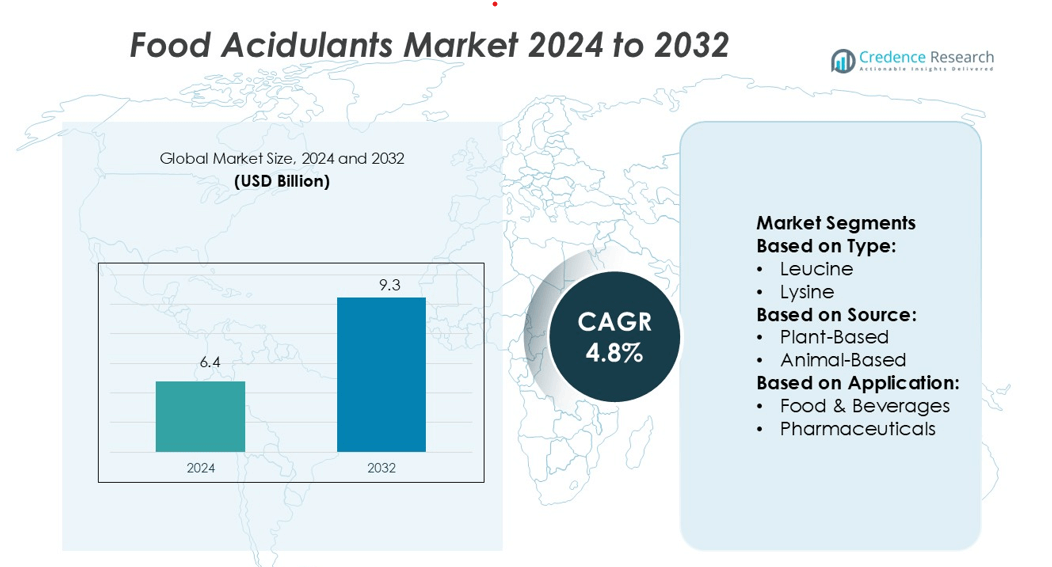
Food Acidulants Market size was valued USD 6.4 billion in 2024 and is anticipated to reach USD 9.3 billion by 2032, at a CAGR of 4.8% during the forecast period.
| REPORT ATTRIBUTE | DETAILS |
|---|---|
| Historical Period | 2020-2023 |
| Base Year | 2024 |
| Forecast Period | 2025-2032 |
| Food Acidulants MarketSize 2024 | USD 6.4 billion |
| Food Acidulants Market, CAGR | 4.8% |
| Food Acidulants Market Size 2032 | USD 9.3 billion |
The food acidulants market is dominated by key players such as Parchem Trading, ADM, Jungbunzlauer Suisse, Brenntag, Bartek Ingredients, Purac Biochem, Tate & Lyle, Caremoli, Cargill, and Univar Inc. These companies focus on expanding product portfolios, strengthening global distribution, and advancing sustainable production technologies to meet rising demand from food and beverage manufacturers. Asia Pacific leads the market with a 34% share, supported by rapid urbanization, strong raw material availability, and growing consumption of processed and functional foods. Strategic collaborations, capacity expansions, and investment in fermentation-based technologies are enabling top players to enhance competitiveness and strengthen their global market positions.
Market Insights
- The Food Acidulants Market was valued at USD 6.4 billion in 2024 and is expected to reach USD 9.3 billion by 2032, growing at a CAGR of 4.8%.
- Rising demand for processed and functional foods is driving acidulant usage across beverages, bakery, and confectionery segments.
- Companies are focusing on sustainable production methods, fermentation technologies, and strategic partnerships to strengthen market positions.
- Volatility in raw material prices and strict regulatory requirements remain key restraints affecting smaller producers.
- Asia Pacific leads the market with a 34% share, supported by strong food processing industries, while the food and beverage segment dominates overall application demand with the largest market share.
Market Segmentation Analysis:
By Type
Essential amino acids hold the dominant position in the food acidulants market with a 41% share. Leucine, lysine, and methionine are widely used to improve protein content and enhance flavor stability in food and beverage formulations. Their strong nutritional profile supports their inclusion in fortified and functional food products. Rising consumer demand for protein-enriched diets and health supplements drives this segment’s growth. Non-essential and conditional essential amino acids are also gaining attention, but essential amino acids lead due to their high application in sports nutrition, dietary supplements, and functional beverages.
- For instance, ADM operates a large amino acid production facility in Decatur, Illinois. The company announced a plan to expand the facility to produce up to 340,000 metric tons of lysine or threonine annually, primarily for animal feed applications.
By Source
Plant-based sources account for 44% of the market share, making them the leading segment. Growing consumer preference for clean-label and sustainable ingredients is fueling demand for amino acids derived from soy, corn, and other plant proteins. This trend is further strengthened by increasing adoption of vegan and vegetarian diets. Animal-based sources continue to serve pharmaceutical and specialty nutrition applications, while synthetic or bio-engineered sources are advancing through fermentation technologies. Cost efficiency and better scalability are also making plant-based production a preferred choice for manufacturers.
- For instance, Jungbunzlauer’s Port Colborne facility handles a maximum corn throughput of 1,651 tonnes per day for conversion into acids, citrate salts, glucose syrup, and derivatives.
By Application
The food and beverages segment dominates with a 49% share of the total market. Acidulants are widely used in this segment to enhance flavor, stabilize pH, and extend product shelf life. Their use is particularly strong in soft drinks, confectionery, bakery, and processed foods. Rising demand for functional and fortified products boosts the integration of amino acid-based acidulants in these applications. Pharmaceuticals follow closely, driven by their use in dietary supplements and medicinal formulations. The cosmetics and animal feed industries represent emerging growth areas for specialized formulations.
Key Growth Drivers
Rising Demand for Processed and Convenience Foods
The increasing consumption of processed and packaged foods is a major growth driver for the food acidulants market. Acidulants enhance flavor, improve texture, and extend shelf life in a wide range of food products such as beverages, bakery, confectionery, and ready-to-eat meals. Rising urbanization and changing consumer lifestyles are fueling this demand. Food manufacturers are integrating acidulants to meet quality and safety standards while improving product stability. This shift supports steady volume growth across global markets, especially in emerging economies with expanding middle-class populations.
- For instance, Brenntag operates 32 Food & Nutrition Innovation & Application Centers globally, which assist customers in developing acidulant formulations tailored to processed foods.
Expansion of Functional and Fortified Food Products
The rising popularity of functional and fortified foods is driving higher adoption of acidulants in product formulations. These compounds help maintain pH levels and preserve the stability of vitamins, minerals, and active ingredients. Growing health awareness has increased demand for low-sugar and high-protein products where acidulants play a critical role in flavor balancing. Companies are introducing innovative formulations targeting digestive health, immunity, and energy support. This trend is strengthening acidulant use in dairy alternatives, sports drinks, and nutraceutical products across major global regions.
- For instance, Bartek added a 22,000 metric-ton/year maleic anhydride reactor to its existing three reactors, expanding its finishing capacity for acidulant derivatives.
Stringent Food Safety and Quality Regulations
Stricter food safety regulations are encouraging manufacturers to use acidulants as natural preservatives and flavor stabilizers. Compliance with standards such as FDA and EFSA guidelines requires the use of approved acidulants to extend shelf life without compromising safety. The clean-label movement is further accelerating demand for citric acid, lactic acid, and other natural acidulants. Producers are investing in quality assurance and controlled processing to meet evolving regulatory frameworks. This factor plays a key role in driving product standardization and wider industry adoption.
Key Trends & Opportunities
Shift Toward Natural and Plant-Based Ingredients
A growing consumer preference for clean-label and natural ingredients is shaping the food acidulants market. Plant-based acidulants derived from citrus fruits, fermentation, and sugar beets are gaining traction. Brands are reformulating products to replace synthetic additives with natural acidulants to enhance brand trust and meet regulatory expectations. This shift aligns with sustainability goals and rising vegan product launches. The trend is especially strong in North America and Europe, where consumer awareness and purchasing power support premium, plant-based food products.
- For instance, Purac (under Corbion) produces L-lactic acid via fermentation with carbohydrate feedstocks, delivering product purity up to 99.8 % (w/w) in their top, high-purity grades.
Expansion in Functional Beverage Applications
Functional beverages are becoming a major application area for acidulants due to their role in pH control and flavor enhancement. Sports drinks, energy beverages, and fortified juices require stable acidic conditions to maintain freshness and nutrient integrity. This growing demand creates opportunities for ingredient suppliers to introduce customized acidulant blends. Technological advancements in fermentation are improving acidulant purity and cost efficiency, making them more attractive to large beverage producers globally. This expansion supports long-term market growth and innovation.
- For instance, Caremoli’s CareGuar product (guar gum) is recommended for usage rates between 0.2 % and 2.0 %. It delivers high viscosity under standard conditions (cold hydration, neutral pH), which is a characteristic of food-grade guar gum.
Technological Advancements in Fermentation and Bio-Engineering
Advances in fermentation technology are improving the efficiency and scalability of acidulant production. Bio-engineered acidulants offer higher purity, consistent quality, and cost-effective large-scale manufacturing. This trend supports sustainable sourcing and reduces reliance on petrochemical-derived ingredients. Companies are increasingly investing in R&D to develop new strains and processes that lower environmental impact. This opportunity allows manufacturers to align with clean-label regulations while expanding into high-growth food and nutraceutical segments.
Key Challenges
Volatility in Raw Material Prices
Fluctuating costs of raw materials such as sugar, citrus, and starch pose a major challenge for acidulant producers. Price volatility affects production costs and profit margins, especially for small and mid-sized companies. Weather disruptions, agricultural supply constraints, and trade restrictions further complicate procurement. These fluctuations can lead to inconsistent pricing strategies for end products, reducing market competitiveness. Manufacturers are seeking more stable sourcing models and alternative fermentation-based production methods to minimize exposure to raw material price risks.
Stringent Compliance and Approval Procedures
Regulatory compliance and approval procedures for food additives remain complex and time-consuming. Different regions have varying standards for acidulant use, labeling, and safety assessments. Meeting these requirements often delays product launches and increases operational costs. Small manufacturers face additional pressure due to limited resources for regulatory approvals. Continuous updates to international food safety guidelines also require regular product reformulation and documentation. These challenges can slow innovation and limit market entry for new players, affecting overall market growth.
Regional Analysis
North America
North America holds a 31% share of the global food acidulants market. The region benefits from strong demand for processed foods, functional beverages, and fortified nutrition products. Major food manufacturers in the U.S. and Canada are integrating natural acidulants like citric and lactic acid to meet clean-label preferences. Regulatory frameworks from the FDA and CFIA promote the use of safe and approved additives, ensuring steady product adoption. Rising health awareness and growth in ready-to-drink beverages also strengthen regional consumption. Investments in advanced fermentation technologies support domestic production and reduce dependence on imports.
Europe
Europe accounts for 27% of the global food acidulants market. The region is driven by strong clean-label trends, strict EU food safety regulations, and a mature processed food industry. Countries like Germany, France, and the U.K. are key consumers due to high demand for natural and plant-based ingredients. Acidulants are widely used in beverages, bakery, and dairy alternatives, supported by innovation in sustainable sourcing. The presence of leading ingredient manufacturers enhances product availability and quality. Ongoing regulatory alignment and a focus on eco-friendly formulations contribute to stable market expansion across the region.
Asia Pacific
Asia Pacific leads the market with a 34% share, making it the largest regional segment. Rapid urbanization, growing disposable incomes, and increased demand for convenience foods drive market growth. China, India, and Japan are major contributors due to expanding food processing industries and rising beverage consumption. The region also benefits from a strong raw material base and low production costs. Acidulants are widely used in carbonated drinks, confectionery, and snacks. Local producers and multinational firms are investing in fermentation-based production to meet demand sustainably. Favorable government policies further boost regional manufacturing capacity.
Latin America
Latin America represents 5% of the global food acidulants market. The region is experiencing gradual growth due to expanding food and beverage industries in Brazil, Mexico, and Argentina. Rising urbanization and increasing consumer preference for packaged food products support acidulant adoption. Citric acid dominates usage because of its cost-effectiveness and versatility. Regional manufacturers are focusing on modernizing production processes to enhance efficiency. Although regulatory frameworks are less strict compared to Europe, improving food safety standards are driving more structured usage. Growing investment in local ingredient processing supports market penetration and export potential.
Middle East & Africa
The Middle East & Africa holds a 3% share of the global food acidulants market. Market growth is supported by increasing consumption of processed beverages, confectionery, and bakery products. The UAE, Saudi Arabia, and South Africa are key markets due to their expanding food processing industries. Import reliance remains high, but investments in local production facilities are increasing. Citric and phosphoric acid are widely used for flavor enhancement and preservation. Rising health awareness and regulatory alignment with global food safety standards are improving product quality and market acceptance in this region.
Market Segmentations:
By Type:
- Leucine
- Lysine
By Source:
- Plant-Based
- Animal-Based
By Application:
- Food & Beverages
- Pharmaceuticals
By Geography
- North America
- U.S.
- Canada
- Mexico
- Europe
- Germany
- France
- U.K.
- Italy
- Spain
- Rest of Europe
- Asia Pacific
- China
- Japan
- India
- South Korea
- South-east Asia
- Rest of Asia Pacific
- Latin America
- Brazil
- Argentina
- Rest of Latin America
- Middle East & Africa
- GCC Countries
- South Africa
- Rest of the Middle East and Africa
Competitive Landscape
The food acidulants market features strong competition among leading players including Parchem Trading, ADM, Jungbunzlauer Suisse, Brenntag, Bartek Ingredients, Purac Biochem, Tate & Lyle, Caremoli, Cargill, and Univar Inc. The food acidulants market is characterized by high competition, product innovation, and strong supply chain integration. Companies are focusing on expanding production capacity and adopting sustainable manufacturing practices to meet growing demand for natural and clean-label ingredients. Strategic initiatives such as mergers, acquisitions, and partnerships with food and beverage producers are helping strengthen market presence. Advanced fermentation and bio-engineering technologies are improving product purity, cost efficiency, and scalability. Global players are also enhancing their distribution networks to reach emerging markets. These competitive strategies are shaping pricing structures, driving technological advancements, and reinforcing the industry’s long-term growth trajectory.
Key Player Analysis
- Parchem Trading
- ADM
- Jungbunzlauer Suisse
- Brenntag
- Bartek Ingredients
- Purac Biochem
- Tate & Lyle
- Caremoli
- Cargill
- Univar Inc
Recent Developments
- In May 2025, Caitlyn India Pvt Ltd (CIPL) unveiled plans for a Rs 400 crore investment to set up a phosphoric acid plant in India, targeting an annual output of 50,000 tonnes. This initiative seeks to curtail import reliance and enhance the nation's fertiliser self-sufficiency. Strategically located in a port-accessible industrial zone in southern India, the plant will harness hemihydrate–dihydrate (HH-DH) technology, ensuring high-purity phosphoric acid and cleaner gypsum by-products.
- In December 2024, Tate and Lyle have entered into a partnership with BioHarvest Sciences to leverage Botanical Synthesis technology for the development of next-generation plant-based ingredients, focusing on sustainable sweeteners and acidulants that optimize land and water usage.
- In November 2024, INEOS Acetyls and Gujarat Narmada Valley Fertilizers & Chemicals Ltd (GNFC) inked an MoU, eyeing the feasibility of establishing a 600kt acetic acid plant at GNFC's Bharuch site in Gujarat, India.
- In October 2024, Evonik announced it is restructuring its keto and pharma amino acid business to focus on strategic core growth areas within its Health Care division. The company plans to discontinue keto acid Production in Hanau, Germany by the end of 2025, while exploring strategic options like partnerships or divestments for its sites in Ham (France) and Wuming (China)
Report Coverage
The research report offers an in-depth analysis based on Type, Source, Application and Geography. It details leading market players, providing an overview of their business, product offerings, investments, revenue streams, and key applications. Additionally, the report includes insights into the competitive environment, SWOT analysis, current market trends, as well as the primary drivers and constraints. Furthermore, it discusses various factors that have driven market expansion in recent years. The report also explores market dynamics, regulatory scenarios, and technological advancements that are shaping the industry. It assesses the impact of external factors and global economic changes on market growth. Lastly, it provides strategic recommendations for new entrants and established companies to navigate the complexities of the market.
Future Outlook
- Demand for natural and plant-based acidulants will continue to grow steadily.
- Clean-label and sustainable ingredient sourcing will drive product innovation.
- Functional beverages will remain a major application segment for acidulants.
- Fermentation and bio-engineering technologies will enhance production efficiency.
- Regulatory compliance will shape product formulation and market entry strategies.
- Companies will expand regional manufacturing to reduce import dependence.
- Strategic partnerships with food producers will strengthen supply chains.
- Growth in fortified and functional foods will boost acidulant usage.
- Investments in R&D will support the development of high-purity acidulants.
- Emerging markets will offer significant opportunities for market expansion.

Request a Free Sample
Fill in your details and we'll send you a free sample report.
- Sample data tables & charts
- Research methodology
Need a Custom Version of This Report?
Tailor the scope, geography, or segments to your exact requirements.
- Custom geography or segment scope
- Direct access to our analyst team
Frequently Asked Questions
What is the current market size for the Food Acidulants Market, and what is its projected size in 2032?
At what Compound Annual Growth Rate is the Food Acidulants Market projected to grow between 2025 and 2032?
Which Food Acidulants Market segment held the largest share in 2024?
What are the primary factors fueling the growth of the Food Acidulants Market?
Who are the leading companies in the Food Acidulants Market?
Table of Content
Chapter 1 Market Segmentation
- 1.1 Segmentation Framework
- 1.1.1 Product and Service Classification
- 1.1.2 Application and End-Use Classification
- 1.1.3 Technology and Solution Classification
- 1.1.4 Customer and Distribution Channel Classification
- 1.1.5 Geographic Segmentation
- 1.1.6 Market Segment Definitions and Boundaries
Chapter 2 Introduction
- 2.1 Report Objectives and Scope
- 2.2 Product Definition and Industry Terminology
- 2.3 Market Inclusions and Exclusions
- 2.4 Research Process
- 2.4.1 Primary Research and Expert Interviews
- 2.4.2 Secondary Research and Source Review
- 2.4.3 Top-Down and Bottom-Up Estimation
- 2.4.4 Data Triangulation and Verification
- 2.5 Market Size Measurement Basis
- 2.5.1 2024: USD 6.4 billion → 2032: USD 9.3 billion
- 2.6 Historical and Forecast Reference Periods
- 2.6.1 Base Year: 2024
- 2.6.2 Forecast Period: 2024-2032
- 2.7 Research Assumptions and Limitations
Chapter 3 Executive Summary
- 3.1 Market Snapshot and Key Findings
- 3.2 Base-Year Market Size, 2024
- 3.3 Forecast Market Size, 2032
- 3.4 Revenue and Volume Growth Outlook
- 3.5 Key Demand and Supply Indicators
- 3.6 Leading Market Segments
- 3.7 Fastest-Growing Market Opportunities
- 3.8 Regional Performance Highlights
- 3.9 Technology and Industry Transformation
- 3.10 Competitive Landscape Summary
- 3.11 Analyst View and Strategic Implications
Chapter 4 Global Food Acidulants Market Trends and Developments
- 4.1 Historical Industry Development
- 4.2 Recent Market Trends and Developments
- 4.3 Demand and Customer Behavior Trends
- 4.4 Technology and Product Innovation
- 4.5 Artificial Intelligence, Automation and Digitalization
- 4.6 Local Manufacturing and Supply Chain Realignment
- 4.7 Industry Partnerships, Mergers and Acquisitions
- 4.8 Sustainability and Circular Economy Developments
- 4.9 Government and Private Sector Investment Trends
- 4.10 Emerging Business Models and Commercialization
- 4.11 Industry Developments and Announcements
Chapter 5 Global Food Acidulants Market Production, Supply and Demand Analysis
- 5.1 Demand Trend and Consumption Analysis
- 5.2 Demand Forecast, 2024-2032
- 5.3 Production and Output Trend
- 5.4 Production and Output Forecast, 2024-2032
- 5.5 Installed Capacity and Capacity Utilization
- 5.6 Company-Wise Production Plants and Statistics
- 5.6.1 Installed Production Capacity
- 5.6.2 Actual Production
- 5.6.3 Planned Capacity and Expansion Targets
- 5.7 Supply Chain Structure and Procurement Trends
- 5.8 Supply-Demand Gap and Bottlenecks
- 5.9 Import Dependence and Sourcing Structure
- 5.10 Contract Manufacturing and Outsourcing
- 5.11 Regional Supply and Demand Concentration
Chapter 6 Global Food Acidulants Market Pricing Analysis
- 6.1 Pricing Structure and Measurement
- 6.2 Historical Pricing Trends
- 6.3 Pricing Outlook, 2024-2032
- 6.4 Average Selling Price and Unit Economics
- 6.5 Pricing by Product and Market Segment
- 6.6 Geographic Pricing Differences
- 6.7 Key Input, Energy, Labor and Logistics Costs
- 6.8 Contract Pricing and Purchasing Models
- 6.9 Pricing Sensitivity and Competitive Positioning
- 6.10 Price, Margin and Profitability Implications
Chapter 7 Global Food Acidulants Market Dynamics
- 7.1 Market Growth Drivers
- 7.1.1 Demand-Side Drivers
- 7.1.2 Technology and Innovation Drivers
- 7.1.3 Infrastructure and Investment Drivers
- 7.1.4 Regulatory and Policy Drivers
- 7.2 Market Restraints
- 7.2.1 Cost and Affordability Constraints
- 7.2.2 Technology and Adoption Barriers
- 7.2.3 Supply Chain and Operational Constraints
- 7.3 Market Challenges
- 7.3.1 Competitive Pressure and Margin Erosion
- 7.3.2 Skills, Infrastructure and Implementation Gaps
- 7.4 Emerging Market Opportunities
- 7.5 Market Dynamics Impact and Time-Horizon Assessment
Chapter 8 Global Food Acidulants Value Chain Analysis
- 8.1 Industry Value Chain Overview
- 8.2 Upstream Suppliers and Critical Inputs
- 8.3 Technology and Component Providers
- 8.4 Manufacturing or Service Delivery
- 8.5 Distribution, Channel Partners and Integrators
- 8.6 Downstream Applications and End Users
- 8.7 Value Addition and Profit Pools
- 8.8 Vertical Integration and Outsourcing
- 8.9 Supplier Concentration and Risk
- 8.10 Supply Chain Localization and Resilience
Chapter 9 Global Food Acidulants Market Regulations and Policies
- 9.1 Relevant Laws, Standards and Compliance Frameworks
- 9.2 Product, Service, Safety and Quality Requirements
- 9.3 Government Policies, Incentives and Subsidies
- 9.4 Imports, Exports and Trade Barriers
- 9.5 Public Procurement and Local Content Requirements
- 9.6 Environmental and Sustainability Compliance
- 9.7 Upcoming Policy Changes and Market Implications
Chapter 10 Global Food Acidulants Market Hotspots and Opportunities
- 10.1 Market Opportunity Mapping and Growth Hotspots
- 10.2 High-Growth Applications and Customer Groups
- 10.3 Underserved Markets and White-Space Opportunities
- 10.4 Emerging Technology and Product Opportunities
- 10.5 New Capacity and Investment Hotspots
- 10.6 Market Entry and Expansion Opportunities
- 10.7 Distribution and Partnership Opportunities
- 10.8 Near-Term and Long-Term Commercial Potential
- 10.9 Opportunity Attractiveness and Execution Risks
Chapter 11 Global Food Acidulants Market Outlook, 2024-2032
- 11.1 Market Size and Analysis
- 11.1.1 Revenue (Market Measurement: 2024: USD 6.4 billion → 2032: USD 9.3 billion)
- 11.1.2 Market Volume and Quantity Sold
- 11.1.3 Historical Market Size
- 11.1.4 Base-Year Market Size, 2024
- 11.2 Market Forecast, 2024-2032
- 11.2.1 Revenue Forecast to 2032
- 11.2.2 Volume Forecast to 2032
- 11.2.3 CAGR and Year-on-Year Growth
- 11.2.4 Incremental Revenue Opportunity
- 11.3 Forecast Assumptions and Scenario Analysis
- 11.3.1 Base-Case Forecast
- 11.3.2 Optimistic and Conservative Scenarios
- 11.3.3 Technology, Pricing and Policy Sensitivities
- 11.4 Market Attractiveness and Growth Outlook
Chapter 12 Global Food Acidulants Market Segmentation and Outlook
- 12.1 Segmentation Summary and Market Shares, 2024
- 12.2 Largest and Fastest-Growing Segments
- 12.3 Segment Growth Comparison
- 12.4 Segment Attractiveness and Priority Matrix
Chapter 13 Global Food Acidulants Geographic Market Outlook, 2024-2032
- 13.1 Regional Market Size and Share, 2024
- 13.2 Regional Market Forecast, 2024-2032
- 13.3 Regional Pricing, Production and Demand Differences
- 13.4 North America
- 13.4.1 United States
- 13.4.2 Canada
- 13.4.3 Mexico
- 13.5 Europe
- 13.5.1 Germany
- 13.5.2 France
- 13.5.3 Italy
- 13.5.4 United Kingdom
- 13.5.5 Spain
- 13.5.6 Poland
- 13.5.7 Russia
- 13.5.8 Netherlands
- 13.5.9 Belgium
- 13.5.10 Sweden
- 13.5.11 Denmark
- 13.5.12 Norway
- 13.5.13 Rest of Europe
- 13.6 Asia Pacific
- 13.6.1 China
- 13.6.2 India
- 13.6.3 Japan
- 13.6.4 South Korea
- 13.6.5 Thailand
- 13.6.6 Indonesia
- 13.6.7 Vietnam
- 13.6.8 Malaysia
- 13.6.9 Australia
- 13.6.10 Rest of Asia Pacific
- 13.7 Latin America
- 13.7.1 Brazil
- 13.7.2 Argentina
- 13.7.3 Colombia
- 13.7.4 Chile
- 13.7.5 Rest of Latin America
- 13.8 Middle East
- 13.8.1 Saudi Arabia
- 13.8.2 United Arab Emirates
- 13.8.3 Turkey
- 13.8.4 Israel
- 13.8.5 Iran
- 13.8.6 Rest of the Middle East
- 13.9 Africa
- 13.9.1 South Africa
- 13.9.2 Egypt
- 13.9.3 Nigeria
- 13.9.4 Morocco
- 13.9.5 Rest of Africa
- 13.10 Regional Investment, Policy and Supply Chain Differences
- 13.11 Regional Competitive Landscape
- 13.12 Geographic Growth Hotspots
Chapter 14 Global Food Acidulants Technology, Innovation and Sustainability Outlook
- 14.1 Technology Landscape and Maturity
- 14.2 Product, Process and Service Innovation
- 14.3 AI, Automation and Digital Tools in the Industry
- 14.4 Technology Adoption and Performance Benchmarking
- 14.5 Innovation Pipeline and R&D Investment
- 14.6 Patent and Intellectual Property Trends
- 14.7 Energy Efficiency and Resource Management
- 14.8 Sustainability, Recycling and Circularity
- 14.9 Technology Roadmap, 2024-2032
- 14.10 Risks of Obsolescence and Technology Substitution
Chapter 15 Global Food Acidulants Market Key Strategic Imperatives
- 15.1 Growth and Market Entry Priorities
- 15.2 High-Return Products and Segments
- 15.3 Pricing, Profitability and Cost Optimization
- 15.4 Technology Investment and Product Differentiation
- 15.5 Supply Chain Localization and Resilience
- 15.6 Distribution and Customer Acquisition
- 15.7 Partnership, Acquisition and Capacity Strategy
- 15.8 Regional Expansion Priorities
- 15.9 Short-, Medium- and Long-Term Actions
Chapter 16 Competition Outlook
- 16.1 Industry Competition Characteristics
- 16.2 Market Structure and Concentration
- 16.3 Market Share and Competitive Positioning, 2024
- 16.4 Company-Wise Revenue and Product Benchmarking
- 16.5 Production and Service Capacity Benchmarking
- 16.6 Technology, Pricing and Differentiation
- 16.7 Regional Footprint and Distribution Strength
- 16.8 Mergers, Acquisitions and Strategic Alliances
- 16.9 New Entrants and Competitive Threats
- 16.10 Porter's Five Forces and Industry Attractiveness
- 16.11 Competitive Outlook, 2024-2032
Chapter 17 Company Profiles
- 17.1 Company Coverage and Selection Criteria
- 17.2 Leading Market Participants – Standard Profile Structure
- 17.2.1 Business Description
- 17.2.2 Company Ownership and Geographic Presence
- 17.2.3 Product and Service Portfolio
- 17.2.4 Manufacturing and Operating Footprint
- 17.2.5 Production Capacity and Expansion Plans
- 17.2.6 Financial Performance and Investment
- 17.2.7 Market Share and Competitive Position
- 17.2.8 Technology and Innovation Capabilities
- 17.2.9 Strategic Alliances or Partnerships
- 17.2.10 Recent Developments
- 17.2.11 Growth Strategy and Outlook
- 17.3 Other Relevant Market Participants
Note: Every listed company is profiled on the structure shown under the first company. The company list is preliminary and may change based on research findings, market developments, data availability and client requirements.
Chapter 18 Disclaimer
- 18.1 Research and Forecast Disclaimer
- 18.2 Data Source and Estimation Limitations
Note: The depth of individual sections depends on data availability for this market. Volume, capacity, trade and other unit-based metrics are included where applicable.