
Market Overview:
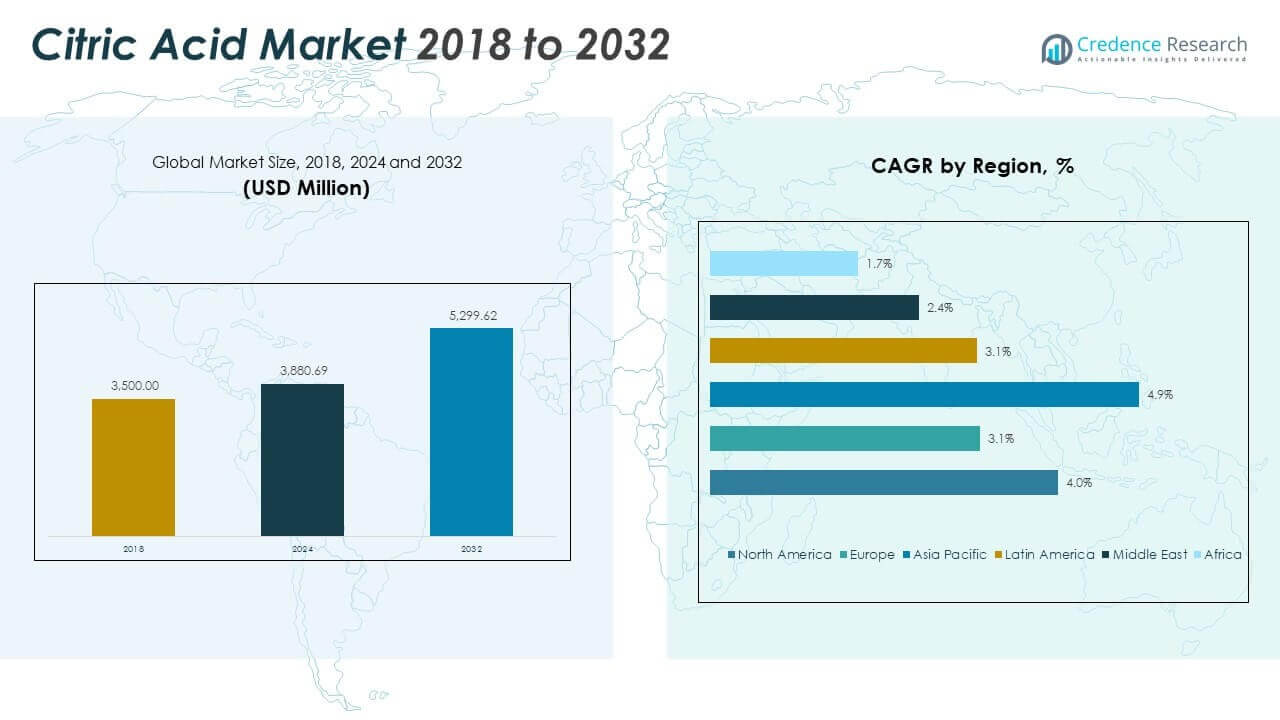
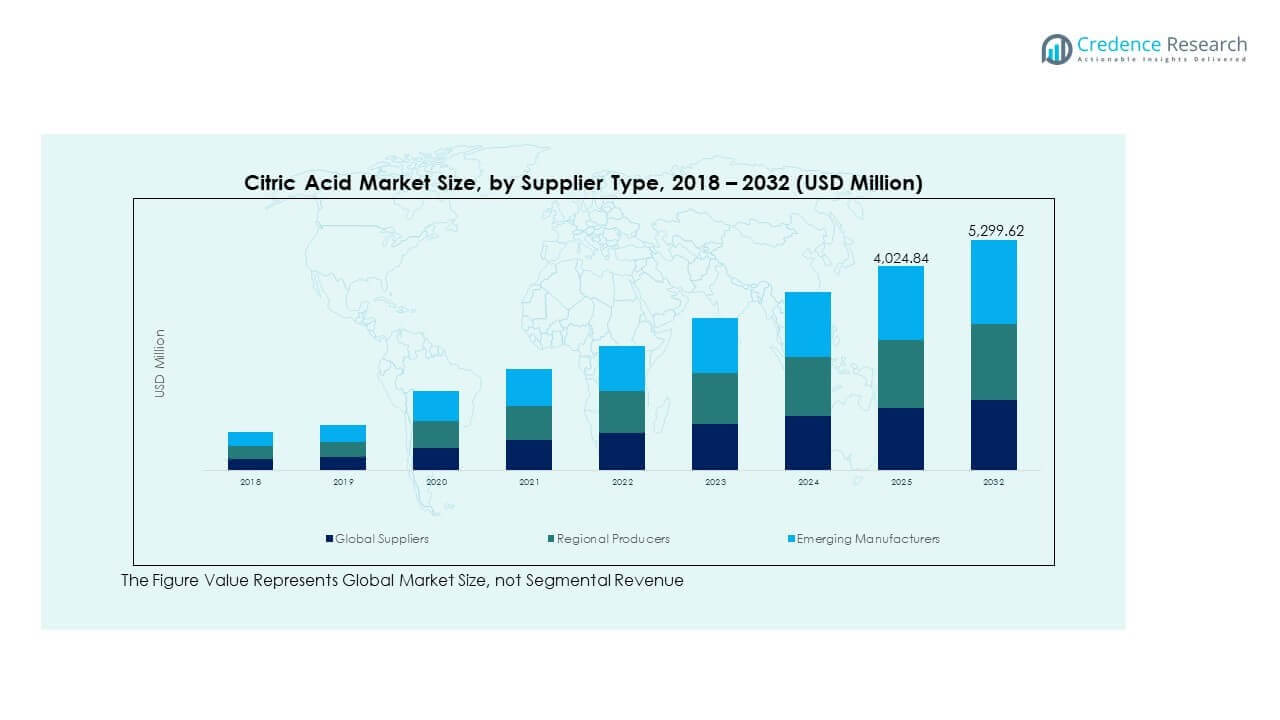
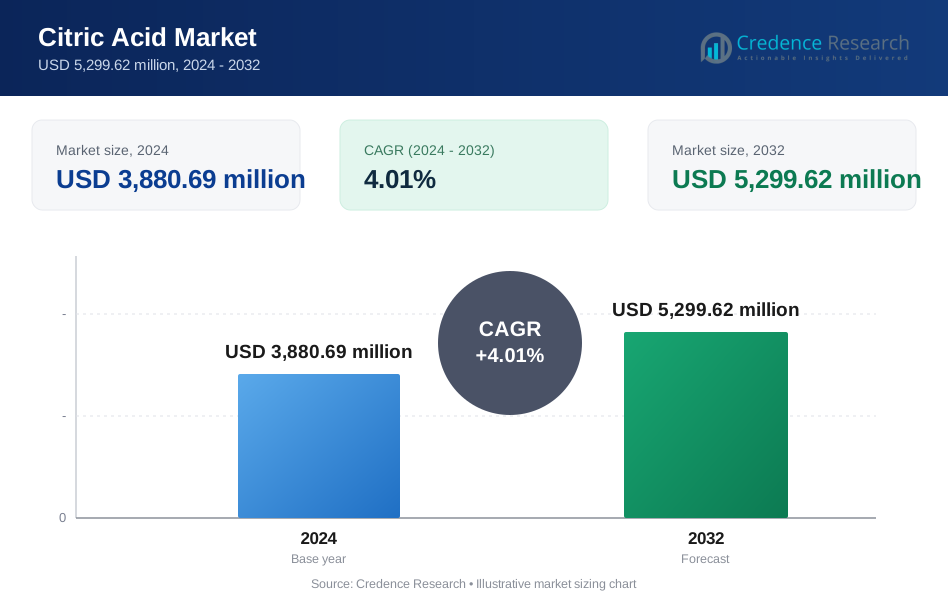
The Citric Acid Market size was valued at USD 3,500.00 million in 2018 to USD 3,880.69 million in 2024 and is anticipated to reach USD 5,299.62 million by 2032, at a CAGR of 4.01% during the forecast period.
| REPORT ATTRIBUTE | DETAILS |
|---|---|
| Historical Period | 2020-2023 |
| Base Year | 2024 |
| Forecast Period | 2025-2032 |
| Citric Acid Market Size 2024 | USD 3,880.69 Million |
| Citric Acid Market, CAGR | 4.01% |
| Citric Acid Market Size 2032 | USD 5,299.62 Million |
Strong demand from food, beverage, and pharmaceutical sectors drives the growth of the citric acid market. It is widely used as a preservative, pH adjuster, and flavor enhancer in packaged foods and carbonated drinks. Rising consumption of ready-to-eat products and health supplements increases application volumes. Non-GMO and clean-label product trends strengthen the market’s momentum. Pharmaceutical manufacturers rely on citric acid in effervescent tablets and liquid formulations. Its role in household cleaning products also supports broader use. Producers expand capacity to meet the growing demand from multiple industries. Regulatory support for natural acidulants reinforces market expansion.
Asia Pacific leads the market due to high consumption and large-scale manufacturing hubs in China and India. North America follows with strong demand from processed food and pharmaceutical industries. Europe holds a stable share supported by green cleaning and organic cosmetic applications. Latin America and the Middle East show moderate growth driven by population expansion and rising packaged goods consumption. Africa remains an emerging market with increasing adoption in food and beverage processing. Each region reflects distinct regulatory and industrial dynamics shaping growth patterns.
Market Insights:
- The Citric Acid Market was valued at USD 3,500.00 million in 2018, reached USD 3,880.69 million in 2024, and is projected to reach USD 5,299.62 million by 2032, growing at a CAGR of 4.01%.
- Asia Pacific holds the largest market share at 35.2%, driven by strong demand from food, beverage, and pharmaceutical industries in China and India.
- North America follows with a 32% share, supported by high adoption in clean-label foods and pharmaceutical excipients, while Europe ranks third with a 20.5% share, led by natural ingredient demand and green cleaning trends.
- Asia Pacific is the fastest-growing region at 4.9% CAGR, fueled by industrial scale, rising population, and expanding health supplement markets.
- Segment-wise, food & beverage applications account for over 45% of demand due to preservative and flavoring roles, while anhydrous citric acid dominates the product type with over 60% share, favored for stability in dry formulations.
Market Drivers
Strong Use of Citric Acid as a Natural Preservative in Packaged Food and Beverages
The Citric Acid Market gains strong momentum from its role in food preservation. Food and beverage manufacturers rely on citric acid for extending shelf life and flavor stability. Its natural label status aligns with clean-label consumer preferences. Global demand for packaged and ready-to-eat food boosts usage across product lines. Beverage categories including soft drinks and flavored waters heavily depend on citric acid. Its sourness enhances taste profiles, while its antimicrobial action maintains freshness. Demand remains consistent across carbonated and non-carbonated drinks. The widespread consumption of processed foods reinforces steady growth in food-grade citric acid.
Increasing Demand from Detergents and Household Cleaners for Chelating and pH Control
Rising demand for eco-friendly cleaning products supports citric acid usage in household formulations. It works as a chelating agent that binds metal ions and improves cleaner performance. Global detergent manufacturers use it for scale removal, pH control, and stain breakdown. It replaces phosphate-based agents, which face stricter regulatory limits. The Citric Acid Market benefits from growing hygiene awareness and green chemical preferences. Companies adopt bio-based acids for both safety and environmental compliance. Rising consumption of dishwasher tablets, surface cleaners, and laundry care products adds to volume demand. Industrial and institutional cleaning segments contribute further to market expansion.
- For instance, Procter & Gamble's Tide Pods formulations incorporate citric acid as a chelating agent achieving up to 0.015% sulfate limits per FCC specs, enhancing scale removal in phosphate-free detergents.
Expanding Applications in Pharmaceuticals for Effervescent Drugs and pH Adjustment
Pharmaceutical firms use citric acid for drug stabilization, pH balancing, and effervescence. The Citric Acid Market sees consistent demand from oral dosage forms such as syrups and tablets. In combination with sodium bicarbonate, it drives fast-dissolving effervescent formats. Formulators value its safety, non-toxicity, and wide pH range compatibility. It also aids in taste masking and enhances bioavailability in certain active ingredients. Growing production of dietary supplements and vitamin C formulations expands its footprint. Regulatory bodies consider it generally recognized as safe (GRAS), supporting broad medical and consumer health use. Rising self-medication trends further support volume growth.
Growth in Biobased Ingredients Across Food, Pharma, and Cosmetic Applications
Biobased ingredients are gaining priority in industrial supply chains due to sustainability goals. Citric acid fits well within this transition due to its fermentation-based production. The Citric Acid Market gains traction from the rising demand for renewable inputs in food, personal care, and pharma. Large FMCG brands prioritize natural ingredients to meet consumer safety concerns. In cosmetics, citric acid is used in exfoliants, creams, and skin pH regulators. Its non-toxic profile and mild acidity enhance product appeal in green beauty formulations. Growth in natural product certification schemes favors its usage. Producers continue expanding biobased production capacity to meet future demand.
- For instance, Archer Daniels Midland ferments citric acid from corn glucose under GMP/HACCP with residue on ignition max 0.05%, supporting non-GMO certified supply for cosmetics and pharma.
Market Trends
Shift Toward Non-GMO and Organic Citric Acid Sourcing in Food and Beverage Processing
The Citric Acid Market is shifting toward non-GMO and organic-grade options across food processing applications. Regulatory frameworks and consumer watchdogs push for transparency in food ingredient sourcing. Processed food exporters in Europe and North America increasingly seek non-GMO-certified citric acid inputs. Manufacturers highlight these attributes in product labeling to boost brand trust. The trend strengthens in baby foods, organic juices, and premium baked goods. Organic-acid certified facilities experience higher demand from health-focused retailers. Supply chain traceability tools also increase transparency for ethically sourced raw materials. This shift improves pricing leverage for certified citric acid producers.
- For instance, Jungbunzlauer offers non-GMO citric acid produced via fermentation from non-GMO corn starch, verified under EU Organic Regulation (EC) No 834/2007 with full supply chain traceability.
Adoption of Citric Acid in Plant-Based and Vegan Product Formulations
Rising demand for vegan and plant-based alternatives expands the use of citric acid as a stabilizer. The Citric Acid Market benefits from its compatibility with plant proteins and dairy substitutes. Manufacturers of vegan cheese, yogurts, and ready meals use citric acid to maintain taste and texture. It helps preserve freshness and prevents discoloration in plant-derived ingredients. Brands also rely on it for emulsification in dairy-free spreads and creams. The clean-label compatibility boosts adoption across global plant-based portfolios. Vegan-certified cosmetic brands also use citric acid in pH balancing products. These shifts support long-term demand beyond traditional food applications.
Growing Popularity of Citric Acid in Fermentation and Biotech Manufacturing Chains
Citric acid plays a critical role in bioprocessing as a buffer, nutrient, and pH controller. Biotech and fermentation-based production systems rely on citric acid during downstream processing. The Citric Acid Market sees rising consumption in enzyme manufacturing and microbial fermentation platforms. Biopharma companies use it to maintain stability in fermentation tanks and protein extraction systems. Plant-based meat manufacturers also apply citric acid in flavor development and spoilage prevention. These use cases continue to grow in precision fermentation and synthetic biology domains. Demand aligns with innovations in biotech-driven food production and bio-based materials. Its scalability supports broad industrial use.
- For instance, IFF (formerly DuPont) uses pharmaceutical-grade citric acid with arsenic content ≤1 ppm as a buffering and chelating agent in enzyme fermentation processes. These fermentations typically transition to a low-pH environment (<3.0) during production to maximize enzyme yield and minimize microbial contamination, all under GMP-compliant manufacturing systems.
Use of Citric Acid in Eco-Friendly Packaging and Material Degradation Solutions
The packaging sector experiments with citric acid for biodegradable and compostable materials. Citric acid-based polymers support the development of sustainable packaging alternatives. The Citric Acid Market taps into this emerging space as firms pursue circular economy goals. Research institutions collaborate with packaging firms to enhance material flexibility and shelf-life stability. Agricultural mulch films and coated paper products also use citric acid blends. The focus on green chemistry enables long-term adoption in single-use item replacements. Start-ups in bio-packaging introduce formulations integrating food-safe acids like citric. Future regulatory pushes on plastic waste will further open this niche.
Market Challenges Analysis
Volatility in Raw Material Supply Chains and Rising Production Cost Pressures
Citric acid production depends heavily on sugar-based fermentation substrates like corn and sugarcane. Global agricultural disruptions, price volatility, and trade barriers create uncertainty in feedstock availability. The Citric Acid Market faces cost inflation linked to input prices and energy costs. Supply chain delays across shipping and distribution networks slow delivery timelines. Fluctuating foreign exchange rates impact pricing in import-heavy regions. Market competition from low-cost producers in Asia also compresses margins for global players. Regulatory costs for cleaner manufacturing compliance raise overheads further. These constraints limit flexibility and affect long-term contract pricing.
Environmental and Regulatory Compliance Pressures on Fermentation Waste Management
Citric acid fermentation generates high volumes of liquid waste and biomass residue. Wastewater treatment and byproduct disposal remain key regulatory challenges. The Citric Acid Market experiences scrutiny over environmental compliance from regional bodies. Permits, emissions caps, and water discharge limits increase operating costs for mid-size producers. Sustainability certifications now require data on water usage and carbon emissions. Some producers must invest in cleaner disposal technologies or waste-to-energy systems. Upgrading facilities can slow expansion plans, especially in emerging economies. These factors raise the entry barrier and limit participation by smaller manufacturers.
Market Opportunities
Expanding Demand for Citric Acid in Specialty Nutraceutical and Functional Beverage Segments
Functional beverages and nutraceuticals drive fresh demand for bioactive and natural acidity regulators. The Citric Acid Market benefits from its wide regulatory approval and compatibility with multiple formats. It plays a key role in effervescent tablets, immune boosters, and hydration drinks. Global brands launch new wellness products that require taste enhancers and pH balancers. Citric acid supports shelf-life extension and flavor uniformity in fortified products. It remains a preferred choice for pH control due to its buffering range and safety.
Rising Investment in Local Production Facilities in Emerging Markets
Several emerging economies now support local production to reduce import reliance and supply risk. Governments in Asia, Africa, and Latin America offer incentives for food additive manufacturing. The Citric Acid Market expands in these regions through capacity additions and joint ventures. These moves shorten lead times and ensure access to regulated product formulations. Domestic players gain pricing advantage and better regional market control. This trend also supports job creation and self-reliance goals.
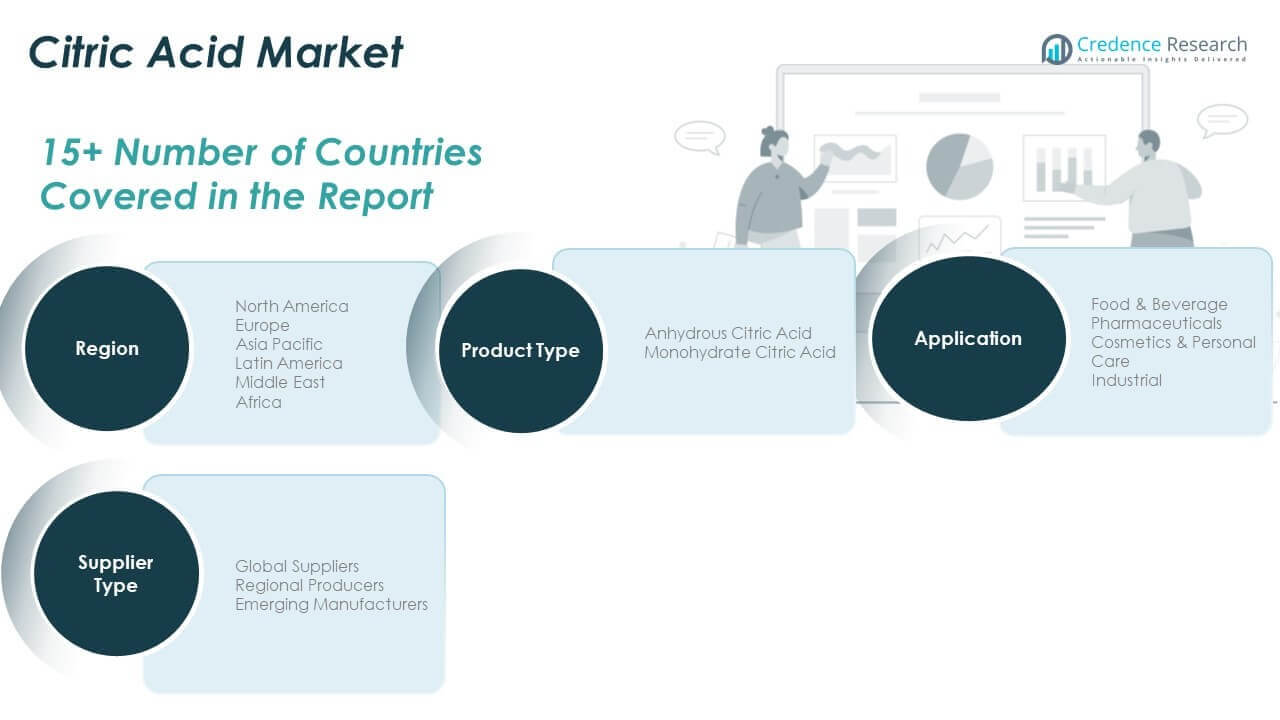
Market Segmentation Analysis:
By product type, the Citric Acid Market is segmented by product type into Anhydrous Citric Acid and Monohydrate Citric Acid. Anhydrous citric acid holds a larger share due to its superior stability and longer shelf life, making it suitable for dry applications in food, pharmaceuticals, and industrial formulations. Monohydrate citric acid sees growing use in beverage and cosmetic formulations where solubility in water is critical.
- For instance, Jungbunzlauer Canada Inc. operates at a verified maximum capacity of 140,000 tonnes of citric acid per year at its Port Colborne facility.
By application, Food & Beverage remains the dominant segment, driven by the widespread use of citric acid as a preservative and flavoring agent. The Pharmaceutical segment contributes steadily, supported by its use in effervescent tablets, pH control, and oral syrups. Cosmetics & Personal Care utilize citric acid in formulations for exfoliation, pH regulation, and product preservation. The Industrial segment, including cleaning agents and detergents, shows growing demand due to the shift toward biodegradable ingredients.
By supplier type, Global Suppliers command a strong position through large-scale operations and international distribution networks. Regional Producers serve mid-sized markets with localized supply chains and cost advantages. Emerging Manufacturers are gaining ground in developing economies by leveraging government support, domestic raw material access, and growing internal demand. Each supplier type plays a vital role in balancing global supply and meeting regional regulatory and consumer needs.
- For instance, Weifang Ensign Industry employs over 3,000 staff across upgraded production lines reaching 300,000 tons citric acid capacity.
Segmentation:
By Product Type
- Anhydrous Citric Acid
- Monohydrate Citric Acid
By Application
- Food & Beverage
- Pharmaceuticals
- Cosmetics & Personal Care
- Industrial
By Supplier Type
- Global Suppliers
- Regional Producers
- Emerging Manufacturers
By Region
- North America
- U.S.
- Canada
- Mexico
- Europe
- Germany
- France
- U.K.
- Italy
- Spain
- Rest of Europe
- Asia Pacific
- China
- Japan
- India
- South Korea
- South-east Asia
- Rest of Asia Pacific
- Latin America
- Brazil
- Argentina
- Rest of Latin America
- Middle East & Africa
- GCC Countries
- South Africa
- Rest of the Middle East and Africa
Regional Analysis:
North America
The North America Citric Acid Market size was valued at USD 1,137.50 million in 2018 to USD 1,244.12 million in 2024 and is anticipated to reach USD 1,696.42 million by 2032, at a CAGR of 4.0% during the forecast period. North America accounts for approximately 24.7% of the global market share in 2024. It leads in the adoption of citric acid across packaged food, beverages, and pharmaceuticals. Demand for clean-label and non-GMO ingredients supports strong volume consumption. The U.S. remains the dominant country with advanced production, R&D capabilities, and large-scale processed food industries. Major pharmaceutical firms in the region use citric acid in oral and injectable formulations. Regulatory compliance with GRAS status supports wide applications. The household cleaning segment contributes significantly due to eco-friendly formulation trends. Distribution efficiency and high consumer awareness sustain North America’s strong market position.
Europe
The Europe Citric Acid Market size was valued at USD 756.00 million in 2018 to USD 798.54 million in 2024 and is anticipated to reach USD 1,016.22 million by 2032, at a CAGR of 3.1% during the forecast period. Europe represents nearly 15.8% of the global market share in 2024. High demand for citric acid in processed foods, dairy, and confectionery drives regional growth. Stringent food safety regulations and sustainability goals influence supplier choices. European cosmetic brands use citric acid in organic and vegan formulations. Germany, France, and the UK lead regional consumption across pharmaceutical and food sectors. Industrial cleaning agents also see adoption due to phosphate bans. Sustainability and ingredient traceability are top procurement priorities. The region supports stable demand through mature end-use industries.
Asia Pacific
The Asia Pacific Citric Acid Market size was valued at USD 1,193.50 million in 2018 to USD 1,365.40 million in 2024 and is anticipated to reach USD 2,004.85 million by 2032, at a CAGR of 4.9% during the forecast period. Asia Pacific holds the largest share, accounting for 27.7% of the global market in 2024. China and India drive production and consumption through large-scale food, beverage, and pharmaceutical sectors. Export-oriented manufacturing hubs in China contribute to global supply chains. Growing middle-class populations fuel demand for packaged and processed foods. Domestic pharmaceutical production creates strong need for excipients like citric acid. Regulatory frameworks are evolving to match international standards. Regional producers benefit from low-cost raw material availability. Expanding cosmetics and industrial applications support long-term growth.
Latin America The Latin America Citric Acid Market size was valued at USD 224.00 million in 2018 to USD 246.00 million in 2024 and is anticipated to reach USD 311.99 million by 2032, at a CAGR of 3.1% during the forecast period. Latin America contributes around 4.9% of the global market share in 2024. Brazil and Argentina are key contributors, with growing demand from food and pharmaceutical industries. Rising urbanization and processed food intake support usage across regional markets. Local suppliers focus on importing raw materials or finished citric acid for blending and formulation. Pharmaceutical expansion and dietary supplement trends create new growth points. Cosmetics and personal care brands adopt citric acid in clean beauty lines. Economic variability impacts pricing and sourcing strategies. Market growth is steady but affected by regional trade dynamics.
Middle East
The Middle East Citric Acid Market size was valued at USD 112.00 million in 2018 to USD 114.84 million in 2024 and is anticipated to reach USD 138.35 million by 2032, at a CAGR of 2.4% during the forecast period. The region represents 2.3% of the global market share in 2024. GCC countries lead in demand due to higher consumption of processed food, beverages, and pharmaceutical goods. Growing retail chains support packaged food growth, enhancing citric acid usage. Import dependency remains high due to limited local production. Regional pharmaceutical hubs in Saudi Arabia and UAE increase demand for excipients. Industrial applications remain limited but are expanding with urban development. Regulatory imports and halal certifications influence supply chain strategies. Market maturity is still developing across many smaller economies.
Africa
The Africa Citric Acid Market size was valued at USD 77.00 million in 2018 to USD 111.78 million in 2024 and is anticipated to reach USD 131.80 million by 2032, at a CAGR of 1.7% during the forecast period. Africa holds about 2.2% of the global market share in 2024. South Africa is the primary demand center, with growing needs in food, beverages, and pharmaceutical sectors. Urban population growth and rising consumer packaged goods consumption aid market visibility. Imports dominate the supply chain due to limited local production capabilities. Small-scale manufacturers rely on imported citric acid for food processing and beverage preservation. Pharmaceutical adoption is rising with improvements in public healthcare access. Regional regulatory gaps affect quality standardization. Slow but steady growth continues across developing markets within the continent.
Key Player Analysis:
- Pfizer, Inc.
- Tate & Lyle PLC
- Danisco A/S
- Cargill
- Kenko Corporation
- ADM (Archer Daniels Midland Company)
Competitive Analysis:
The Citric Acid Market features a concentrated competitive landscape dominated by global producers with integrated supply chains. Leading players include Cargill, ADM, Tate & Lyle, and Danisco A/S, all of which leverage scale, technology, and diversified end-use portfolios. Chinese manufacturers hold significant volume share due to low-cost production and strong export orientation. Global suppliers focus on non-GMO certifications, green production practices, and customer-specific customization. Regional producers compete through pricing and localized sourcing advantages. Market participants invest in capacity expansion, fermentation efficiency, and waste reduction to sustain margins. Strategic moves such as mergers, product launches, and regional distribution partnerships shape the competitive momentum. The Citric Acid Market continues to evolve with increasing demand from food, pharmaceutical, and industrial applications, driving the need for continuous innovation and regulatory compliance. Players with strong R&D and flexible manufacturing retain a clear advantage in meeting shifting customer requirements across diverse global markets.
Recent Developments:
- In July 2024, Tate & Lyle acquired CP Kelco, a US-based producer of nature-based speciality ingredients including citrus fibre, for approximately $1.8 billion to bolster its sweetening, mouthfeel, and fortification platforms in the citric acid and related markets.
Report Coverage:
The research report offers an in-depth analysis based on Product Type, Application, Supplier Type. It details leading market players, providing an overview of their business, product offerings, investments, revenue streams, and key applications. Additionally, the report includes insights into the competitive environment, SWOT analysis, current market trends, as well as the primary drivers and constraints. Furthermore, it discusses various factors that have driven market expansion in recent years. The report also explores market dynamics, regulatory scenarios, and technological advancements that are shaping the industry. It assesses the impact of external factors and global economic changes on market growth. Lastly, it provides strategic recommendations for new entrants and established companies to navigate the complexities of the market.
Future Outlook:
- Rising demand for clean-label ingredients will accelerate citric acid adoption across food and beverage categories.
- Pharmaceutical and nutraceutical applications will expand due to rising demand for pH adjusters and excipients.
- Sustainable sourcing and fermentation-based production methods will shape future supplier strategies.
- Industrial cleaning and detergent formulations will continue shifting toward citric acid as a phosphate alternative.
- Regional producers in Asia Pacific and Latin America will scale operations to meet growing domestic demand.
- Product innovation in effervescent tablets and functional beverages will strengthen downstream application potential.
- Digital traceability and ingredient certification will become essential in global trade and supply chain compliance.
- Global suppliers will invest in capacity expansion to balance rising demand and supply security.
- Cosmetic and personal care formulations will increasingly use citric acid for pH balancing and natural preservation.
- Regulatory pressure on chemical-based additives will push more industries toward citric acid-based alternatives.
Request a Free Sample
Fill in your details and we'll send you a free sample report.
- Sample data tables & charts
- Research methodology
Need a Custom Version of This Report?
Tailor the scope, geography, or segments to your exact requirements.
- Custom geography or segment scope
- Direct access to our analyst team
Frequently Asked Questions
What is the current market size for Citric Acid Market, and what is its projected size in 2032?
At what Compound Annual Growth Rate is the Citric Acid Market projected to grow between 2024 and 2032?
Which Citric Acid Market segment held the largest share in 2024?
What are the primary factors fueling the growth of the Citric Acid Market?
Who are the leading companies in the Citric Acid Market?
Which region commanded the largest share of the Citric Acid Market in 2024?
Table of Content
Chapter 1. Report Introduction
- 1.1 Report Description & Purpose
- 1.1.1 Report Title & Market Definition
- 1.1.2 Unique Selling Propositions (USP) & Key Differentiators
- 1.1.3 Value Proposition for Stakeholders
- 1.2 Research Objectives
- 1.2.1 Market Sizing Objectives (Volume & Revenue)
- 1.2.2 Segmentation Objectives
- 1.2.3 Competitive Intelligence Objectives
- 1.2.4 Forecast & Scenario Objectives
- 1.3 Report Scope
- 1.3.1 Citric Acid Scope – Types & Subtypes Covered
- 1.3.2 Geographic Scope – Regions & Countries Covered
- 1.3.3 Historical Period, Base Year & Forecast Period (2024; forecast to 2032)
- 1.3.4 Inclusions & Exclusions
- 1.4 HS Code & Classification Framework
- 1.5 Currency, Units & Pricing Basis
- 1.6 Target Stakeholders
- 1.7 Limitations & Assumptions
Chapter 2. Executive Summary
- 2.1 Global Citric Acid Market Snapshot
- 2.1.1 Market Size – Historical (2024) & Forecast (2024-2032) (2024: USD 3,880.69 million → 2032: USD 5,299.62 million)
- 2.1.2 Volume & Revenue – Global Totals
- 2.1.3 Key Market Highlights – Top Five Facts
- 2.2 Citric Acid Market Segmentation Snapshot
- 2.2.1 Market Split by Region – 2024 vs. 2032
- 2.3 Competitive Snapshot
- 2.3.1 Top 10 Players by Revenue Share – 2024
- 2.3.2 Top 10 Players by Volume Share – 2024
- 2.3.3 Recent Strategic Developments (18-Month Summary)
- 2.4 Key Investment Highlights & Strategic Conclusions
Chapter 3. Citric Acid Market Dynamics & Industry Analysis
- 3.1 Market Overview & Context
- 3.1.1 Citric Acid Market Position in the Broader Automotive Value Chain
- 3.1.2 OEM vs. Replacement Market Dynamics
- 3.1.3 Market Maturity & Development Stage by Region
- 3.2 Citric Acid Market Drivers
- 3.3 Citric Acid Market Restraints & Challenges
- 3.4 Citric Acid Market Opportunities
- 3.5 Porter's Five Forces Analysis
- 3.5.1 Threat of New Entrants
- 3.5.2 Bargaining Power of Suppliers
- 3.5.3 Bargaining Power of Buyers
- 3.5.4 Threat of Substitutes
- 3.5.5 Competitive Rivalry – Intensity Assessment
- 3.6 Citric Acid Value Chain Analysis
- 3.6.1 Upstream – Raw Material/Input Suppliers
- 3.6.1.1 Raw Material/Input 1
- 3.6.1.2 Raw Material/Input 2
- 3.6.1.3 Raw Material/Input 3
- 3.6.2 Midstream – Production/Manufacturing/Service Delivery
- 3.6.2.1 Production/Process Overview
- 3.6.2.2 Key Facility Locations & Capacity by Manufacturer
- 3.6.3 Downstream – Distribution & End Consumer
- 3.6.3.1 Primary Channel – B2B/OEM
- 3.6.3.2 Secondary Channels – Dealer, Retail, Online, Direct
- 3.6.4 Value Chain Profitability Analysis
- 3.6.1 Upstream – Raw Material/Input Suppliers
- 3.7 PESTEL Analysis
- 3.7.1 Political Factors
- 3.7.2 Economic Factors
- 3.7.3 Social Factors
- 3.7.4 Technological Factors
- 3.7.5 Environmental Factors
- 3.7.6 Legal Factors
- 3.8 Citric Acid Supply Chain Analysis
- 3.8.1 Raw Material/Input Supply Risk Assessment
- 3.8.2 Manufacturing Concentration Risk (Geographic Exposure)
- 3.8.3 Trade Disruption Impact Analysis
- 3.9 Regulatory & Policy Landscape
Note: The regulatory and policy landscape section covers regulations based on their applicability to the market, Citric Acid category, geography, and scope of the study. Only regulatory frameworks with a material impact on operations, compliance, trade, sustainability, or market access are analyzed in detail.
Chapter 4. Key Investment Pockets & Opportunity Analysis
- 4.1 Citric Acid Market Attractiveness Analysis
- 4.1.1 By Region – Investment Attractiveness Matrix (Volume × CAGR)
- 4.2 Absolute Revenue Growth Opportunity
- 4.2.1 By Region – Absolute USD Growth Through 2032
- 4.3 Incremental Volume Opportunity
- 4.3.1 By Region – Incremental Volume Through 2032
- 4.3.2 Segment – Incremental Volume
- 4.4 Emerging Submarket Opportunity Deep Dive (Subject to Applicability)
- 4.5 Emerging Market Opportunity Scorecards
- 4.5.1 United States
- 4.5.2 Europe
- 4.5.3 Asia
- 4.5.4 Middle East & Africa
Note: Emerging Market Opportunity Scorecards will be included based on relevance and strategic importance. Regions listed are indicative and may vary depending on data availability and market dynamics.
Chapter 5. Citric Acid Import-Export Analysis & Trade Flows
- 5.1 Global Trade Overview
- 5.1.1 Global Export Value by Country (2024)
- 5.1.2 Global Export Volume by Country (2024)
- 5.1.3 Global Import Value by Country (2024)
- 5.1.4 Global Import Volume by Country (2024)
- 5.1.5 Net Trade Balance by Country (2024)
- 5.2 Export Analysis – Segment
- 5.2.1 Type 1 (HS Code)
- 5.2.2 Type 2 (HS Code)
- 5.2.3 Type 3 (HS Code)
- 5.2.4 Type 4 (HS Code)
- 5.2.5 Type 5 (HS Code)
- 5.3 Import Analysis – Segment
- 5.3.1 Type 1 (HS Code)
- 5.3.2 Type 2 (HS Code)
- 5.3.3 Type 3 (HS Code)
- 5.3.4 Type 4 (HS Code)
- 5.3.5 Type 5 (HS Code)
- 5.4 Average Unit Trade Prices
- 5.4.1 Average Export Price – Segment & Country
- 5.4.2 Average Import Price – Segment & Source Country
- 5.4.3 Price Trends (2024)
- 5.5 Key Trade Route Analysis
- 5.5.1 Trade Route 1
- 5.5.2 Trade Route 2
- 5.5.3 Trade Route 3
- 5.5.4 Trade Route 4
- 5.5.5 Trade Route 5
- 5.6 Trade Policy Impact Assessment
- 5.6.1 US Anti-Dumping & Section 301 Tariffs
- 5.6.2 EU Customs Union Impact
- 5.6.3 Major Free Trade Agreements
- 5.6.4 USMCA Rules of Origin
Note: Trade policy analysis will be included only where relevant to the Citric Acid market.
Chapter 6. Competitive Landscape & Company Benchmarking
- 6.1 Citric Acid Market Concentration & Structure
- 6.1.1 Herfindahl-Hirschman Index (HHI) – vs. 2024
- 6.1.2 Tier 1, Tier 2 & Tier 3 Market Structure
- 6.1.3 Global, Regional & Local Player Dynamics
- 6.2 Citric Acid Market Share Analysis – 2024
- 6.2.1 Global Revenue Share by Company
- 6.2.2 Global Volume Share by Company
- 6.2.3 Regional Revenue Share
- 6.2.4 Market Share Evolution ( vs. 2024)
- 6.2.5 OEM Segment Share by Company
- 6.2.6 Replacement Segment Share by Company
- 6.3 Production/Delivery Capacity & Facility Analysis
- 6.3.1 Global Installed Capacity
- 6.3.2 Capacity Utilization Rates
- 6.3.3 Production/Output Volume
- 6.3.4 Facility Locations & Capacity Map
- 6.3.5 Planned Capacity Additions
- 6.4 Citric Acid Competitive Benchmarking Matrix
- 6.4.1 Revenue, Volume, CAGR & Profitability Comparison
- 6.4.2 Channel Revenue Mix
- 6.4.3 Geographic Revenue Exposure
- 6.4.4 R&D Intensity
- 6.4.5 Sustainability Maturity
- 6.5 Strategic Developments in Citric Acid (Last 24 Months)
- 6.5.1 Mergers, Acquisitions & Divestments
- 6.5.2 New Citric Acid Launches
- 6.5.3 Facility Expansions
- 6.5.4 Strategic Alliances, Joint Ventures & Partnerships
- 6.5.5 Distribution Expansion & Market Entry
- 6.5.6 Sustainability & ESG Initiatives
- 6.6 Competitive Strategy Mapping
- 6.6.1 Leader, Challenger, Follower & Niche Classification
- 6.6.2 Pricing Strategy Comparison
- 6.6.3 Channel Strategy Matrix
Note: Strategic developments are included based on their materiality and the availability of reliable information.
Chapter 7. Global Citric Acid Market – By Distribution Channel
- 7.1 Segment Overview
- 7.1.1 Volume & Revenue Split by Channel (2024 & 2032)
- 7.1.2 Channel Mix Evolution (2024-2032)
Chapter 8. Regional Market Analysis – Global Overview
- 8.1 Global Regional Overview
- 8.1.1 Regional Volume Share
- 8.1.2 Regional Revenue Share
- 8.1.3 Regional Volume by Region
- 8.1.4 Regional Revenue by Region
- 8.1.5 Regional Forecast Through 2032
- 8.2 Cross-Regional Segment Analysis
- 8.2.1 By Distribution Channel
- 8.2.2 By Brand/Price Tier
Chapter 9. North America Citric Acid Market
- 9.1 United States
- 9.2 Canada
- 9.3 Mexico
Chapter 10. Europe Citric Acid Market
- 10.1 Germany
- 10.2 France
- 10.3 Italy
- 10.4 United Kingdom
- 10.5 Spain
- 10.6 Poland
- 10.7 Russia
- 10.8 Netherlands
- 10.9 Belgium
- 10.10 Sweden
- 10.11 Denmark
- 10.12 Norway
- 10.13 Rest of Europe
Chapter 11. Asia Pacific Citric Acid Market
- 11.1 China
- 11.2 India
- 11.3 Japan
- 11.4 South Korea
- 11.5 Thailand
- 11.6 Indonesia
- 11.7 Vietnam
- 11.8 Malaysia
- 11.9 Australia
- 11.10 Rest of Asia Pacific
Chapter 12. Latin America Citric Acid Market
- 12.1 Brazil
- 12.2 Argentina
- 12.3 Colombia
- 12.4 Chile
- 12.5 Rest of Latin America
Chapter 13. Middle East Citric Acid Market
- 13.1 Saudi Arabia
- 13.2 United Arab Emirates
- 13.3 Turkey
- 13.4 Israel
- 13.5 Iran
- 13.6 Rest of the Middle East
Chapter 14. Africa Citric Acid Market
- 14.1 South Africa
- 14.2 Egypt
- 14.3 Nigeria
- 14.4 Morocco
- 14.5 Rest of Africa
Chapter 15. Citric Acid Company Profiles
- 15.1 [Company 01]
- 15.1.1 Company Overview
- 15.1.2 Key Management Personnel
- 15.1.3 Products & Services Portfolio
- 15.1.4 Financial Performance
- 15.1.5 Key Market Focus & Geographic Presence
- 15.1.6 Recent Developments & Strategic Initiatives
Note: The company profile list is preliminary and may change based on research findings, market developments, data availability, and client requirements.
Chapter 16. Appendices
- Appendix A – List of Abbreviations & Acronyms
- Appendix B – Industry Classification Code Reference – Full Series
- Appendix C – Production & Capacity Data Tables
- Appendix D – End-Use & Demand Base Tables
- Appendix E – Consumption & Replacement Rate Assumptions
- Appendix F – ASP Reference Tables
- Appendix G – Manufacturing & Facility Database
- Appendix H – Import-Export Data Tables
- Appendix I – Regulatory Summary Tables
- Appendix J – Primary Research Participant List (Anonymized)
- Appendix K – Primary Research Questionnaire Framework
- Appendix L – Data Sources & Bibliography
- Appendix M – Market Size Divergence & Source Comparison
Chapter 17. Research Methodology
- 17.1 Research Framework & Philosophy
- 17.2 Secondary Research – Sources, Hierarchy & Data Extraction
- 17.3 Data Modeling – Bottom-Up & Top-Down Market Sizing
- 17.4 Primary Research – Stakeholder Framework, LOI & Sample Sizes
- 17.5 Forecast Methodology – Regression, Scenario & Sensitivity Analysis
- 17.6 Quality Control – Four-Layer Validation Framework
- 17.7 Limitations & Standard Assumptions
- 17.8 Disclaimer
