
Quick answer
A compressed stabilized earth block plant making about 3 million blocks a year with five motorized hydraulic presses needs total CapEx of roughly USD 0.6–1.9 million, including land, curing yard, sheds, presses, mixers, a test laboratory and working capital. Gross margin runs about 20–45% of ex-works price, and payback falls near 4–8 years at 80% utilization. Soil quality, cement dose, curing space and local building approval decide whether the yard pays.
A modest, local-market business that works best on leased or low-cost land with a secure soil source and steady housing or public-works offtake; not suited to long-distance sales.
Compressed Stabilized Earth Block plant: key highlights
| Parameter | Indicative value | Note |
|---|---|---|
| Plant capacity | 3 million blocks per year | About 12,000 blocks a day over 250 days, roughly 24,000 tons at about 8 kg per block |
| Total CapEx | USD 0.6–1.9 million | Peri-urban South Asian or African site at the low end, U.S. or EU site at the high end |
| Raw material share of operating cost | 45–50% | Cement is the largest single input, ahead of soil and sand |
| Gross margin | 20–45% | On an assumed ex-works price of USD 0.25–0.35 per block |
| Payback period | 4–8 years | At 80% utilization and mid-range CapEx of about USD 1.2 million, before financing costs and tax |
| IRR | Available in report | Post-tax, 10-year model |
| Break-even | Available in report | Capacity utilization basis |
Ranges assume 3 million blocks a year of about 8 kg each, 250 working days on one shift, five motorized hydraulic presses, about 6% cement by weight, a representative greenfield site from a peri-urban South Asian or African location to a U.S. or EU site, 2026 prices, 40 staff at an assumed USD 4,000 average cost, an assumed ex-works price of USD 0.25–0.35 per block, 70–90% utilization and INR 88 and KES 129 per U.S. dollar. Customizable to any country.
What is a compressed stabilized earth block?
A compressed stabilized earth block, or CSEB, is a masonry unit made by pressing a damp mix of subsoil, sand, a small dose of stabilizer and water in a steel mold, then curing it for about four weeks instead of firing it. Cement is the usual stabilizer, at roughly 3–8% by weight, while lime suits clay-rich soils. Interlocking grades cut mortar use.
The Auroville Earth Institute in India grades blocks by wet strength, with its top class at 5–7 MPa dry and 3–4 MPa after 24 hours of immersion, and puts the embodied energy of a cubic meter of block at about 573 MJ against roughly 6,100 MJ for country-fired brick. Blocks serve load-bearing walls in low-rise housing, schools, boundary walls and vaults, and infill in framed buildings. Specifications include India's IS 1725:2023, Kenya's KS 02-1070, the African regional ARS series, France's XP P13-901, Spain's UNE 41410 and the ASTM E2392 design guide.
Cement-bonded blocks are commonly declared under HS 681011, building blocks and bricks of cement, concrete or artificial stone. Lime-stabilized or unstabilized blocks may fall elsewhere in Chapter 68, so exporters should seek a binding ruling.
Compressed stabilized earth block market overview and global demand
No production census or trade statistic tracks this product on its own, and Credence Research does not publish a dedicated market estimate for it, so demand is best read through the masonry and cement markets it competes in. Fired clay brick is the main rival. A World Bank review of the South Asian brick sector, published in April 2020, estimates that South Asia makes about 310 billion bricks a year, roughly a fifth of world output, with China at about two-thirds. India alone fires about 250 billion bricks in some 144,000 kilns that burn about 62 million tons of coal a year. An unfired block avoids that fuel bill.
Cement, the stabilizer, is a useful demand signal. The U.S. Geological Survey's 2026 cement summary estimates world output at 3.8 billion tons in 2025, led by China at 1.7 billion tons and India at 470 million tons. Places where both cement and fired brick are costly, from East Africa to rural India and parts of Latin America, tend to be the strongest early markets.
Affordable and donor-funded housing programs value low wall cost and local jobs, while architect-led projects and public works such as schools seek low-carbon, durable walls. In Europe, makers increasingly recycle soil excavated from city building sites, linking the product to the wider green building materials industry. The block also competes head-on with the hollow cement units covered by the concrete block and brick manufacturing market. Because blocks are heavy and low in value, sales stay local, usually within a short truck haul of the yard, and cross-border trade is negligible.
Compressed stabilized earth block manufacturing process
A CSEB plant looks more like a quarry-fed block yard than a brickworks. There is no kiln, so energy use is low, but soil control, press uptime and curing discipline decide quality, and the yard needs plenty of labor and space.
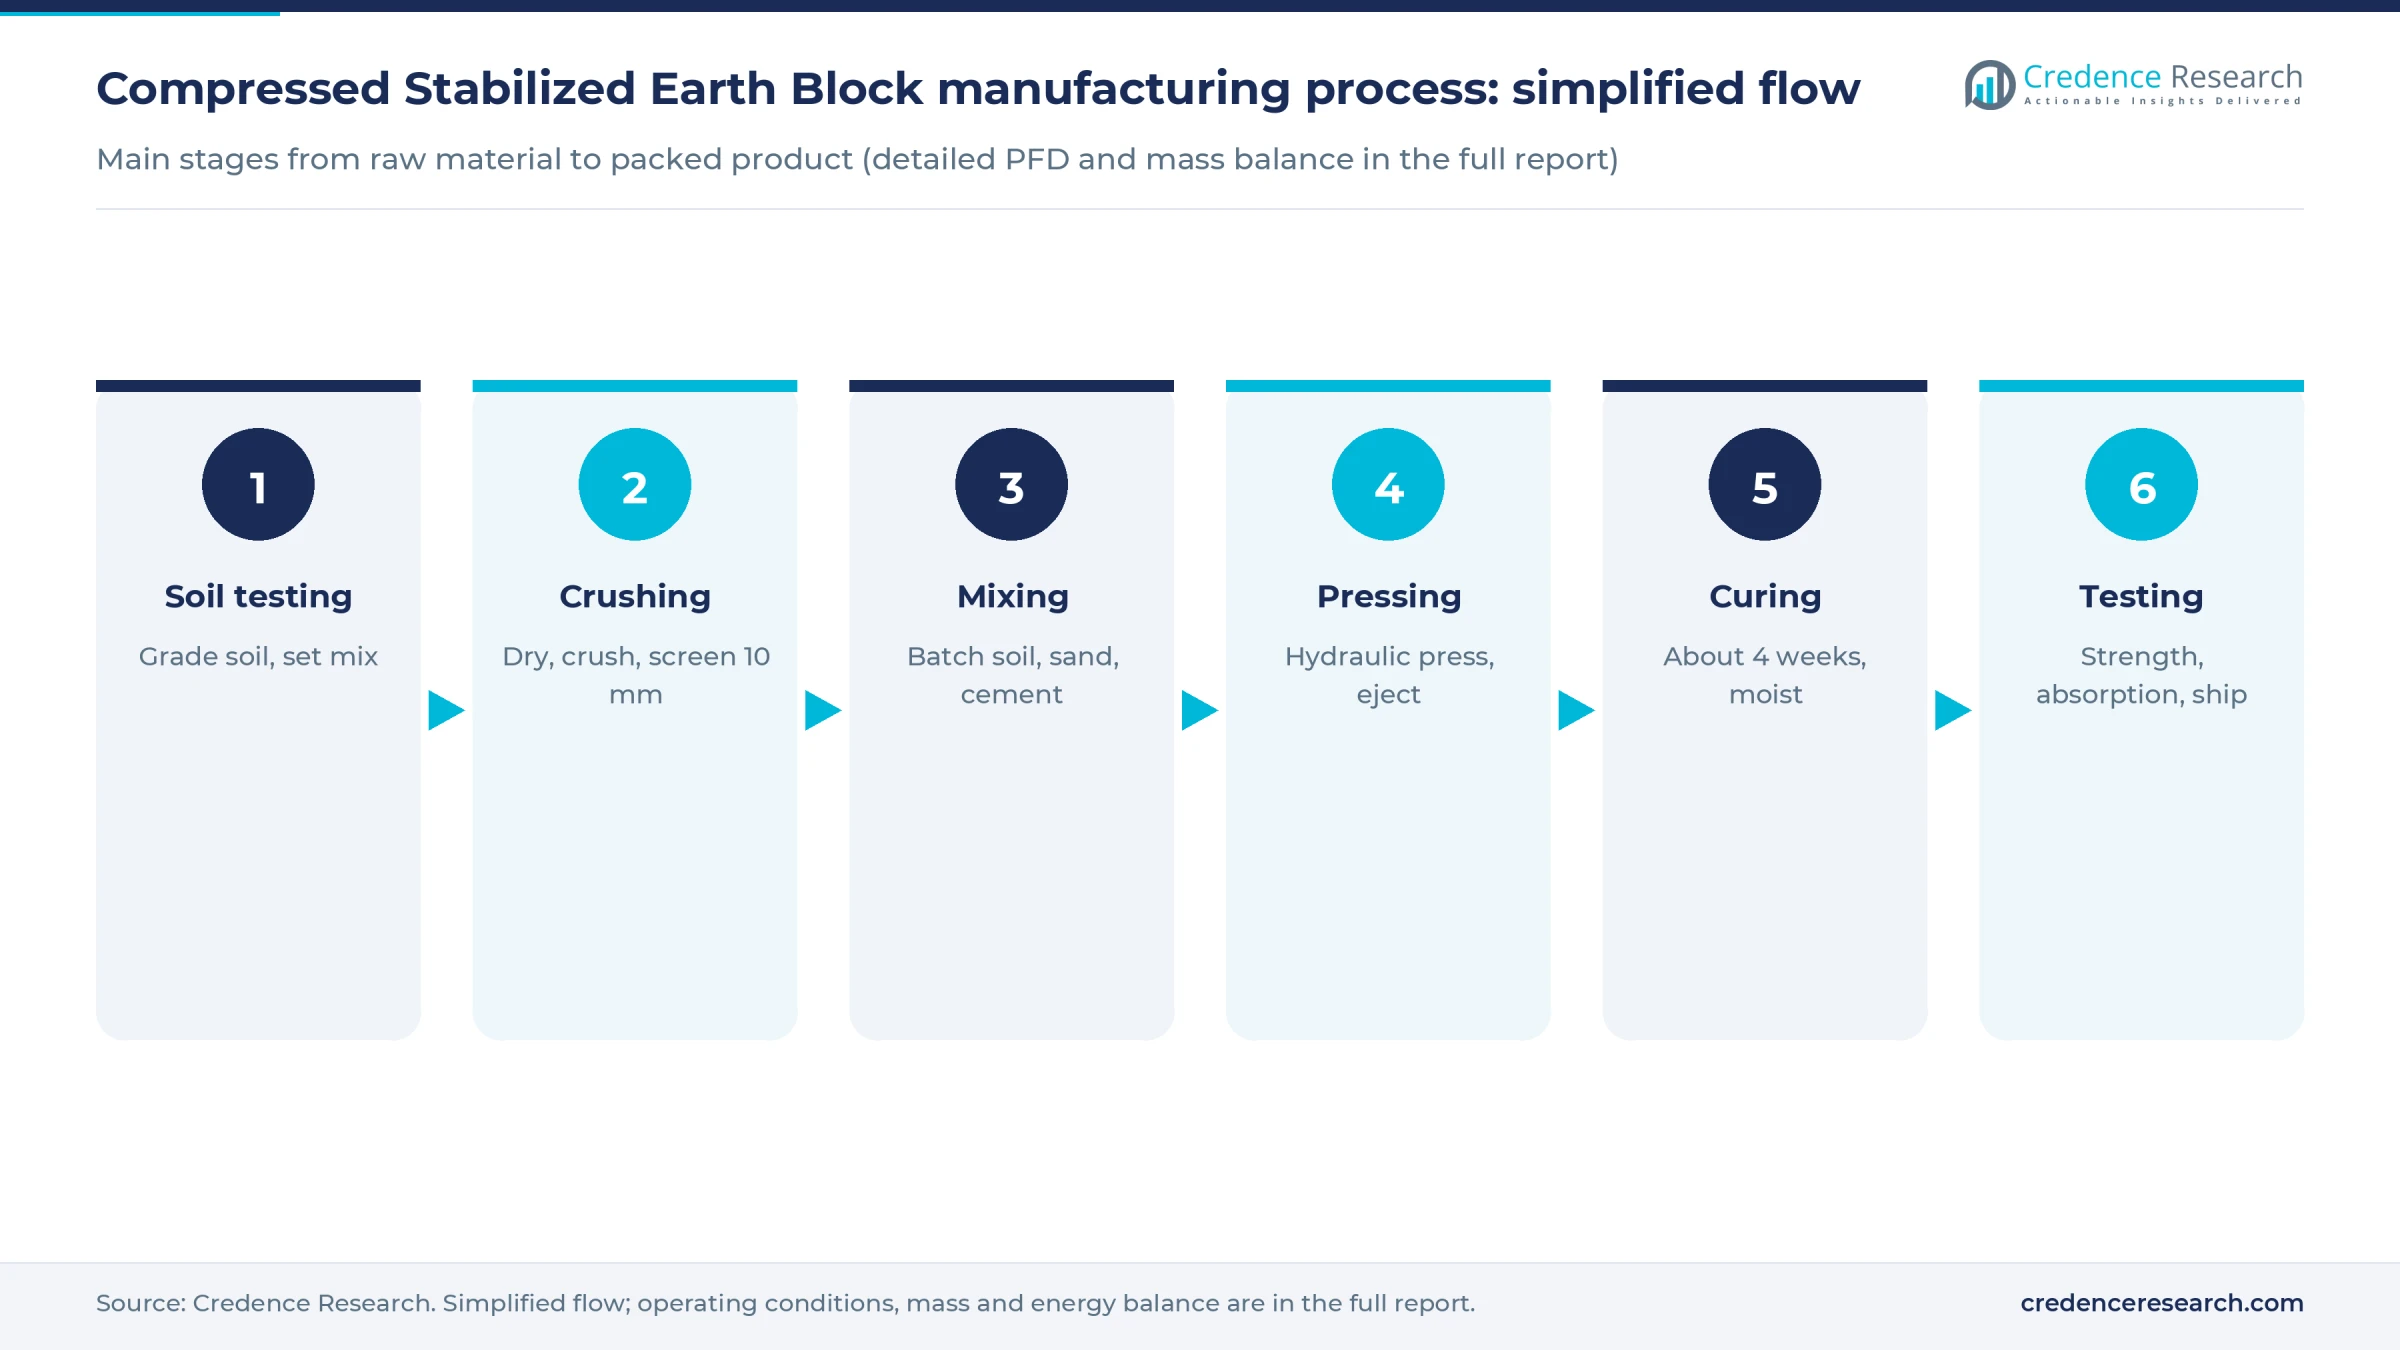
- Soil selection and testing. Subsoil from below the organic topsoil is tested for grain size, plasticity and shrinkage. Very clayey soils need added sand or lime, while very sandy soils need more cement.
- Drying, crushing and screening. Soil is air-dried, broken up in a pulverizer or crusher and passed through a screen of about 10 mm, the mesh the Auroville method specifies, to remove stones and lumps.
- Batching and mixing. Soil, sand and cement or lime are batched by volume or weight and dry-mixed, then water is added to an optimum moisture content found by test.
- Pressing. The damp mix is fed into a motorized hydraulic press, which compacts it in the mold and ejects a finished green block. Machines of the Hydraform and AECT type make about 2,200–2,400 blocks per eight-hour shift, against roughly 500–850 for manual presses.
- Curing. Green blocks are stacked under plastic sheets and kept moist for about four weeks so the cement hydrates.
- Testing and dispatch. Samples are checked for dry and wet compressive strength, water absorption and dimensions before blocks are palletized and delivered.
Curing space is the hidden constraint. A yard making 12,000 blocks a day must hold about four weeks of output, or more than 300,000 blocks, which is why land and pallets weigh heavily in the budget. The Auroville feasibility guide estimates about 700 cubic meters of subsoil for every 100,000 blocks, so a plant of this size needs some 21,000 cubic meters a year from its own borrow pit or from excavated spoil delivered by builders.
Compressed stabilized earth block plant setup cost
For a plant making 3 million blocks a year, about 12,000 a day over 250 working days with five motorized hydraulic presses, total project cost lands at roughly USD 0.6–1.9 million, including land, site works, sheds, machinery, a test laboratory, pre-operative costs and working capital. The low end reflects a peri-urban site in South Asia or Africa and the high end a U.S. or EU industrial location. No public feasibility study covers a plant of this size, so the range is built bottom-up from press list prices and assumed construction rates. The full report can be customized to any country.
Presses show how the machinery budget is built. The Engineering for Change product database lists a Hydraform M7 electric press at a suggested USD 14,810, and Chinese suppliers quote automatic hydraulic interlocking presses at about USD 8,800–11,800 free on board. Five presses at an assumed USD 10,000–25,000 each, plus a soil crusher and screen, mixers, conveyors, a wheel loader, a forklift, curing pallets, a generator and a compression tester, bring plant and machinery to an assumed USD 225,000–545,000.
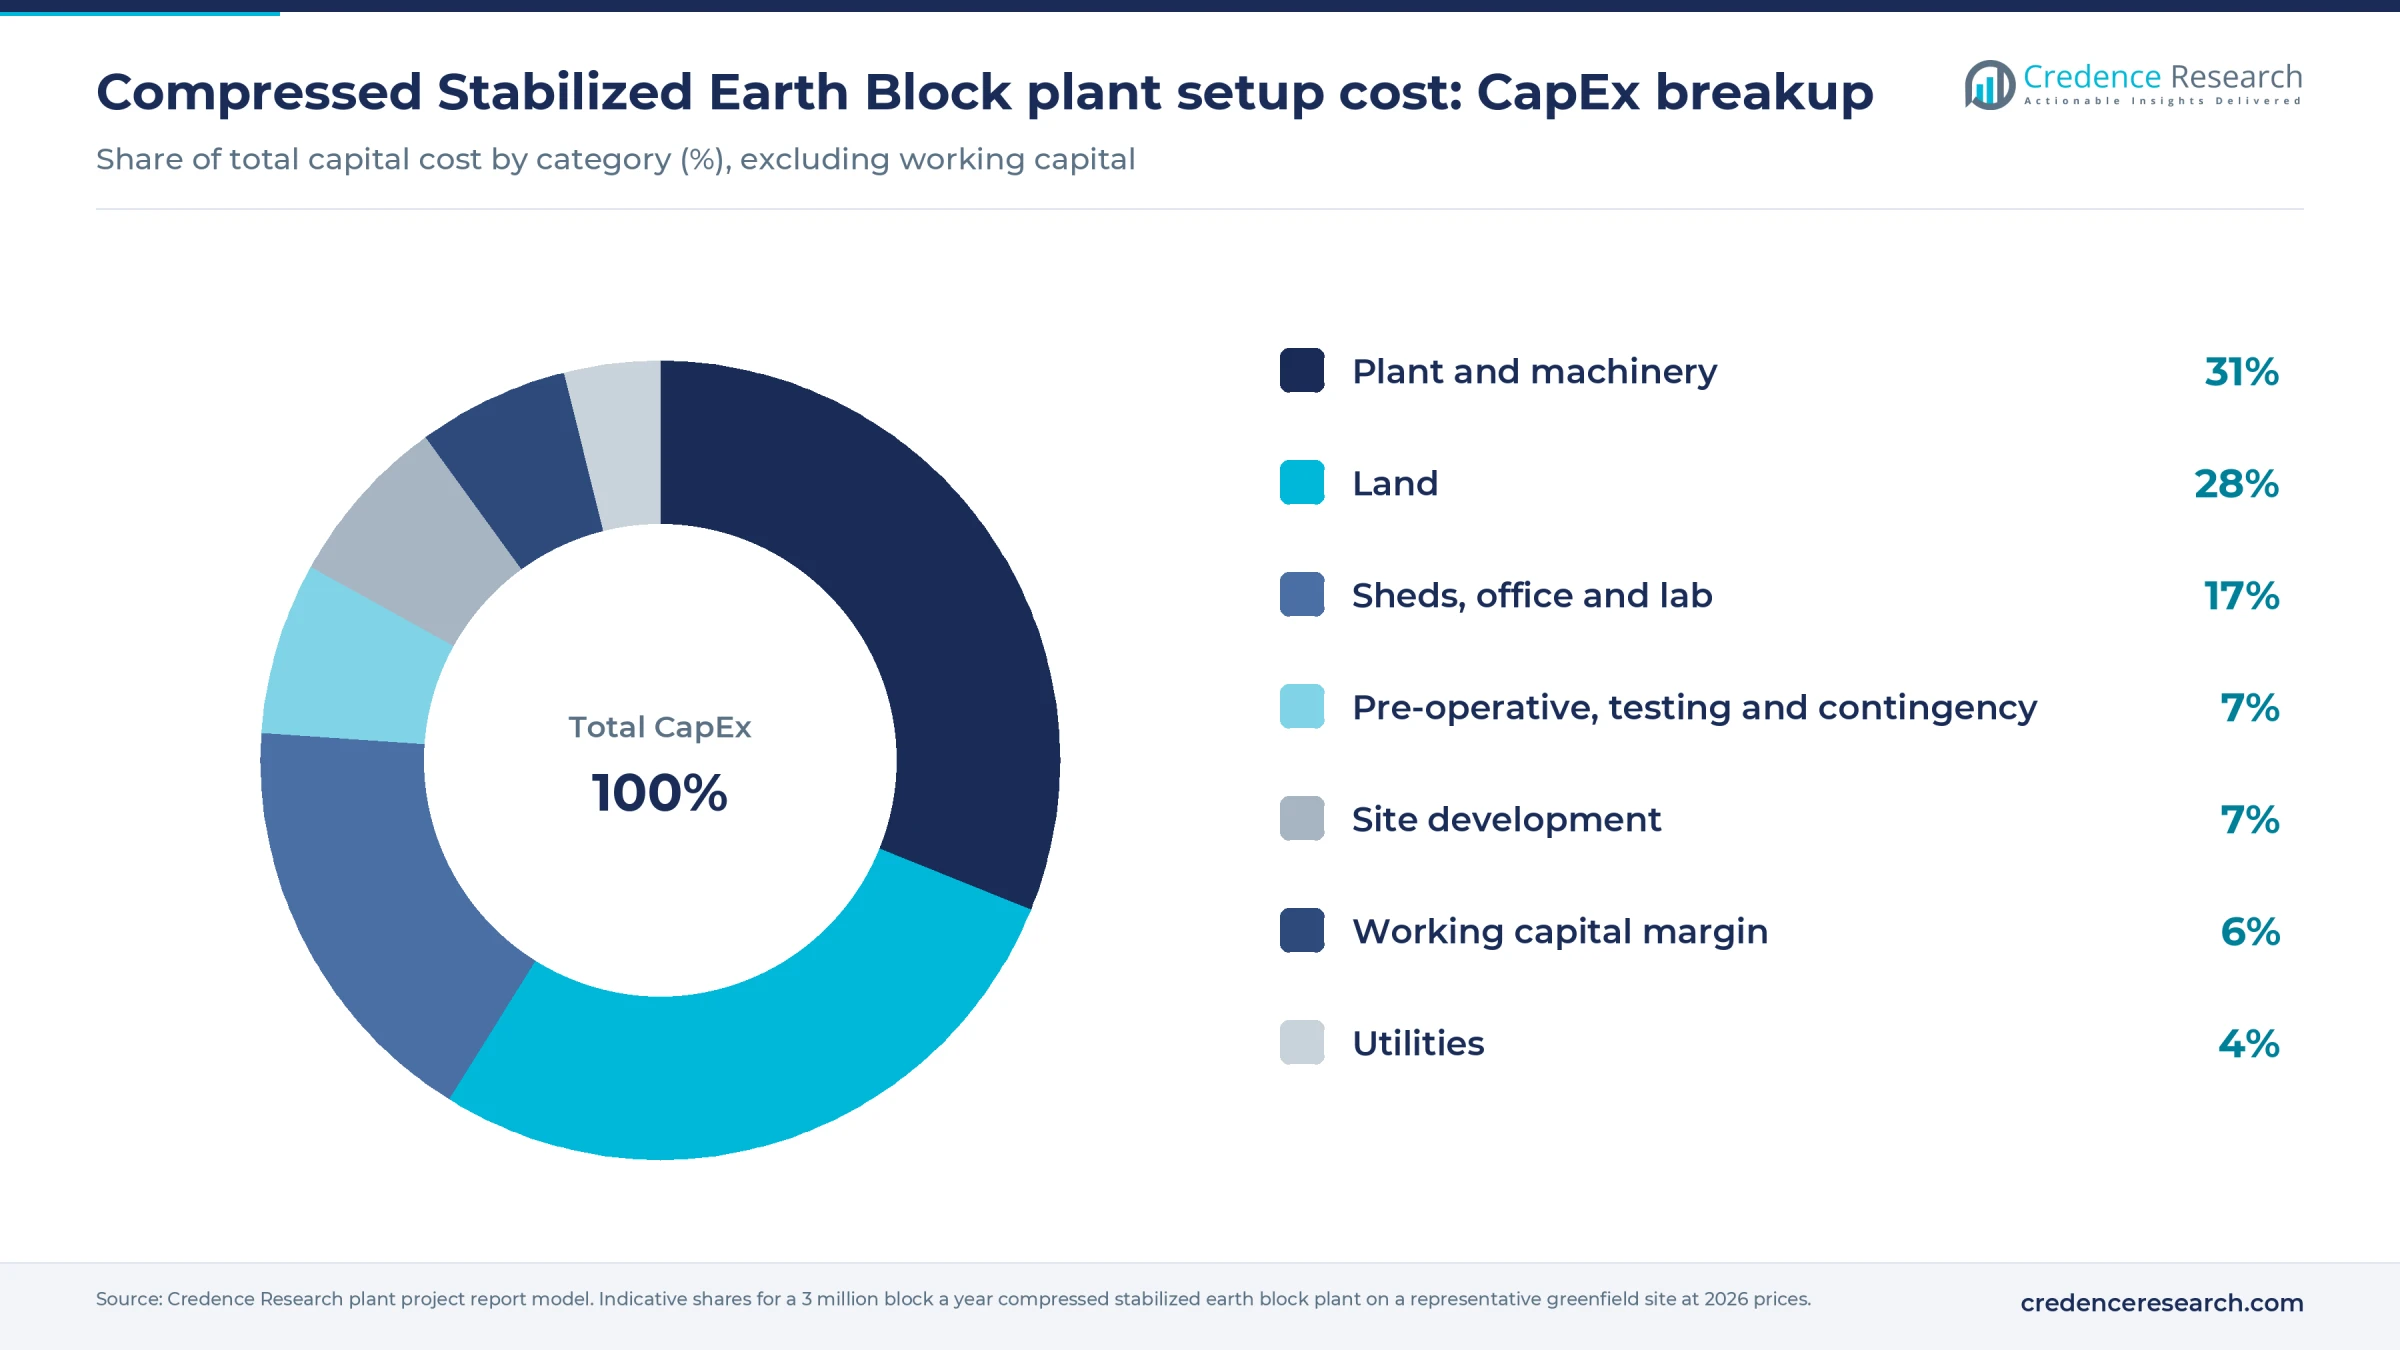
Land is the clearest worked example. A 1 hectare site, or 10,000 sq m, holds a soil stockpile, an 800 sq m press shed, about 1,500 sq m of covered curing and an open curing yard (assumed). At USD 10–60 per sq m (assumed), land costs about USD 100,000–600,000, which is why leasing land or sharing a site with a quarry or spoil depot cuts the budget sharply.
Lightweight sheds, an office and a laboratory take an assumed USD 125,000–300,000, and grading, drainage and paving add USD 40,000–120,000. Soil testing, product certification, training and contingency add another USD 50,000–120,000.
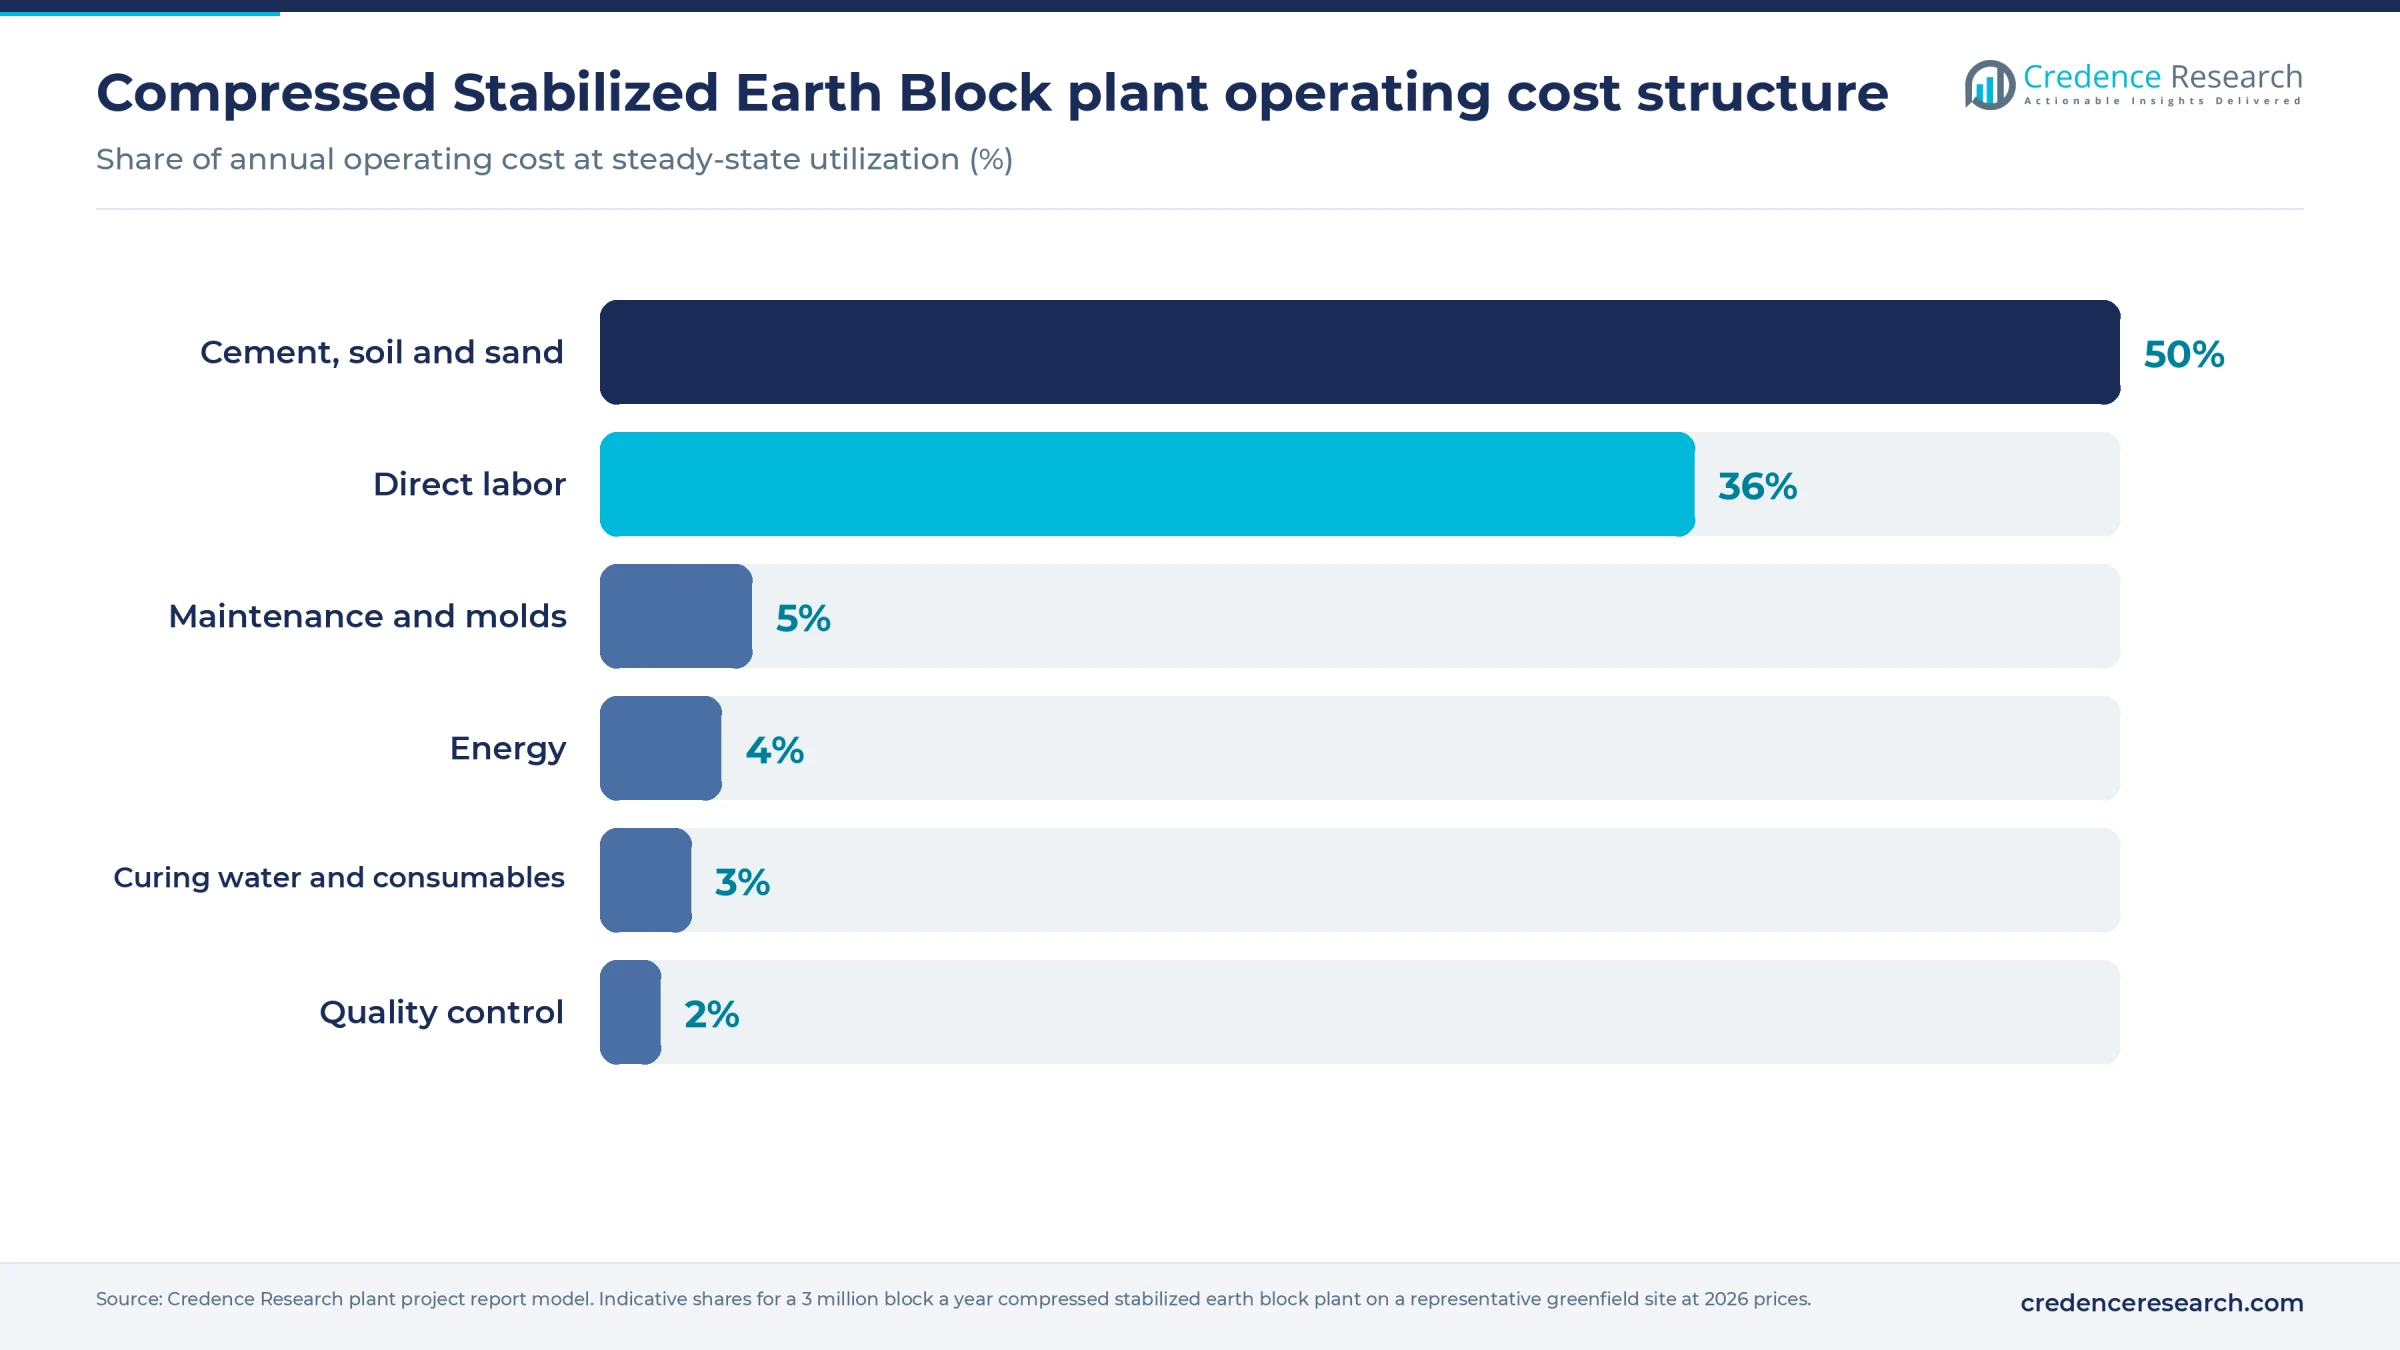
Cement alone is more than a quarter of production cost, which makes the stabilizer dose the main lever on unit cost.
Machinery and raw materials for a compressed stabilized earth block plant
The equipment list is short: a soil pulverizer or crusher, vibrating screen, wheel loader for the stockpile, batching hoppers, one or two pan or paddle mixers, belt conveyors, motorized hydraulic block presses with interchangeable molds for solid, hollow and interlocking blocks, pallets and curing racks, plastic covers and sprinklers, a forklift, a generator, and a laboratory with sieves, a drying oven and a compression testing machine. Detailed equipment specifications and costs are available in the report.
Soil is local by definition. Lateritic and sandy-clay subsoils suited to pressing are widespread across India, Sub-Saharan Africa, Brazil and Southeast Asia, while producers in Belgium, France and the United Kingdom now draw on soil excavated from urban building sites. Sand is bought nearby when the soil is too clayey.
The stabilizer is the only traded input. Cement is produced in almost every country, with China, India, Vietnam, Turkey and the United States the largest producers, and normally comes from a regional mill. Plants buying portland cement for block stabilization in bulk silos rather than bags save on unit cost and handling. Lime, preferred for clayey soils and by makers chasing lower-carbon blocks, is widely made in China, the United States, India and Europe.
Compressed stabilized earth block business profit margin and ROI
Prices vary widely by region. Bengaluru sellers list 300 x 150 x 90 mm blocks at about USD 0.34–0.40 each before tax, while a January 2024 Kenyan building guide put interlocking soil blocks at KES 12–15, about USD 0.09–0.12, a price that reflects manual presses and on-site production. A tested, plant-made block is assumed to sell ex-works at USD 0.25–0.35. Against assumed production costs of about USD 0.18–0.20 per block at 70–90% utilization, gross margin runs about 20–45%.
Volume matters because labor is largely fixed. At 80% utilization, or 2.4 million blocks sold, and USD 0.28–0.33 per block, cash profit after an assumed USD 70,000 of selling and administration is about USD 150,000–275,000 a year, so payback on a mid-range investment of about USD 1.2 million falls near 4–8 years.
| Metric | Value |
|---|---|
| Gross margin | 20–45% |
| Payback period | 4–8 years |
| IRR (post-tax) | Available in report |
| NPV | Available in report |
| ROI | Available in report |
| DSCR | Available in report |
Block price is the main sensitivity. Each USD 0.02 change per block moves annual cash profit by about USD 48,000 at 2.4 million blocks, shifting payback by about one year at the higher price and by several years at the lower one.
How to start a CSEB business, licenses and approvals
A new plant needs business and tax registration, land use and building permits for the yard and sheds, a dust or air permit where crushing, screening and cement silos call for one, stormwater controls for stockpiles, the right to dig soil if it is quarried rather than bought, and worker protection against crystalline silica dust from dry soil handling. The product also needs documented strength and durability, since engineers and building officials ask for test results against a recognized specification.
| Market | Site and environmental | Product and building approval |
|---|---|---|
| United States | Local zoning and building permits; state air permit for crushing, screening and silo dust where state rules require; industrial stormwater coverage under EPA's Multi-Sector General Permit or a state equivalent; OSHA respirable crystalline silica standard, 29 CFR 1910.1053 | Usually approved by the local building official as an alternative material, often with the ASTM E2392 design guide; New Mexico's Earthen Building Materials Code sets a 300 psi minimum compressive strength and 50 psi modulus of rupture |
| European Union | National environmental and planning permits under member state law; silica dust exposure limits under the carcinogens directive, 2004/37/EC | No harmonized European standard, so CE marking arises only through a voluntary European Technical Assessment; national specifications such as France's XP P13-901, Spain's UNE 41410 and Germany's DIN 18940 for earth block masonry |
| India | Consent to Establish and Consent to Operate from the State Pollution Control Board; factory license under state factory rules; state minor mineral permit where earth is dug on site | IS 1725:2023 specification for stabilized soil blocks, the reference engineers and buyers test against |
Key CSEB manufacturers and recent developments
The industry splits into press makers, training centers and regional block producers. Press makers include Hydraform in South Africa, Advanced Earthen Construction Technologies in the United States, Makiga Engineering in Kenya, the Aureka workshop linked to the Auroville Earth Institute in India and many Chinese hydraulic press suppliers. Producers are mostly small regional firms, such as Earth Blocks India in Bengaluru, BC Materials in Brussels, which presses blocks from excavated soil, and earth4Earth in the United Kingdom. The 2024 liquidation of the Cycle Terre factory near Paris, after press breakdowns and cash shortfalls, shows that scale-up needs reliable machines and working capital.
Recent developments are few and small-scale:
- November 2025. Habitat for Humanity Great Britain reported that the Timange Ecobuild center launched by Habitat for Humanity Malawi in Blantyre had made more than 120,000 soil-stabilized blocks, some used for 45 homes after Cyclone Freddy.
- June 2026. earth4Earth opened its first UK factory in Sheffield to make compressed soil bricks with a lime-based binder, after raising GBP 6.5 million of private investment, and plans a larger UK plant in 2027.
- July 2026. Berlin engineering firm ZRS noted that Germany's DIN 18940:2023-06 now permits load-bearing earth block masonry up to building class 4, and said an English edition of the German earth building standards was planned.
What's inside the Compressed Stabilized Earth Block project report PDF
The report runs to 21 chapters. Open a chapter to see its sections.
1. Preface
2. Scope and Methodology
- 2.1 Objectives of the Study
- 2.2 Stakeholders
- 2.3 Research Methodology
- 2.4 Data Sources and Key Assumptions
3. Executive Summary
- 3.1 Market Snapshot
- 3.2 Project at a Glance (Capacity, CapEx, OpEx)
- 3.3 Key Financial Indicators (IRR, NPV, Payback, Break-even)
- 3.4 Feasibility Verdict
4. Product Overview
- 4.1 Compressed Stabilized Earth Block Definition and Properties
- 4.2 Grades and Specifications (BIS / ISO / ASTM)
- 4.3 HS Code and Classification
- 4.4 Key Applications
- 4.5 Substitutes
5. Global Compressed Stabilized Earth Block Market
- 5.1 Market Overview
- 5.2 Historical and Current Market Performance (Volume and Value)
- 5.3 Market Breakup by Grade / Type
- 5.4 Market Breakup by End-Use Industry
- 5.5 Market Breakup by Region
- 5.6 Market Drivers, Restraints and Trends
- 5.7 Value Chain Analysis
- 5.8 Market Forecast
6. Target Country Compressed Stabilized Earth Block Market Analysis
- 6.1 Demand and Supply Analysis
- 6.2 Installed Capacity vs Demand Gap
- 6.3 Import Dependence
- 6.4 Demand Forecast by End-Use
7. Trade Analysis
- 7.1 Imports by Volume, Value and Country
- 7.2 Exports by Volume, Value and Country
- 7.3 Trade Balance and Opportunities
8. Price Analysis
- 8.1 Historical Compressed Stabilized Earth Block Price Trends by Region
- 8.2 Raw Material / Feedstock Price Trends and Linkage
- 8.3 Price Forecast
- 8.4 Margins Across the Value Chain
9. Competitive Landscape
- 9.1 Market Structure
- 9.2 Key Players and Installed Capacities
- 9.3 Profiles of Key Players
- 9.4 Recent Developments (Expansions, M&A, New Plants)
10. Manufacturing Process and Technology
- 10.1 Comparison of Technology Routes
- 10.2 Selected Route and Process Flow Diagram
- 10.3 Unit Operations Involved
- 10.4 Chemical Reactions Involved
- 10.5 Mass Balance and Raw Material Requirements
- 10.6 Energy Balance
- 10.7 Quality Assurance Criteria and Technical Tests
- 10.8 By-products and Waste Handling
- 10.9 Technology Licensors / Providers
11. Project Details, Requirements and Costs
- 11.1 Land, Location and Site Development
- 11.1.1 Site Selection Criteria
- 11.1.2 Location Analysis
- 11.1.3 Land Requirement and Costs
- 11.1.4 Site Development Costs
- 11.2 Plant Layout
- 11.2.1 Layout Principles
- 11.2.2 Proposed Layout
- 11.2.3 Factors Influencing Layout
- 11.3 Civil Works and Buildings
- 11.4 Plant Machinery
- 11.4.1 Machinery Requirements and Specifications
- 11.4.2 Machinery Costs
- 11.4.3 Machinery Suppliers
- 11.5 Raw Materials
- 11.5.1 Requirements per Tonne of Output
- 11.5.2 Procurement and Sourcing
- 11.5.3 Costs
- 11.5.4 Suppliers
- 11.6 Packaging
- 11.6.1 Packaging Requirements
- 11.6.2 Packaging Costs
- 11.6.3 Packaging Suppliers
- 11.7 Storage and Material Handling
- 11.8 Transportation Requirements and Costs
- 11.9 Utilities
- 11.9.1 Power Requirements and Costs
- 11.9.2 Water Requirements and Costs
- 11.9.3 Steam, Fuel and Other Utilities
- 11.10 Manpower Requirements and Wages
12. Environment, Health, Safety and Sustainability
- 12.1 Effluent and Emissions Management
- 12.2 Hazard Classification and Safety Measures
- 12.3 Carbon Footprint
- 12.4 Green / Low-Carbon Process Options
13. Regulatory Procedures, Approvals and Certifications
- 13.1 Licences and Registrations
- 13.2 Environmental Clearances
- 13.3 Product Certifications (BIS, REACH, etc.)
- 13.4 Approval Timeline
14. Project Implementation Schedule
15. Project Economics
- 15.1 Capital Cost of the Project
- 15.2 Techno-Economic Parameters
- 15.3 Capacity Utilization and Ramp-up
- 15.4 Product Pricing and Margins
- 15.5 Income Projections
- 15.6 Expenditure Projections
- 15.7 Working Capital Requirement
- 15.8 Taxation
- 15.9 Depreciation
16. Financial Analysis
- 16.1 Projected Profit and Loss Account
- 16.2 Projected Cash Flow Statement
- 16.3 Projected Balance Sheet
- 16.4 Liquidity Analysis
- 16.5 Profitability Analysis (Payback, NPV, IRR, ROI)
- 16.6 Break-even Analysis
- 16.7 Debt Service Coverage Ratio (DSCR)
- 16.8 Sensitivity Analysis
- 16.9 Scenario and Uncertainty Analysis
17. Funding and Incentives
- 17.1 Means of Finance and Debt-Equity Structure
- 17.2 Loans and Financial Assistance
- 17.3 Government Schemes and Subsidies (PLI, State Policies)
18. Risk Assessment
- 18.1 Key Success Factors
- 18.2 Key Risk Factors
- 18.3 Risk Mitigation
19. Strategic Recommendations
20. Case Study of a Successful Venture
21. Appendix
- 21.1 Detailed Assumptions
- 21.2 Abbreviations
- 21.3 List of Tables and Figures
- 21.4 Sources
This page vs. the full report
| Data point | On this page (free) | In the full report |
|---|---|---|
| Total CapEx | One rounded range at one capacity | Exact figure at three capacities with a line-item breakup |
| CapEx breakup | Category shares (%) only | Cost, quantity and supplier for every machine |
| Operating cost | Share of raw materials, utilities and labor | Per-unit cost sheet with each input price and consumption |
| Profitability | Gross margin range and payback band | Exact IRR, NPV, ROI, break-even and DSCR |
| Financial statements | List of what is included | 10-year P&L, cash flow, balance sheet and Excel model |
| Sensitivity | One directional line | Full sensitivity and scenario tables |
| Process | Simplified flow diagram | Detailed process flow, mass and energy balance, operating conditions |
| Machinery | Names of the main machines | Specifications, capacity, cost and supplier list |
| Market | Headline size, growth and global demand | Segment, region, trade and price forecast tables |
| Suppliers and buyers | Supplier types and sourcing hubs | Named suppliers and buyers |
Compressed Stabilized Earth Block project report: FAQs
How much does it cost to set up a compressed stabilized earth block plant?
What is the profit margin in CSEB manufacturing?
What is the payback period for a CSEB plant?
How strong are compressed stabilized earth blocks?
What raw materials are needed to make CSEB?
What is the HS code for compressed stabilized earth blocks?
What approvals does a CSEB plant need?

About the analyst
Nisha Gupta, Senior Research Analyst
Nisha Gupta is a Senior Research Analyst at Credence Research Inc. who works across industry domains, including packaging, automotive parts and machinery. Her focus is the modelling engine behind each study: she builds quantitative market databases and econometric forecasting frameworks, and developed automated Excel-based market modelling templates that cut client turnaround time by 30%.
Related market research
- Concrete Block And Brick Manufacturing Market Size, Share and Forecast 2032
- Green Building Materials Market Size, Share and Growth Report 2032
- Portland Cement Market Size, Share, Growth and Forecast 2032
- Hydrated Lime Market Size, Share, Growth and Forecast 2032
- Bricks Market Size, Trends, Share, Growth and Forecast 2032
- Single-Family Housing Green Buildings Market Size, Share and Forecast 2032
More plant project reports
- Precast Concrete Manufacturing Plant Project Report (DPR) 2026
- Mycelium Brick Manufacturing Plant Project Report (DPR) 2026
- Bamboo Flooring Manufacturing Plant Project Report (DPR) 2026
- Bendable Concrete Manufacturing Plant Project Report (DPR) 2026
- Vitrified Tiles Manufacturing Plant Project Report (DPR) 2026
- Vinyl Flooring Manufacturing Plant Project Report (DPR) 2026