
Quick answer
A vitrified tiles plant making about 6 million sq m a year needs total CapEx of roughly USD 16–24 million in a South Asian or similar lower-cost industrial location, including land and working capital margin. Gross margin typically runs 17–30% of selling price, and payback falls in a 4–7 year band at about 85% utilization. Natural gas prices and export freight explain most of the spread, since energy can take nearly a third of operating cost.
Feasible near clay, feldspar and affordable gas with a dealer network or export buyers in hand; a plant competing on price alone in an oversupplied cluster faces thin margins.
Vitrified Tiles plant: key highlights
| Parameter | Indicative value | Note |
|---|---|---|
| Plant capacity | 6 million sq m per year | Two press and roller kiln lines, about 20,000 sq m a day over 300 days |
| Total CapEx | USD 16–24 million | South Asian or similar lower-cost site; land, machinery, building, working capital margin |
| Raw material share of operating cost | 30–38% | Clays, feldspar, quartz, glazes, inks and packaging; energy adds about 29% |
| Gross margin | 17–30% | After energy, labor and depreciation, on an assumed USD 4.20–5.00 per sq m ex-works |
| Payback period | 4–7 years | At about 85% utilization, including an assumed one-year ramp-up |
| IRR | Available in report | Post-tax, 10-year model |
| Break-even | Available in report | Capacity utilization basis |
Ranges assume a 6 million sq m a year plant on about 6 hectares in a South Asian or similar lower-cost industrial park, 2026 prices, about 85% utilization, an assumed USD 4.20–5.00 per sq m ex-works price, natural gas near USD 10 per MMBtu (assumed), and 88 rupees, NPR 133 and USD 1.08 per euro (assumed rates). U.S., EU or Gulf sites cost far more. The full report can be customized to any country.
What are vitrified tiles?
Vitrified tiles are ceramic tiles fired until the body partly turns to glass, which leaves water absorption at or below 0.5% by weight. That low porosity, classed as group BIa under the ISO 13006 tile standard, gives them high strength, frost resistance and stain resistance. They compete with natural stone and are close to identical to porcelain stoneware, the name more common in Europe and the Americas.
Several product types share the same body. Soluble salt tiles take color from salts absorbed into a polished surface. Double charge tiles press two layers of colored powder for a deeper wear layer. Full-body tiles carry color through the whole thickness. Glazed vitrified tiles, or GVT, and polished glazed tiles carry a digitally printed design under a glaze and now account for most new capacity. Sizes run from 600 × 600 mm to slabs of 1,200 × 2,400 mm and larger.
Under the Harmonized System, these tiles fall under HS code 690721, ceramic flags, paving, hearth or wall tiles with a water absorption coefficient not exceeding 0.5% by weight. Buyers include flooring dealers, housing developers, retail chains, commercial contractors and importers.
Vitrified tiles market overview and global demand
Credence Research values the global ceramic tiles market at USD 196.56 billion in 2024 and projects USD 353.17 billion by 2032, a 7.6% CAGR. That implies about USD 211.5 billion in 2025, derived from the 2024 figure and the CAGR. The premium end is covered in the luxury tiles market study.
Physical volumes tell a cooler story. World production statistics for 2024 put tile output at 14.95 billion sq m, down 6.2% from 15.94 billion in 2023, mainly because China cut about 820 million sq m. Asia still made 72.8% of the total, Europe 10.9% and the Americas about 9.6%. World exports fell 2.5% to 2.67 billion sq m, a third straight annual decline, with Asia shipping 1.47 billion and the EU 768 million.
India now sets the floor price in export markets. Its tile exports fell 10.9% to 525.3 million sq m in 2024, Ceramic World Review reported, yet porcelain and vitrified grades rose to more than 75% of volume, at an average of EUR 4.2 per sq m. The UAE, the United States and Iraq were the largest buyers by volume.
The lesson for an investor is that demand is broad but capacity is not scarce. Growth comes from housing in South Asia, the Middle East, Africa and Latin America, while mature markets buy on design and brand. A new plant needs a defined outlet, either a dealer network at home or tariff-aware export buyers, before it needs a kiln.
Vitrified tiles manufacturing process
Vitrified tile is made by the wet route, which grinds raw materials in water to get a fine, uniform body. The route is energy intensive, but it delivers the low porosity and flat large formats that buyers pay for.
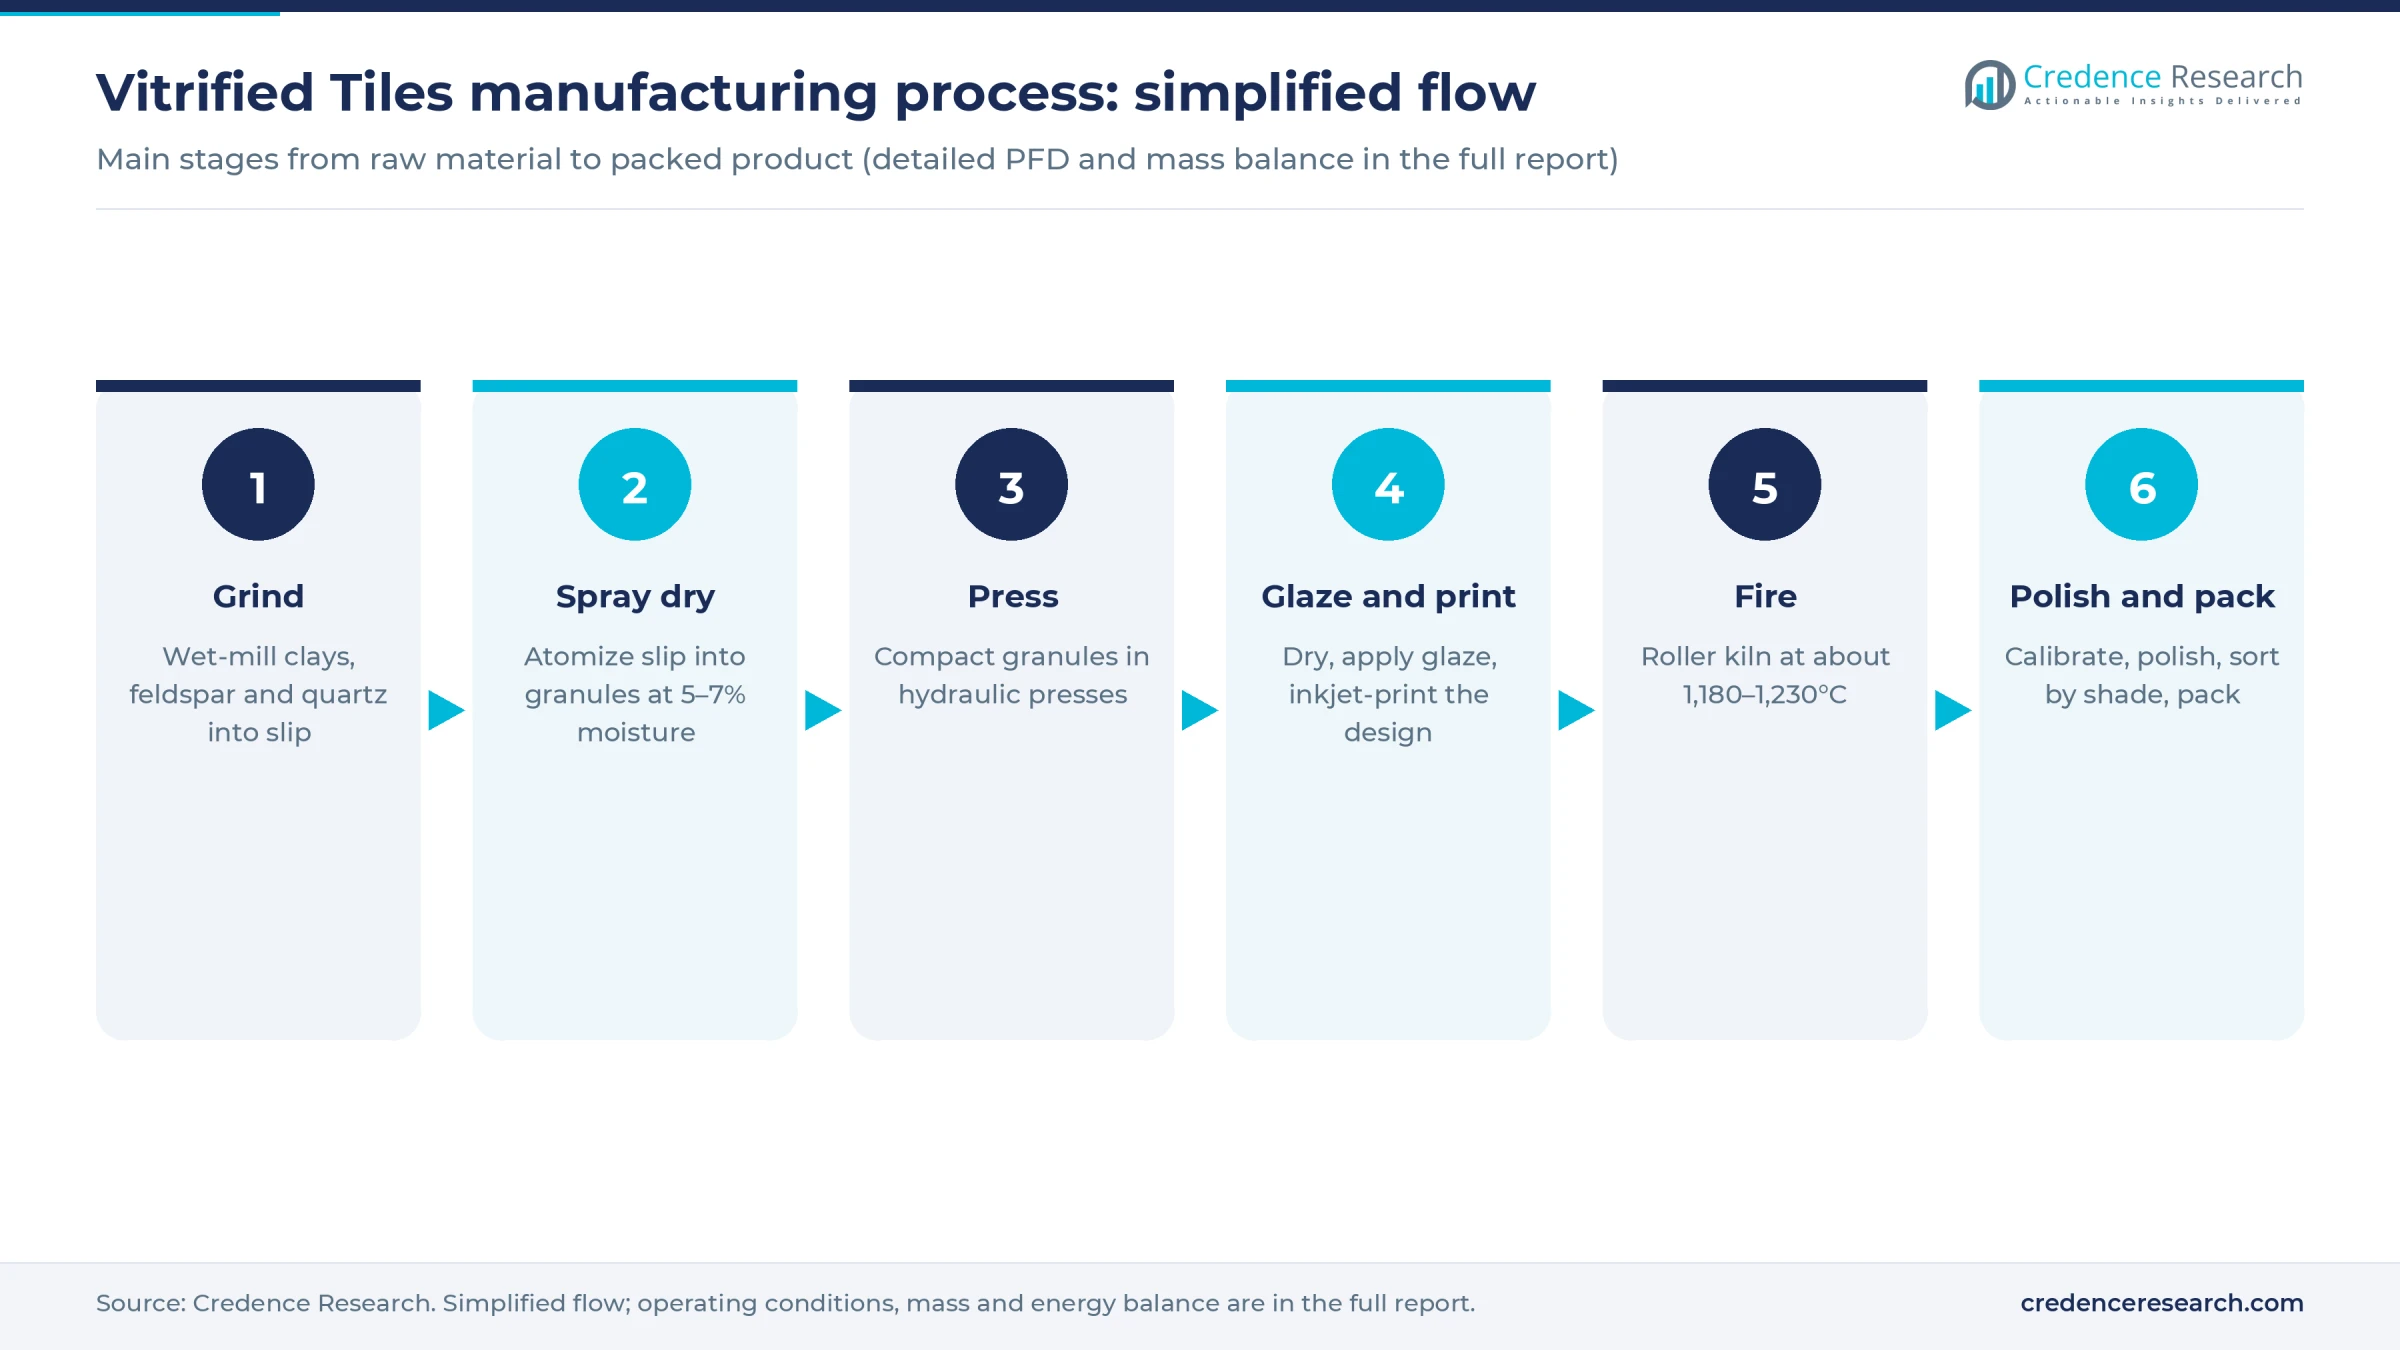
- Batching and wet grinding. Ball clay, kaolin, feldspar and quartz sand are weighed and ground with water in continuous ball mills into a slip.
- Spray drying. The slip is atomized into a hot-air tower, producing free-flowing granules at about 5–7% moisture. The spray dryer is one of the two largest users of natural gas on site.
- Silo storage and pressing. Granules rest in silos so moisture evens out, then hydraulic presses compact them at high pressure. Double charge lines lay a colored top layer first, and slab lines use continuous compaction belts instead of press molds.
- Drying, glazing and digital printing. Pressed tiles pass through dryers. For glazed grades, engobe and glaze are applied and inkjet printers lay down the design, which lets a plant change designs without new tooling.
- Firing. A long single-layer roller kiln fires the tiles at roughly 1,180–1,230°C on a cycle of about 40–70 minutes. Feldspar melts and fills the pores, the vitrification step that defines the product.
- Polishing and squaring. Polished grades are calibrated, ground with abrasive heads and edge-squared, and some receive a nano sealant.
- Sorting and packing. Automatic lines check flatness, size and shade, grade tiles by quality and pack them for dispatch.
Process water and polishing sludge are usually recycled into the body. Dust, kiln flue gases carrying fluorides and the heavy gas draw are the main environmental issues, and they shape permit conditions.
Vitrified tiles plant setup cost
For a plant rated at 6 million sq m a year, about 20,000 sq m a day over 300 working days on two press and kiln lines, total project cost is roughly USD 16–24 million in a South Asian or similar lower-cost industrial location. A greenfield vitrified tiles plant of about 8 million sq m in Nepal reached financial close in October 2023 at a project cost of about NPR 4 billion, roughly USD 30 million at an assumed NPR 133 to the dollar. Scaled to 6 million sq m, that points to about USD 22–25 million.
Additions at existing Indian sites cost less. Kajaria Ceramics approved about USD 19 million in July 2026 for 11 million sq m of glazed vitrified capacity, or USD 1.7 million per million sq m at an assumed 88 rupees to the dollar, before land and new utilities. It revised the estimate in October. Gulf, U.S. or EU sites cost far more: Saudi Ceramics budgeted USD 66.4 million in 2021 for 8.25 million sq m of porcelain tiles, about USD 8 million per million sq m. The full report can be customized to any country.
Land shows how the budget builds. Two lines with a large finished-goods yard, raw material sheds and a water recycling area need about 60,000 sq m. At an assumed USD 15–40 per sq m for a serviced plot in an Asian industrial park, land costs about USD 0.9–2.4 million, around 7% of the project.
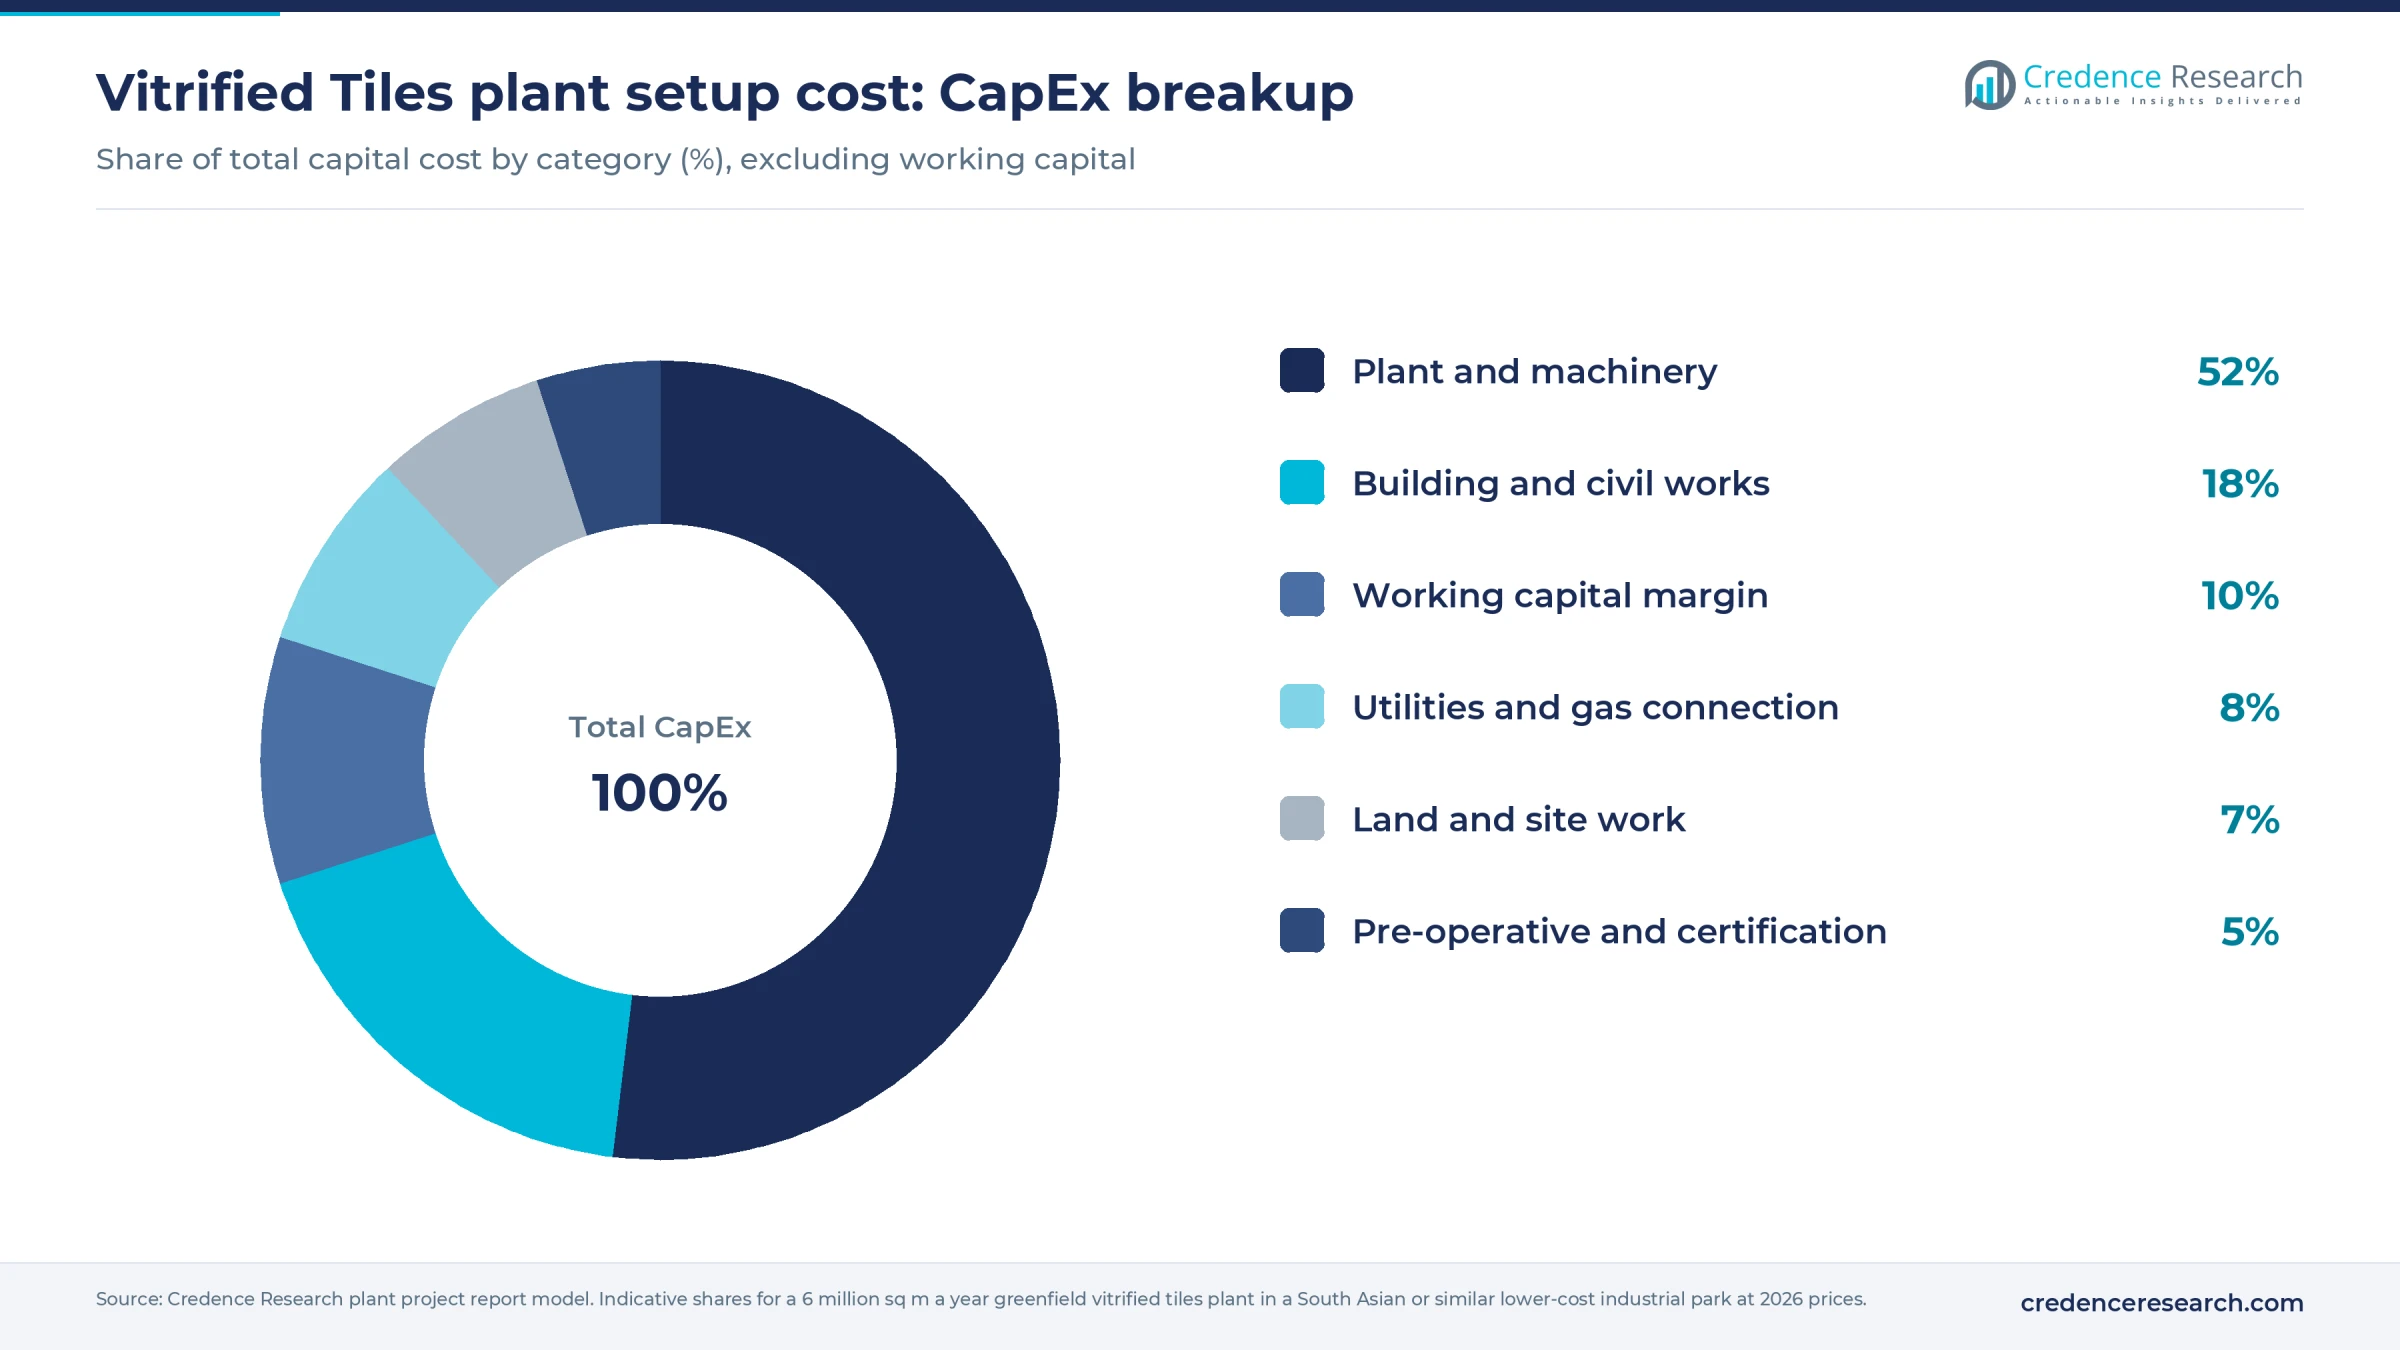
Machinery takes about half of spending, with presses, roller kilns, polishing lines and digital printers the costliest items. Working capital matters because dealers often take 60–90 days of credit (assumed) and the plant holds stock across many designs and shades.
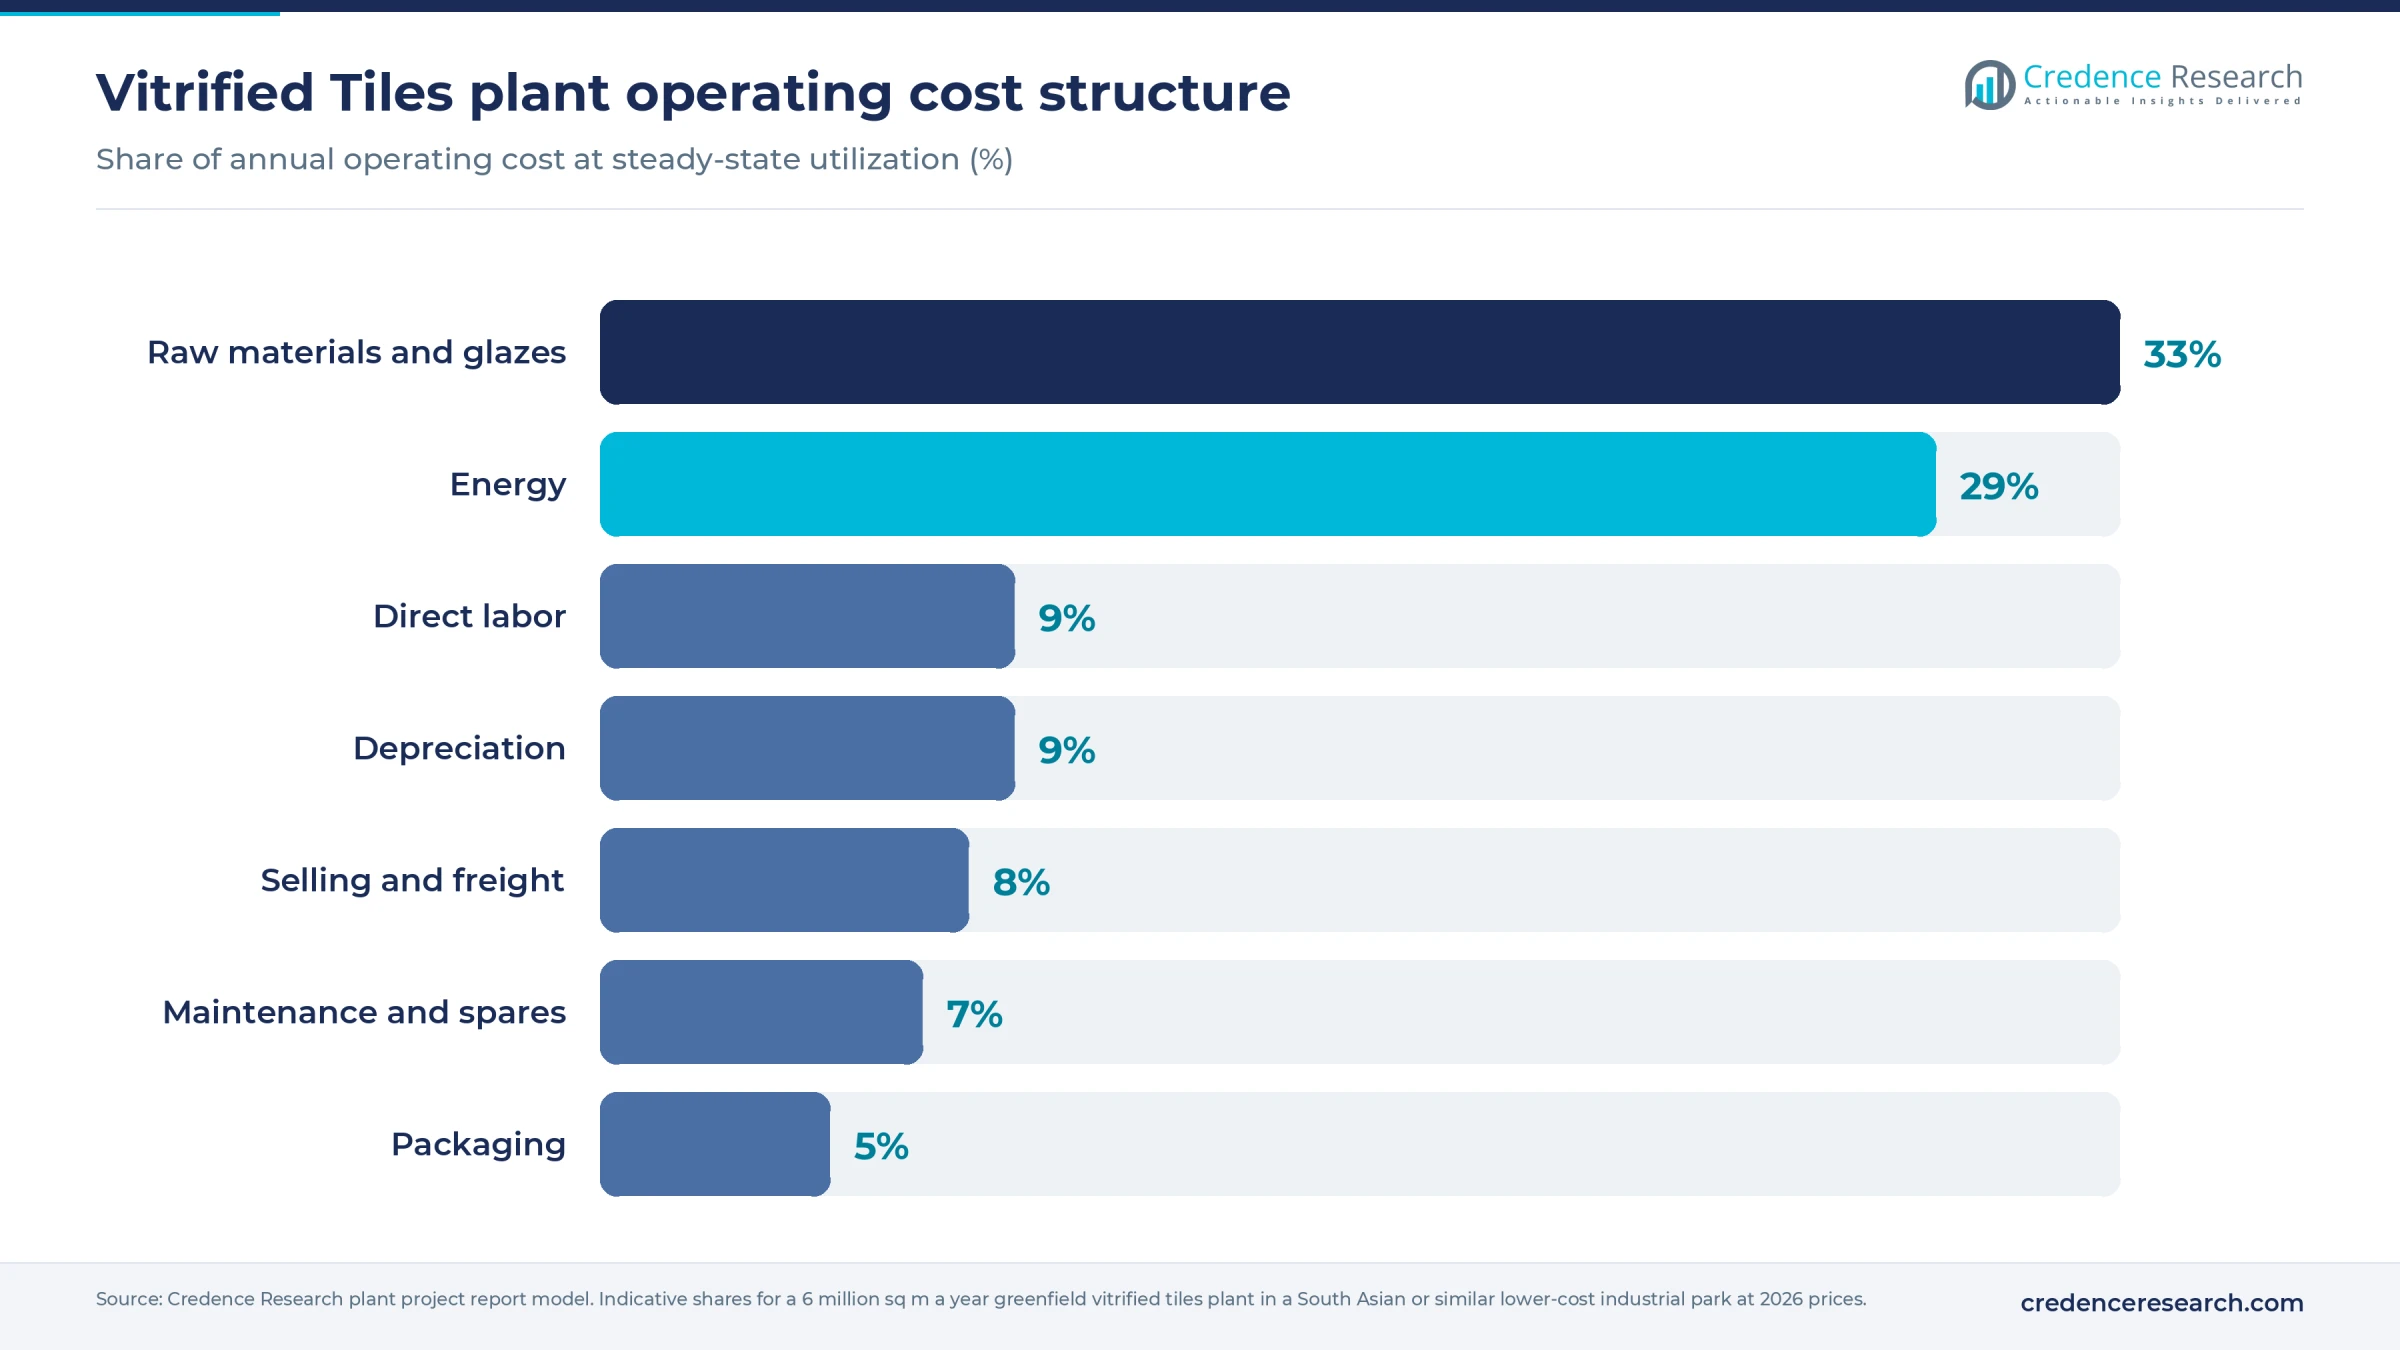
Operating cost splits between minerals and energy. A 9–10 mm tile weighs about 21 kg per sq m, and firing plus spray drying use about 2.2 cubic meters of natural gas per sq m (both assumed). A 20% rise in gas price adds about USD 0.17 per sq m, close to 4% of selling price, which is why plants cluster where gas is cheap and contracted.
Machinery and raw materials for a vitrified tiles plant
Core equipment for a two-line plant includes:
- Raw material feeders, continuous ball mills and slip tanks
- Spray dryer, granule silos and conveyors
- Hydraulic presses, or a continuous compaction line for slabs
- Dryers, glazing lines and digital inkjet printers
- Single-layer roller kilns
- Polishing, calibrating and squaring lines, sorting and automatic packing
- Water and sludge recycling, dust filters, compressors and a quality lab
Most heavy equipment comes from Italy, Spain and China, with Chinese lines usually cheapest. Machine costs and specifications are available in the report.
Raw materials come from these main regions:
- Feldspar: world output was about 31 million tons in 2025, led by India, Turkey, Iran, China and Italy, U.S. Geological Survey estimates show
- Ball clay and kaolin: Ukraine, Germany, the U.K., the United States, China and India; floor and wall tile takes 53% of U.S. ball clay use
- Quartz sand: widely available and normally bought locally
- Glazes, frits, opacifiers and inks: Spain, Italy, China and India, with zircon mainly from Australia and South Africa
Bulk minerals are cheap at the mine, about USD 110 per ton for U.S. feldspar and USD 47 for ball clay in 2025, so freight can double their delivered cost and favors sites near deposits. The kaolin supply outlook helps when weighing local against imported clays.
Vitrified tiles business profit margin and ROI
A plant running at about 85% utilization can expect gross margin of roughly 17–30% of selling price after energy, labor and depreciation. The price anchor is India's 2024 export average of EUR 4.2 per sq m for porcelain grades, about USD 4.50 at an assumed USD 1.08 per euro. A new entrant is assumed to sell at USD 4.20–5.00 ex-works, depending on format and finish.
Costs built from the bottom up come to about USD 3.50 per sq m. Body minerals, glaze and ink take about USD 1.25, energy about USD 1.10 and packaging USD 0.20 (all assumed), with labor, maintenance and depreciation making up the rest. Large polished glazed formats sit at the top of the range, and plain soluble salt tiles near the bottom.
At 5.1 million sq m sold, annual cash profit after selling costs and tax would be about USD 3.4–6.2 million. Against a USD 20 million midpoint, that gives a 4–7 year payback, including an assumed one-year ramp-up. The cheapest build at the highest profit pays back in about 3.5 years, and the costliest at the lowest profit in about 8.
Gas price, export freight and kiln utilization are the key sensitivities. A plant that cannot keep both kilns full loses margin quickly, because a roller kiln burns nearly as much gas half empty as full.
| Metric | Value |
|---|---|
| IRR | Available in report |
| NPV | Available in report |
| ROI | Available in report |
| DSCR | Available in report |
How to start a vitrified tiles business, licenses and approvals
A new plant needs business and tax registration, land use and building permits, an environmental permit covering kiln and spray dryer emissions, dust and wastewater, occupational safety registration with controls for crystalline silica dust, a gas supply contract and import-export registration. Finished tiles are then tested against national standards for water absorption, breaking strength and slip resistance.
Examples by market
| Market | Plant permits | Product rules |
|---|---|---|
| United States | State air permit; EPA hazardous air pollutant standards for clay ceramics plants, covering tile kilns, glaze lines and spray dryers at major sources; OSHA respirable crystalline silica standard | ANSI A137.1 tile specification, usually required by buyers and specifiers |
| European Union | Integrated permit under the Industrial Emissions Directive for ceramic firing above 75 tons a day or set kiln size thresholds; allowances under the EU Emissions Trading System for kiln and dryer carbon dioxide | CE marking and a declaration of performance under the Construction Products Regulation, against harmonized standard EN 14411 |
| India | State Pollution Control Board consent to establish and to operate; factory license from the state labor department; DGFT importer-exporter code | BIS standard IS 15622 for pressed ceramic tiles |
A 6 million sq m plant fires roughly 400 tons of tile a day, so in Europe it falls well inside both the integrated permit and carbon trading thresholds, and allowance costs become a real operating line. Requirements differ by country and state, so the site's regulator should confirm the list before equipment is ordered.
Key vitrified tiles manufacturers and recent developments
Chinese groups such as Monalisa, Marco Polo, Dongpeng and New Pearl lead global volume. Europe is led by Spain's Porcelanosa and Pamesa and Italy's Atlas Concorde, Florim and Marazzi, part of Mohawk Industries, which also owns Dal-Tile in North America. Lamosa in Mexico, Portobello in Brazil, RAK Ceramics in the UAE, Saudi Ceramics, and India's Kajaria, Somany and Asian Granito are major regional suppliers. All compete for floor space against stone, wood and vinyl in the wider flooring market.
Recent developments show established makers adding lines rather than new entrants building:
- July 2026: Kajaria Ceramics approved about USD 19 million (assumed rate) to add 11 million sq m of glazed vitrified capacity at Gailpur, Rajasthan, after a May plan for 10 million sq m at Srikalahasti. In October it raised Srikalahasti to 12.5 million sq m and revised both cost estimates.
- July 2026: Somany Ceramics approved up to about USD 6.7 million (assumed rate) for a 49% stake in Siravit Ceramics, a greenfield glazed vitrified plant of 9 million sq m a year in South India.
- September 2026: Grupo Lamosa raised the budget for a new tile plant in Tlaxcala, Mexico, to USD 220 million from USD 200 million, with phased construction due to start in November.
Because incumbents can add a line at a fraction of greenfield cost, a newcomer usually wins on location, freight or a niche format rather than on scale.
What's inside the Vitrified Tiles project report PDF
The report runs to 21 chapters. Open a chapter to see its sections.
1. Preface
2. Scope and Methodology
- 2.1 Objectives of the Study
- 2.2 Stakeholders
- 2.3 Research Methodology
- 2.4 Data Sources and Key Assumptions
3. Executive Summary
- 3.1 Market Snapshot
- 3.2 Project at a Glance (Capacity, CapEx, OpEx)
- 3.3 Key Financial Indicators (IRR, NPV, Payback, Break-even)
- 3.4 Feasibility Verdict
4. Product Overview
- 4.1 Vitrified Tiles Definition and Properties
- 4.2 Grades and Specifications (BIS / ISO / ASTM)
- 4.3 HS Code and Classification
- 4.4 Key Applications
- 4.5 Substitutes
5. Global Vitrified Tiles Market
- 5.1 Market Overview
- 5.2 Historical and Current Market Performance (Volume and Value)
- 5.3 Market Breakup by Grade / Type
- 5.4 Market Breakup by End-Use Industry
- 5.5 Market Breakup by Region
- 5.6 Market Drivers, Restraints and Trends
- 5.7 Value Chain Analysis
- 5.8 Market Forecast
6. Target Country Vitrified Tiles Market Analysis
- 6.1 Demand and Supply Analysis
- 6.2 Installed Capacity vs Demand Gap
- 6.3 Import Dependence
- 6.4 Demand Forecast by End-Use
7. Trade Analysis
- 7.1 Imports by Volume, Value and Country
- 7.2 Exports by Volume, Value and Country
- 7.3 Trade Balance and Opportunities
8. Price Analysis
- 8.1 Historical Vitrified Tiles Price Trends by Region
- 8.2 Raw Material / Feedstock Price Trends and Linkage
- 8.3 Price Forecast
- 8.4 Margins Across the Value Chain
9. Competitive Landscape
- 9.1 Market Structure
- 9.2 Key Players and Installed Capacities
- 9.3 Profiles of Key Players
- 9.4 Recent Developments (Expansions, M&A, New Plants)
10. Manufacturing Process and Technology
- 10.1 Comparison of Technology Routes
- 10.2 Selected Route and Process Flow Diagram
- 10.3 Unit Operations Involved
- 10.4 Chemical Reactions Involved
- 10.5 Mass Balance and Raw Material Requirements
- 10.6 Energy Balance
- 10.7 Quality Assurance Criteria and Technical Tests
- 10.8 By-products and Waste Handling
- 10.9 Technology Licensors / Providers
11. Project Details, Requirements and Costs
- 11.1 Land, Location and Site Development
- 11.1.1 Site Selection Criteria
- 11.1.2 Location Analysis
- 11.1.3 Land Requirement and Costs
- 11.1.4 Site Development Costs
- 11.2 Plant Layout
- 11.2.1 Layout Principles
- 11.2.2 Proposed Layout
- 11.2.3 Factors Influencing Layout
- 11.3 Civil Works and Buildings
- 11.4 Plant Machinery
- 11.4.1 Machinery Requirements and Specifications
- 11.4.2 Machinery Costs
- 11.4.3 Machinery Suppliers
- 11.5 Raw Materials
- 11.5.1 Requirements per Tonne of Output
- 11.5.2 Procurement and Sourcing
- 11.5.3 Costs
- 11.5.4 Suppliers
- 11.6 Packaging
- 11.6.1 Packaging Requirements
- 11.6.2 Packaging Costs
- 11.6.3 Packaging Suppliers
- 11.7 Storage and Material Handling
- 11.8 Transportation Requirements and Costs
- 11.9 Utilities
- 11.9.1 Power Requirements and Costs
- 11.9.2 Water Requirements and Costs
- 11.9.3 Steam, Fuel and Other Utilities
- 11.10 Manpower Requirements and Wages
12. Environment, Health, Safety and Sustainability
- 12.1 Effluent and Emissions Management
- 12.2 Hazard Classification and Safety Measures
- 12.3 Carbon Footprint
- 12.4 Green / Low-Carbon Process Options
13. Regulatory Procedures, Approvals and Certifications
- 13.1 Licences and Registrations
- 13.2 Environmental Clearances
- 13.3 Product Certifications (BIS, REACH, etc.)
- 13.4 Approval Timeline
14. Project Implementation Schedule
15. Project Economics
- 15.1 Capital Cost of the Project
- 15.2 Techno-Economic Parameters
- 15.3 Capacity Utilization and Ramp-up
- 15.4 Product Pricing and Margins
- 15.5 Income Projections
- 15.6 Expenditure Projections
- 15.7 Working Capital Requirement
- 15.8 Taxation
- 15.9 Depreciation
16. Financial Analysis
- 16.1 Projected Profit and Loss Account
- 16.2 Projected Cash Flow Statement
- 16.3 Projected Balance Sheet
- 16.4 Liquidity Analysis
- 16.5 Profitability Analysis (Payback, NPV, IRR, ROI)
- 16.6 Break-even Analysis
- 16.7 Debt Service Coverage Ratio (DSCR)
- 16.8 Sensitivity Analysis
- 16.9 Scenario and Uncertainty Analysis
17. Funding and Incentives
- 17.1 Means of Finance and Debt-Equity Structure
- 17.2 Loans and Financial Assistance
- 17.3 Government Schemes and Subsidies (PLI, State Policies)
18. Risk Assessment
- 18.1 Key Success Factors
- 18.2 Key Risk Factors
- 18.3 Risk Mitigation
19. Strategic Recommendations
20. Case Study of a Successful Venture
21. Appendix
- 21.1 Detailed Assumptions
- 21.2 Abbreviations
- 21.3 List of Tables and Figures
- 21.4 Sources
This page vs. the full report
| Data point | On this page (free) | In the full report |
|---|---|---|
| Total CapEx | One rounded range at one capacity | Exact figure at three capacities with a line-item breakup |
| CapEx breakup | Category shares (%) only | Cost, quantity and supplier for every machine |
| Operating cost | Share of raw materials, utilities and labor | Per-unit cost sheet with each input price and consumption |
| Profitability | Gross margin range and payback band | Exact IRR, NPV, ROI, break-even and DSCR |
| Financial statements | List of what is included | 10-year P&L, cash flow, balance sheet and Excel model |
| Sensitivity | One directional line | Full sensitivity and scenario tables |
| Process | Simplified flow diagram | Detailed process flow, mass and energy balance, operating conditions |
| Machinery | Names of the main machines | Specifications, capacity, cost and supplier list |
| Market | Headline size, growth and global demand | Segment, region, trade and price forecast tables |
| Suppliers and buyers | Supplier types and sourcing hubs | Named suppliers and buyers |
Vitrified Tiles project report: FAQs
How much does a vitrified tiles plant cost?
What is the profit margin in a vitrified tiles business?
What is the payback period for a vitrified tiles plant?
What is the HS code for vitrified tiles?
What raw materials does a vitrified tiles plant need?
Why does energy matter so much in tile making?
Which approvals does a vitrified tiles factory need?

About the analyst
Nisha Gupta, Senior Research Analyst
Nisha Gupta is a Senior Research Analyst at Credence Research Inc. who works across industry domains, including packaging, automotive parts and machinery. Her focus is the modelling engine behind each study: she builds quantitative market databases and econometric forecasting frameworks, and developed automated Excel-based market modelling templates that cut client turnaround time by 30%.
Related market research
- Ceramic Tiles Market Size, Share, Growth and Forecast to 2032
- Luxury Tiles Market Size, Share, Growth and Forecast 2032
- Flooring Market Size, Growth, Share, Trend and Forecast 2032
- Kaolin Market Size, Growth, Share and Forecast to 2032
- Hard Surface Flooring Market By Size, Share and Forecast 2032
- Stone Flooring Market Size, Share and Growth Report 2032
More plant project reports
- Bendable Concrete Manufacturing Plant Project Report (DPR) 2026
- Vinyl Flooring Manufacturing Plant Project Report (DPR) 2026
- Cement Manufacturing Plant Project Report (DPR) 2026
- Recycled Plastic Manufacturing Plant Project Report (DPR) 2026
- Whey Protein Manufacturing Plant Project Report (DPR) 2026
- Notebook Manufacturing Plant Project Report (DPR) 2026