
Market Overview
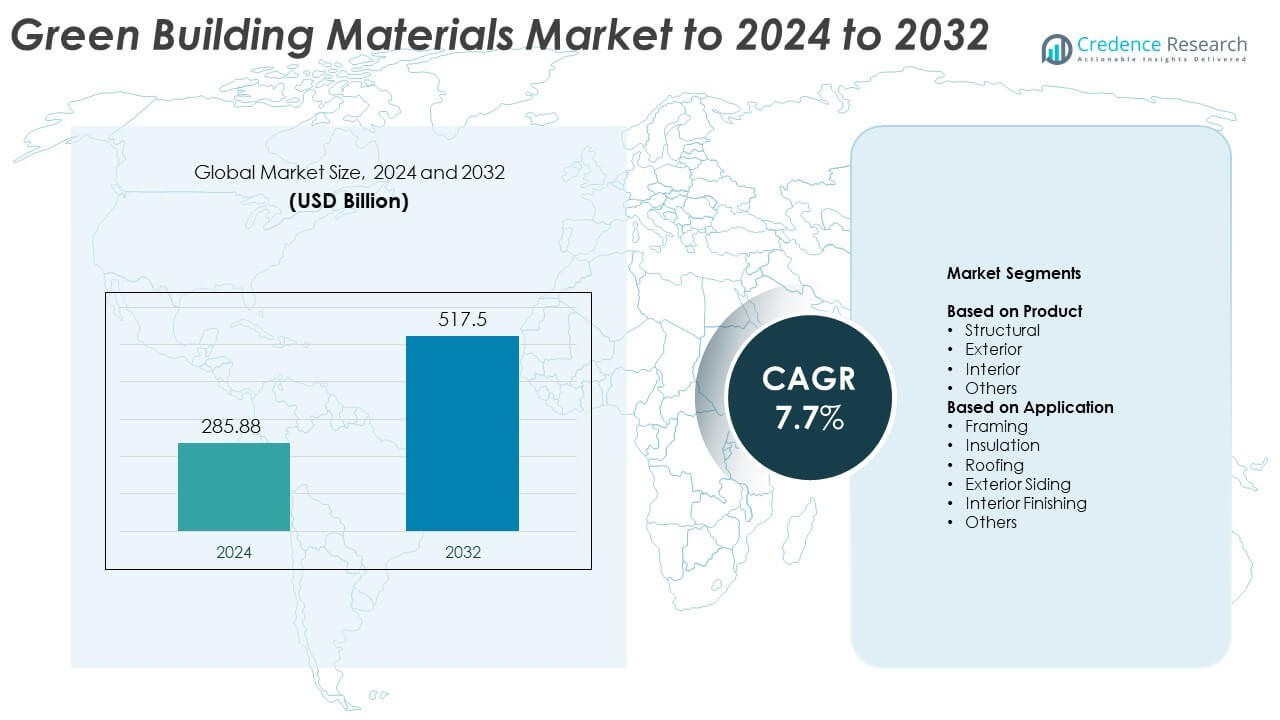
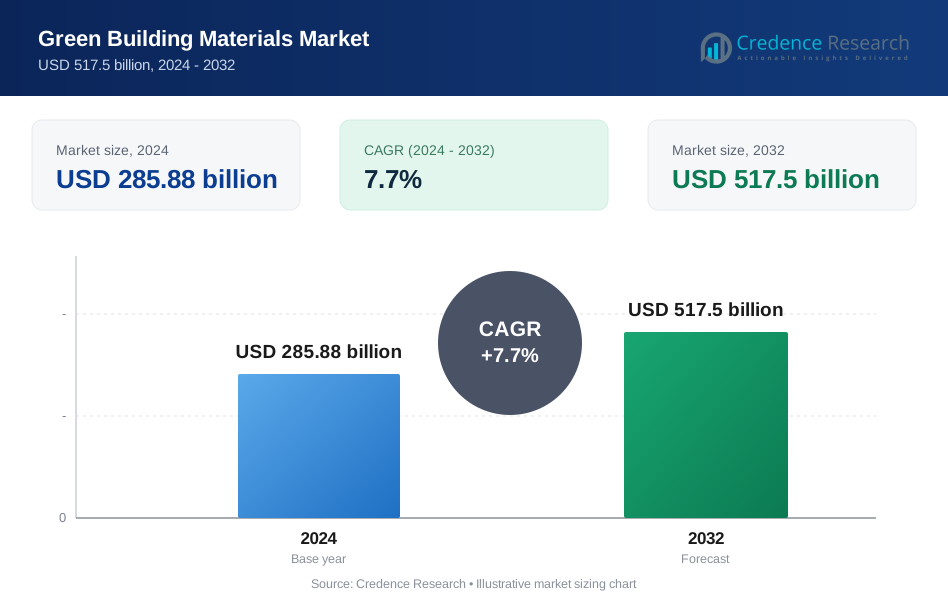
Green Building Materials Market size was valued USD 285.88 Billion in 2024 and is anticipated to reach USD 517.5 Billion by 2032, at a CAGR of 7.7% during the forecast period.
| REPORT ATTRIBUTE | DETAILS |
|---|---|
| Historical Period | 2020-2023 |
| Base Year | 2024 |
| Forecast Period | 2025-2032 |
| Green Building Materials Market Size 2024 | USD 285.88 Billion |
| Green Building Materials Market, CAGR | 7.7% |
| Green Building Materials Market Size 2032 | USD 517.5 Billion |
The Green Building Materials Market is led by major players including BASF SE, Owens Corning, Kingspan Group plc, Saint-Gobain, Interface Inc., PPG Industries, Forbo Group, DuPont, RedBuilt LLC, BSW Group, Alumasc Group Plc, Bauder Ltd, CertainTeed Corporation, and Holcim. These companies are investing heavily in sustainable product innovation, focusing on recyclable, energy-efficient, and low-emission materials. They are expanding through mergers, green certifications, and smart material technologies to strengthen global market presence. Regionally, North America dominated the market in 2024 with a 35% share, supported by strict environmental regulations, strong consumer awareness, and extensive adoption of eco-friendly construction practices across both residential and commercial projects.
Market Insights
- The Green Building Materials Market was valued at USD 285.88 billion in 2024 and is projected to reach USD 517.5 billion by 2032, growing at a CAGR of 7.7%.
- Growth is driven by rising demand for energy-efficient structures, strict environmental policies, and expanding sustainable construction practices worldwide.
- Key trends include adoption of recycled and bio-based materials, digital design integration, and smart self-healing technologies in building systems.
- The market is competitive, with global players focusing on low-carbon materials, R&D investment, and green certification programs to enhance their presence.
- North America led with a 35% share in 2024, followed by Europe at 29% and Asia Pacific at 24%, while the structural product segment held the largest share at 41%.
Market Segmentation Analysis:
By Product
The structural segment dominated the Green Building Materials Market in 2024, holding around 41% share. Structural materials such as engineered wood, recycled steel, and insulated concrete form the foundation of sustainable construction. These materials reduce embodied carbon, enhance thermal performance, and support long-term building durability. Rising adoption of prefabricated and modular construction methods further boosts structural segment growth, driven by cost savings and waste reduction initiatives in both residential and commercial projects.
- For instance, West Fraser reported 75% renewable energy use across operations in 2024.
By Application
The insulation segment led the Green Building Materials Market in 2024 with a 32% share. Insulation materials, including cellulose, mineral wool, and spray foam, significantly improve building energy efficiency. Governments are enforcing stricter building codes to reduce energy consumption and emissions. The growing use of bio-based insulation and recycled content products supports sustainable design goals, while the rising demand for net-zero and passive buildings further accelerates adoption across both new constructions and retrofit projects.
- For instance, ISOVER documents mineral wool thermal conductivity of 0.030–0.040 W/(m·K).
Key Growth Drivers
Rising Demand for Energy-Efficient Buildings
The growing global focus on energy conservation is a primary driver for green building materials. Construction firms are increasingly adopting materials that reduce heat loss and improve insulation. Products like reflective roofing and high-performance windows help lower building energy consumption. Supportive government policies promoting energy-efficient designs and certifications, such as LEED and BREEAM, are further accelerating adoption across both residential and commercial projects.
- For instance, 3M reports varying energy savings for its window films depending on location, building, and film type. While some installers have cited savings of up to 19 kWh per square foot of glass, 3M's own documentation emphasizes that savings are context-dependent.
Government Regulations and Incentives for Sustainable Construction
Strict environmental regulations and incentives are pushing developers toward sustainable building practices. Many countries are introducing tax benefits and subsidies to promote eco-friendly materials in public infrastructure. These measures encourage investment in recycled, non-toxic, and renewable building resources. As urban areas expand, regulatory frameworks supporting low-carbon and circular construction are driving demand for certified sustainable materials.
- For instance, Kingspan completed a 51% stake acquisition of Steico in January 2024 to expand wood-fiber insulation.
Advancements in Green Material Technologies
Technological innovation is enabling the development of advanced materials that enhance durability and reduce emissions. Innovations in bioconcrete, recycled composites, and low-carbon cement are reshaping construction efficiency. Smart materials integrated with energy-monitoring systems offer improved environmental performance and cost savings. Continuous R&D by leading manufacturers is helping scale green material availability and performance reliability across large construction projects.
Key Trends and Opportunities
Integration of Smart and Self-Healing Materials
Smart and self-healing materials are emerging as major trends in sustainable construction. These materials repair minor cracks autonomously and extend the building’s lifespan, minimizing maintenance needs. Integration of sensors that monitor humidity, temperature, and air quality is improving indoor comfort and sustainability. The growing interest in intelligent material systems is creating opportunities for high-tech construction innovations.
- For instance, Penetron’s crystalline admixture can seal cracks up to 500 µm.
Growing Adoption of Circular Economy Principles
The transition toward a circular economy is influencing material selection and design strategies. Builders are focusing on materials that can be reused, recycled, or repurposed with minimal waste. Green certifications now emphasize lifecycle assessments and cradle-to-cradle models. This shift is fostering innovation in biodegradable and modular materials, promoting waste reduction and sustainable value chains.
- For instance, Holcim recycled 10.2 million tons of construction-demolition materials in 2024.
Key Challenges
High Initial Costs of Green Materials
Despite long-term energy savings, green materials often carry higher upfront costs than conventional alternatives. Limited economies of scale and complex manufacturing processes contribute to the price gap. Small and mid-sized builders face budget constraints, which slow adoption in emerging regions. Wider government support and material standardization could help bridge this cost divide over time.
Lack of Skilled Workforce and Awareness
A shortage of skilled labor and awareness limits effective use of green materials. Many construction professionals lack training in sustainable design techniques and eco-material applications. Insufficient education and limited availability of certified products create barriers to market expansion. Broader training programs and knowledge-sharing platforms are essential to accelerate widespread adoption.
Regional Analysis
North America
North America held the largest share of 35% in the Green Building Materials Market in 2024. The region’s dominance stems from strong regulatory support and advanced construction technologies. The U.S. and Canada are leading in LEED-certified projects and renewable material adoption. Increasing investments in sustainable residential and commercial developments are driving demand. Growing awareness of energy-efficient buildings and government incentives for low-emission construction further strengthen regional growth.
Europe
Europe accounted for 29% of the global market share in 2024, supported by stringent environmental regulations and green building standards. The European Green Deal and energy performance directives are promoting eco-friendly construction materials. Countries like Germany, the UK, and France are investing heavily in retrofitting and sustainable urban infrastructure. Rising use of recycled aggregates and low-carbon cement reinforces the market’s sustainability focus. Continuous innovation in insulation and façade systems contributes to regional expansion.
Asia Pacific
Asia Pacific captured a 24% share of the Green Building Materials Market in 2024, driven by rapid urbanization and government-led green initiatives. China, India, and Japan are prioritizing eco-conscious infrastructure to address energy consumption challenges. Growing investments in commercial complexes, smart cities, and green housing projects are fueling demand. Increasing adoption of bamboo-based materials and solar-integrated building products enhances regional sustainability efforts. Public-private partnerships and rising environmental awareness further support growth.
Latin America
Latin America represented an 8% share of the market in 2024, with steady progress in sustainable construction practices. Brazil and Mexico are leading regional adoption through eco-friendly residential and commercial projects. The rising availability of recycled and locally sourced materials is driving market growth. Supportive policies promoting green certifications are encouraging developers to adopt efficient construction solutions. Growing collaboration with international green building councils strengthens the region’s market presence.
Middle East and Africa
The Middle East and Africa accounted for 4% of the global share in 2024, driven by expanding sustainable construction in urban centers. The UAE and Saudi Arabia are focusing on green infrastructure within large-scale projects such as NEOM and Masdar City. Growing adoption of energy-efficient insulation and solar-integrated façades supports demand. Efforts to reduce carbon footprints and rising public investment in eco-friendly buildings are driving market expansion in this region.
Market Segmentations:
By Product
- Structural
- Exterior
- Interior
- Others
By Application
- Framing
- Insulation
- Roofing
- Exterior Siding
- Interior Finishing
- Others
By Geography
- North America
- Europe
- Asia Pacific
- Latin America
- Middle East
- Africa
Competitive Landscape
The Green Building Materials Market is highly competitive, featuring major players such as BASF SE, Owens Corning, Kingspan Group plc, Saint-Gobain, Interface, Inc., PPG Industries, Forbo Group, DuPont, RedBuilt, LLC, BSW Group, Alumasc Group Plc, Bauder Ltd, CertainTeed Corporation, and Holcim. Companies are focusing on sustainable innovation, developing products that enhance energy efficiency and reduce carbon footprints. Strategic mergers, collaborations, and R&D investments are expanding their presence across residential, commercial, and industrial construction segments. Manufacturers are emphasizing recyclable, bio-based, and low-emission materials to align with global green certification standards. Advancements in composite insulation, solar-integrated roofing, and eco-friendly coatings are driving competitive differentiation. Regional expansion and digital solutions for supply chain transparency are further strengthening market positions. With rising environmental awareness and stricter regulations, leading players are prioritizing life-cycle performance, smart design integration, and circular economy models to gain a long-term competitive edge in the evolving green construction landscape.
Key Player Analysis
- BASF SE
- Owens Corning
- Kingspan Group plc
- Saint-Gobain
- Interface, Inc.
- PPG Industries
- Forbo Group
- DuPont
- RedBuilt, LLC
- BSW Group
- Alumasc Group Plc
- Bauder Ltd
- CertainTeed Corporation
- Holcim
Recent Developments
- In 2024, Saint-Gobain Launched the FutuRE range in Indonesia, featuring low-carbon and recycled-material products.
- In 2024, BASF partnered with Takazuri to develop sustainable construction solutions in East Africa.
- In 2023, Kingspan Launched RMG600+ LEC raised access floor panels and the Tate Grid LEC structural ceiling solution.
Report Coverage
The research report offers an in-depth analysis based on Product, Application and Geography. It details leading market players, providing an overview of their business, product offerings, investments, revenue streams, and key applications. Additionally, the report includes insights into the competitive environment, SWOT analysis, current market trends, as well as the primary drivers and constraints. Furthermore, it discusses various factors that have driven market expansion in recent years. The report also explores market dynamics, regulatory scenarios, and technological advancements that are shaping the industry. It assesses the impact of external factors and global economic changes on market growth. Lastly, it provides strategic recommendations for new entrants and established companies to navigate the complexities of the market.
Future Outlook
- Demand for energy-efficient and low-carbon materials will continue to rise globally.
- Governments will strengthen green certification standards for construction projects.
- Technological innovation will enhance material durability and recyclability.
- Adoption of bio-based and recycled products will expand across major industries.
- Smart and self-healing materials will gain wider acceptance in sustainable buildings.
- Growing urbanization will drive investments in eco-friendly residential construction.
- Circular economy practices will shape future material design and waste management.
- Emerging economies will see increased green infrastructure development initiatives.
- Collaboration between manufacturers and developers will boost product standardization.
- Rising corporate sustainability goals will further accelerate market growth worldwide.
Request a Free Sample
Fill in your details and we'll send you a free sample report.
- Sample data tables & charts
- Research methodology
Need a Custom Version of This Report?
Tailor the scope, geography, or segments to your exact requirements.
- Custom geography or segment scope
- Direct access to our analyst team
Frequently Asked Questions
What is the current market size for Green Building Materials Market, and what is its projected size in 2032?
At what Compound Annual Growth Rate is the Green Building Materials Market projected to grow between 2025 and 2032?
Which Green Building Materials Market segment held the largest share in 2024?
What are the primary factors fueling the growth of the Green Building Materials Market?
Who are the leading companies in the Green Building Materials Market?
Which region commanded the largest share of the Green Building Materials Market in 2024?
Table of Content
Chapter 1. Report Introduction
- 1.1 Report Description & Purpose
- 1.1.1 Report Title & Market Definition
- 1.1.2 Unique Selling Propositions (USP) & Key Differentiators
- 1.1.3 Value Proposition for Stakeholders
- 1.2 Research Objectives
- 1.2.1 Market Sizing Objectives (Volume & Revenue) (Volume Where Applicable)
- 1.2.2 Segmentation Objectives
- 1.2.3 Competitive Intelligence Objectives
- 1.2.4 Forecast & Scenario Objectives
- 1.3 Report Scope
- 1.3.1 Green Building Materials Scope – Segments & Subsegments Covered
- 1.3.2 Geographic Scope – Regions & Countries Covered
- 1.3.3 Historical Period, Base Year & Forecast Period (2024; forecast to 2032)
- 1.3.4 Inclusions & Exclusions
- 1.4 Industry Classification & Applicable Codes
- 1.5 Currency, Measurement Units & Valuation Basis
- 1.6 Target Stakeholders
- 1.7 Limitations & Assumptions
Chapter 2. Executive Summary
- 2.1 Global Green Building Materials Market Snapshot
- 2.1.1 Market Size – Historical (2024) & Forecast (2024-2032) (2024: USD 285.88 billion → 2032: USD 517.5 billion)
- 2.1.2 Volume & Revenue – Global Totals (Volume Where Applicable)
- 2.1.3 Key Market Highlights – Top Five Facts
- 2.2 Green Building Materials Market Segmentation Snapshot
- 2.2.1 Market Split by Region – 2024 vs. 2032
- 2.3 Competitive Snapshot
- 2.3.1 Top 10 Players by Revenue Share – 2024
- 2.3.2 Top 10 Players by Volume Share – 2024 (Volume Where Applicable)
- 2.3.3 Recent Strategic Developments (18-Month Summary)
- 2.4 Key Investment Highlights & Strategic Conclusions
Chapter 3. Green Building Materials Market Dynamics & Industry Analysis
- 3.1 Market Overview & Context
- 3.1.1 Green Building Materials Market Position in the Broader Industry Value Chain
- 3.1.2 Demand Structure & Purchasing Dynamics
- 3.1.3 Market Maturity & Development Stage by Region
- 3.2 Green Building Materials Market Drivers
- 3.3 Green Building Materials Market Restraints & Challenges
- 3.4 Green Building Materials Market Opportunities
- 3.5 Porter's Five Forces Analysis
- 3.5.1 Threat of New Entrants
- 3.5.2 Bargaining Power of Suppliers
- 3.5.3 Bargaining Power of Buyers
- 3.5.4 Threat of Substitutes
- 3.5.5 Competitive Rivalry – Intensity Assessment
- 3.6 Green Building Materials Value Chain Analysis
- 3.6.1 Upstream – Key Inputs, Resources & Suppliers
- 3.6.1.1 Key Input/Resource 1
- 3.6.1.2 Key Input/Resource 2
- 3.6.1.3 Key Input/Resource 3
- 3.6.2 Midstream – Core Operations & Value Creation
- 3.6.2.1 Operating Model & Process Overview
- 3.6.2.2 Key Operating Locations & Capabilities by Company
- 3.6.3 Downstream – Market Channels & End Users
- 3.6.3.1 Direct Sales & Customer Engagement Channels
- 3.6.3.2 Indirect Sales, Intermediaries & Partner Channels
- 3.6.4 Value Chain Profitability Analysis
- 3.6.1 Upstream – Key Inputs, Resources & Suppliers
- 3.7 PESTEL Analysis
- 3.7.1 Political Factors
- 3.7.2 Economic Factors
- 3.7.3 Social Factors
- 3.7.4 Technological Factors
- 3.7.5 Environmental Factors
- 3.7.6 Legal Factors
- 3.8 Green Building Materials Supply Chain Analysis
- 3.8.1 Critical Input & Resource Availability Risk Assessment
- 3.8.2 Supplier & Operational Concentration Risk (Geographic Exposure)
- 3.8.3 Supply & Service Disruption Impact Analysis
- 3.9 Regulatory & Policy Landscape
Note: The regulatory and policy landscape section covers regulations based on their applicability to the market, Green Building Materials category, geography, and scope of the study. Only regulatory frameworks with a material impact on operations, compliance, trade, sustainability, or market access are analyzed in detail.
Chapter 4. Key Investment Pockets & Opportunity Analysis
- 4.1 Green Building Materials Market Attractiveness Analysis
- 4.1.1 By Region – Investment Attractiveness Matrix (Market Size × CAGR)
- 4.2 Absolute Revenue Growth Opportunity
- 4.2.1 By Region – Absolute Revenue Growth Through 2032
- 4.3 Incremental Demand Opportunity
- 4.3.1 By Region – Incremental Demand Through 2032
- 4.3.2 Segment – Incremental Demand
- 4.4 Emerging Submarket Opportunity Deep Dive (Subject to Applicability)
- 4.5 Priority Market Opportunity Scorecards
- 4.5.1 United States
- 4.5.2 Europe
- 4.5.3 Asia
- 4.5.4 Middle East & Africa
Note: Priority market opportunity scorecards reflect the geographic scope and strategic relevance of the study. Listed markets are indicative and may be adapted to the industry.
Chapter 5. Green Building Materials Cross-Border Trade & Market Access Analysis
- 5.1 International Trade & Cross-Border Activity Overview
- 5.1.1 Global Export Value by Country (2024)
- 5.1.2 Global Export Volume by Country (2024) (Volume Where Applicable)
- 5.1.3 Global Import Value by Country (2024)
- 5.1.4 Global Import Volume by Country (2024) (Volume Where Applicable)
- 5.1.5 Net Trade Balance by Country (2024)
- 5.2 Export Analysis – Segment
- 5.2.1 Category 1 (Applicable Classification Code)
- 5.2.2 Category 2 (Applicable Classification Code)
- 5.2.3 Category 3 (Applicable Classification Code)
- 5.2.4 Category 4 (Applicable Classification Code)
- 5.2.5 Category 5 (Applicable Classification Code)
- 5.3 Import Analysis – Segment
- 5.3.1 Category 1 (Applicable Classification Code)
- 5.3.2 Category 2 (Applicable Classification Code)
- 5.3.3 Category 3 (Applicable Classification Code)
- 5.3.4 Category 4 (Applicable Classification Code)
- 5.3.5 Category 5 (Applicable Classification Code)
- 5.4 Cross-Border Pricing & Transaction Benchmarks
- 5.4.1 Export Pricing – Segment & Country
- 5.4.2 Import Pricing – Segment & Source Country
- 5.4.3 Price Trends (2024)
- 5.5 Key Cross-Border Trade & Delivery Routes
- 5.5.1 Cross-Border Trade/Delivery Route 1
- 5.5.2 Cross-Border Trade/Delivery Route 2
- 5.5.3 Cross-Border Trade/Delivery Route 3
- 5.5.4 Cross-Border Trade/Delivery Route 4
- 5.5.5 Cross-Border Trade/Delivery Route 5
- 5.6 Trade Policy & Market Access Impact Assessment
- 5.6.1 Tariff & Non-Tariff Barriers
- 5.6.2 Regional Trade & Economic Integration Frameworks
- 5.6.3 Bilateral & Multilateral Trade Agreements
- 5.6.4 Cross-Border Operating, Licensing & Localization Requirements
Note: This chapter applies where cross-border trade or delivery is relevant to Green Building Materials. Goods, services, and digital offerings are assessed using applicable classifications and transaction measures. Import-export volumes, trade balances, and route analyses are included only where meaningful to the market.
Chapter 6. Competitive Landscape & Company Benchmarking
- 6.1 Green Building Materials Market Concentration & Structure
- 6.1.1 Herfindahl-Hirschman Index (HHI) – vs. 2024
- 6.1.2 Leading, Mid-Sized & Emerging Player Structure
- 6.1.3 Global, Regional & Local Player Dynamics
- 6.2 Green Building Materials Market Share Analysis – 2024
- 6.2.1 Global Revenue Share by Company
- 6.2.2 Global Volume Share by Company (Volume Where Applicable)
- 6.2.3 Regional Revenue Share
- 6.2.4 Market Share Evolution ( vs. 2024)
- 6.2.5 Company Market Share by Key Segment
- 6.2.6 Company Market Share by Customer Group
- 6.3 Operating Scale, Capacity & Infrastructure Analysis
- 6.3.1 Global Operating Scale & Supply Capacity
- 6.3.2 Resource Utilization & Operating Efficiency
- 6.3.3 Output, Service Delivery & Activity Metrics
- 6.3.4 Operating Footprint & Infrastructure Map
- 6.3.5 Planned Operational & Capacity Expansion
- 6.4 Green Building Materials Competitive Benchmarking Matrix
- 6.4.1 Revenue, Growth, Profitability & Operating Metric Comparison
- 6.4.2 Channel Revenue Mix
- 6.4.3 Geographic Revenue Exposure
- 6.4.4 R&D Intensity
- 6.4.5 Sustainability Maturity
- 6.5 Strategic Developments in Green Building Materials (Last 24 Months)
- 6.5.1 Mergers, Acquisitions & Divestments
- 6.5.2 New Products, Services & Solutions in Green Building Materials
- 6.5.3 Operational & Infrastructure Expansions
- 6.5.4 Strategic Alliances, Joint Ventures & Partnerships
- 6.5.5 Distribution Expansion & Market Entry
- 6.5.6 Sustainability & ESG Initiatives
- 6.6 Competitive Strategy Mapping
- 6.6.1 Leader, Challenger, Follower & Niche Classification
- 6.6.2 Pricing Strategy Comparison
- 6.6.3 Channel Strategy Matrix
Note: Strategic developments are included based on their materiality and the availability of reliable information.
Chapter 7. Global Green Building Materials Market – By Sales & Delivery Channel
- 7.1 Segment Overview
- 7.1.1 Volume & Revenue Split by Channel (2024 & 2032) (Volume Where Applicable)
- 7.1.2 Channel Mix Evolution (2024-2032)
Chapter 8. Regional Market Analysis – Global Overview
- 8.1 Global Regional Overview
- 8.1.1 Regional Volume Share (Volume Where Applicable)
- 8.1.2 Regional Revenue Share
- 8.1.3 Regional Volume by Region (Volume Where Applicable)
- 8.1.4 Regional Revenue by Region
- 8.1.5 Regional Forecast Through 2032
- 8.2 Cross-Regional Segment Analysis
- 8.2.1 By Sales & Delivery Channel
- 8.2.2 By Competitive Positioning & Price Tier
Chapter 9. North America Green Building Materials Market
- 9.1 United States
- 9.2 Canada
- 9.3 Mexico
Chapter 10. Europe Green Building Materials Market
- 10.1 Germany
- 10.2 France
- 10.3 Italy
- 10.4 United Kingdom
- 10.5 Spain
- 10.6 Poland
- 10.7 Russia
- 10.8 Netherlands
- 10.9 Belgium
- 10.10 Sweden
- 10.11 Denmark
- 10.12 Norway
- 10.13 Rest of Europe
Chapter 11. Asia Pacific Green Building Materials Market
- 11.1 China
- 11.2 India
- 11.3 Japan
- 11.4 South Korea
- 11.5 Thailand
- 11.6 Indonesia
- 11.7 Vietnam
- 11.8 Malaysia
- 11.9 Australia
- 11.10 Rest of Asia Pacific
Chapter 12. Latin America Green Building Materials Market
- 12.1 Brazil
- 12.2 Argentina
- 12.3 Colombia
- 12.4 Chile
- 12.5 Rest of Latin America
Chapter 13. Middle East Green Building Materials Market
- 13.1 Saudi Arabia
- 13.2 United Arab Emirates
- 13.3 Turkey
- 13.4 Israel
- 13.5 Iran
- 13.6 Rest of the Middle East
Chapter 14. Africa Green Building Materials Market
- 14.1 South Africa
- 14.2 Egypt
- 14.3 Nigeria
- 14.4 Morocco
- 14.5 Rest of Africa
Chapter 15. Green Building Materials Company Profiles
- 15.1 [Company 01]
- 15.1.1 Company Overview
- 15.1.2 Key Management Personnel
- 15.1.3 Products & Services Portfolio
- 15.1.4 Financial Performance
- 15.1.5 Key Market Focus & Geographic Presence
- 15.1.6 Recent Developments & Strategic Initiatives
Note: The company profile list is preliminary and may change based on research findings, market developments, data availability, and client requirements.
Chapter 16. Appendices
- Appendix A – List of Abbreviations & Acronyms
- Appendix B – Industry Classification Code Reference – Full Series
- Appendix C – Supply, Output & Operating Capacity Data Tables
- Appendix D – End-Use & Demand Base Tables
- Appendix E – Demand, Adoption & Usage Assumptions
- Appendix F – Pricing & Revenue Metric Reference Tables
- Appendix G – Company Operations & Infrastructure Database
- Appendix H – Cross-Border Trade & Activity Data Tables (Where Applicable)
- Appendix I – Regulatory Summary Tables
- Appendix J – Primary Research Participant List (Anonymized)
- Appendix K – Primary Research Questionnaire Framework
- Appendix L – Data Sources & Bibliography
- Appendix M – Market Size Divergence & Source Comparison
Chapter 17. Research Methodology
- 17.1 Research Framework & Philosophy
- 17.2 Secondary Research – Sources, Hierarchy & Data Extraction
- 17.3 Data Modeling – Bottom-Up & Top-Down Market Sizing
- 17.4 Primary Research – Stakeholder Framework, LOI & Sample Sizes
- 17.5 Forecast Methodology – Regression, Scenario & Sensitivity Analysis
- 17.6 Quality Control – Four-Layer Validation Framework
- 17.7 Limitations & Standard Assumptions
- 17.8 Disclaimer
