
Quick answer
A fish feed plant blends soybean meal, grains, fishmeal, oils and premixes into extruded floating or sinking pellets for tilapia, catfish, pangasius, carp and similar farmed species. This overview models a greenfield mill making 50,000 tonnes a year, with estimated CapEx of USD 9–20 million at an Asian site. Gross margin is estimated at 9–26%, driven mainly by ingredient prices, with payback at 3–8 years.
Viable for a mill placed inside a large fish farming cluster with ingredient buying skill and tight credit control; risky for a stand-alone plant selling commodity feed when fishmeal and soybean meal spike.
Fish Feed plant: key highlights
| Parameter | Indicative value | Note |
|---|---|---|
| Plant capacity | 50,000 tonnes of feed a year | About 167 tonnes a day over 300 days on two extrusion lines |
| Total CapEx | USD 9–20 million | Greenfield at an Asian site, scaled from disclosed mills; excludes working capital |
| Raw material share of operating cost | 84–89% | Soybean meal, grains and fishmeal at World Bank prices for fall 2026 |
| Gross margin | 9–26% | After ingredients and direct conversion; low end reflects the 2026 fishmeal spike |
| Payback period | 3–8 years | At 85% utilization; weak-margin years stretch it past 10 |
| IRR | Available in report | Post-tax, 10-year model |
| Break-even | Available in report | Capacity utilization basis |
Ranges assume a greenfield mill making 50,000 tonnes of extruded fish feed a year at an Asian industrial site, 85% utilization, 2026 prices, a 30% protein formula with 3% fishmeal, World Bank ingredient prices for September and October 2026 plus an assumed 8% landed premium, and an assumed ex-mill price of USD 650–720 per tonne. EUR converted at 1.07 and MYR at an assumed 4.2 per USD. The full report can be customized to any country or region.
What is fish feed?
Fish feed is a manufactured, nutritionally complete diet for farmed fish, made by grinding and blending plant proteins, grains, marine ingredients, oils, vitamins and minerals, then forming them into pellets that hold together in water. In fed aquaculture, feed is usually the largest farm cost, so a feed mill sells growth, survival and feed conversion as much as it sells tonnes.
Commercial products are grouped by species, life stage and pellet behavior. Floating extruded pellets suit tilapia, catfish and pangasius because farmers can watch fish eat and limit waste. Slow-sinking and sinking pellets serve carp, marine finfish and bottom feeders, while high-energy salmon and trout diets carry 25–35% fat and need vacuum coating.
Fish feed is classified internationally under HS code 230990, preparations of a kind used in animal feeding other than retail dog or cat food, with national schedules adding digits. Buyers are pond and cage farmers, integrated producers that own hatcheries and processing plants, and dealers that resell feed on credit across farming districts.
Fish feed market overview and global demand
Demand for fish feed follows the growth of fed aquaculture. The FAO's State of World Fisheries and Aquaculture 2026, published in June 2026, reported that aquaculture produced 103 million tonnes of aquatic animals in 2024, the first year above 100 million tonnes and 53% of all aquatic animal output.
On the feed side, the 2026 Alltech Agri-Food Outlook, released in April 2026, put world feed output at about 1.44 billion tonnes in 2025, up 2.9%. Aquaculture feed reached about 55.5 million tonnes, up 4.7%, making it the fastest-growing species segment, although it is still under 4% of all feed by volume.
Asia dominates both farming and feed milling. China is by far the largest producer, followed by Vietnam, India, Indonesia, Bangladesh and Thailand, while Ecuador's shrimp sector and Norway's and Chile's salmon sectors anchor large, high-specification feed industries in the Americas and Europe. Egypt and Nigeria lead in Africa, where much feed is still imported or made on farms. Because feed is bulky and sold close to ponds, most fish feed is consumed in the country where it is milled, and cross-border trade is a small share of output.
For context on the wider industry, Credence Research values the global compound feed market at USD 584.18 billion in 2024, growing at a 5.2% CAGR. That implies about USD 615 billion in 2025, a figure derived from the 2024 value and the CAGR rather than separately measured. Ingredient costs are tracked separately in the fishmeal supply and pricing outlook.
Fish feed manufacturing process
Most modern fish feed is extruded. Extrusion cooks the starch under heat, moisture and pressure, which binds the pellet, controls whether it floats or sinks and improves digestibility. Simpler pellet-press lines remain common for sinking carp and some shrimp feed, but they offer less control over density and water stability.
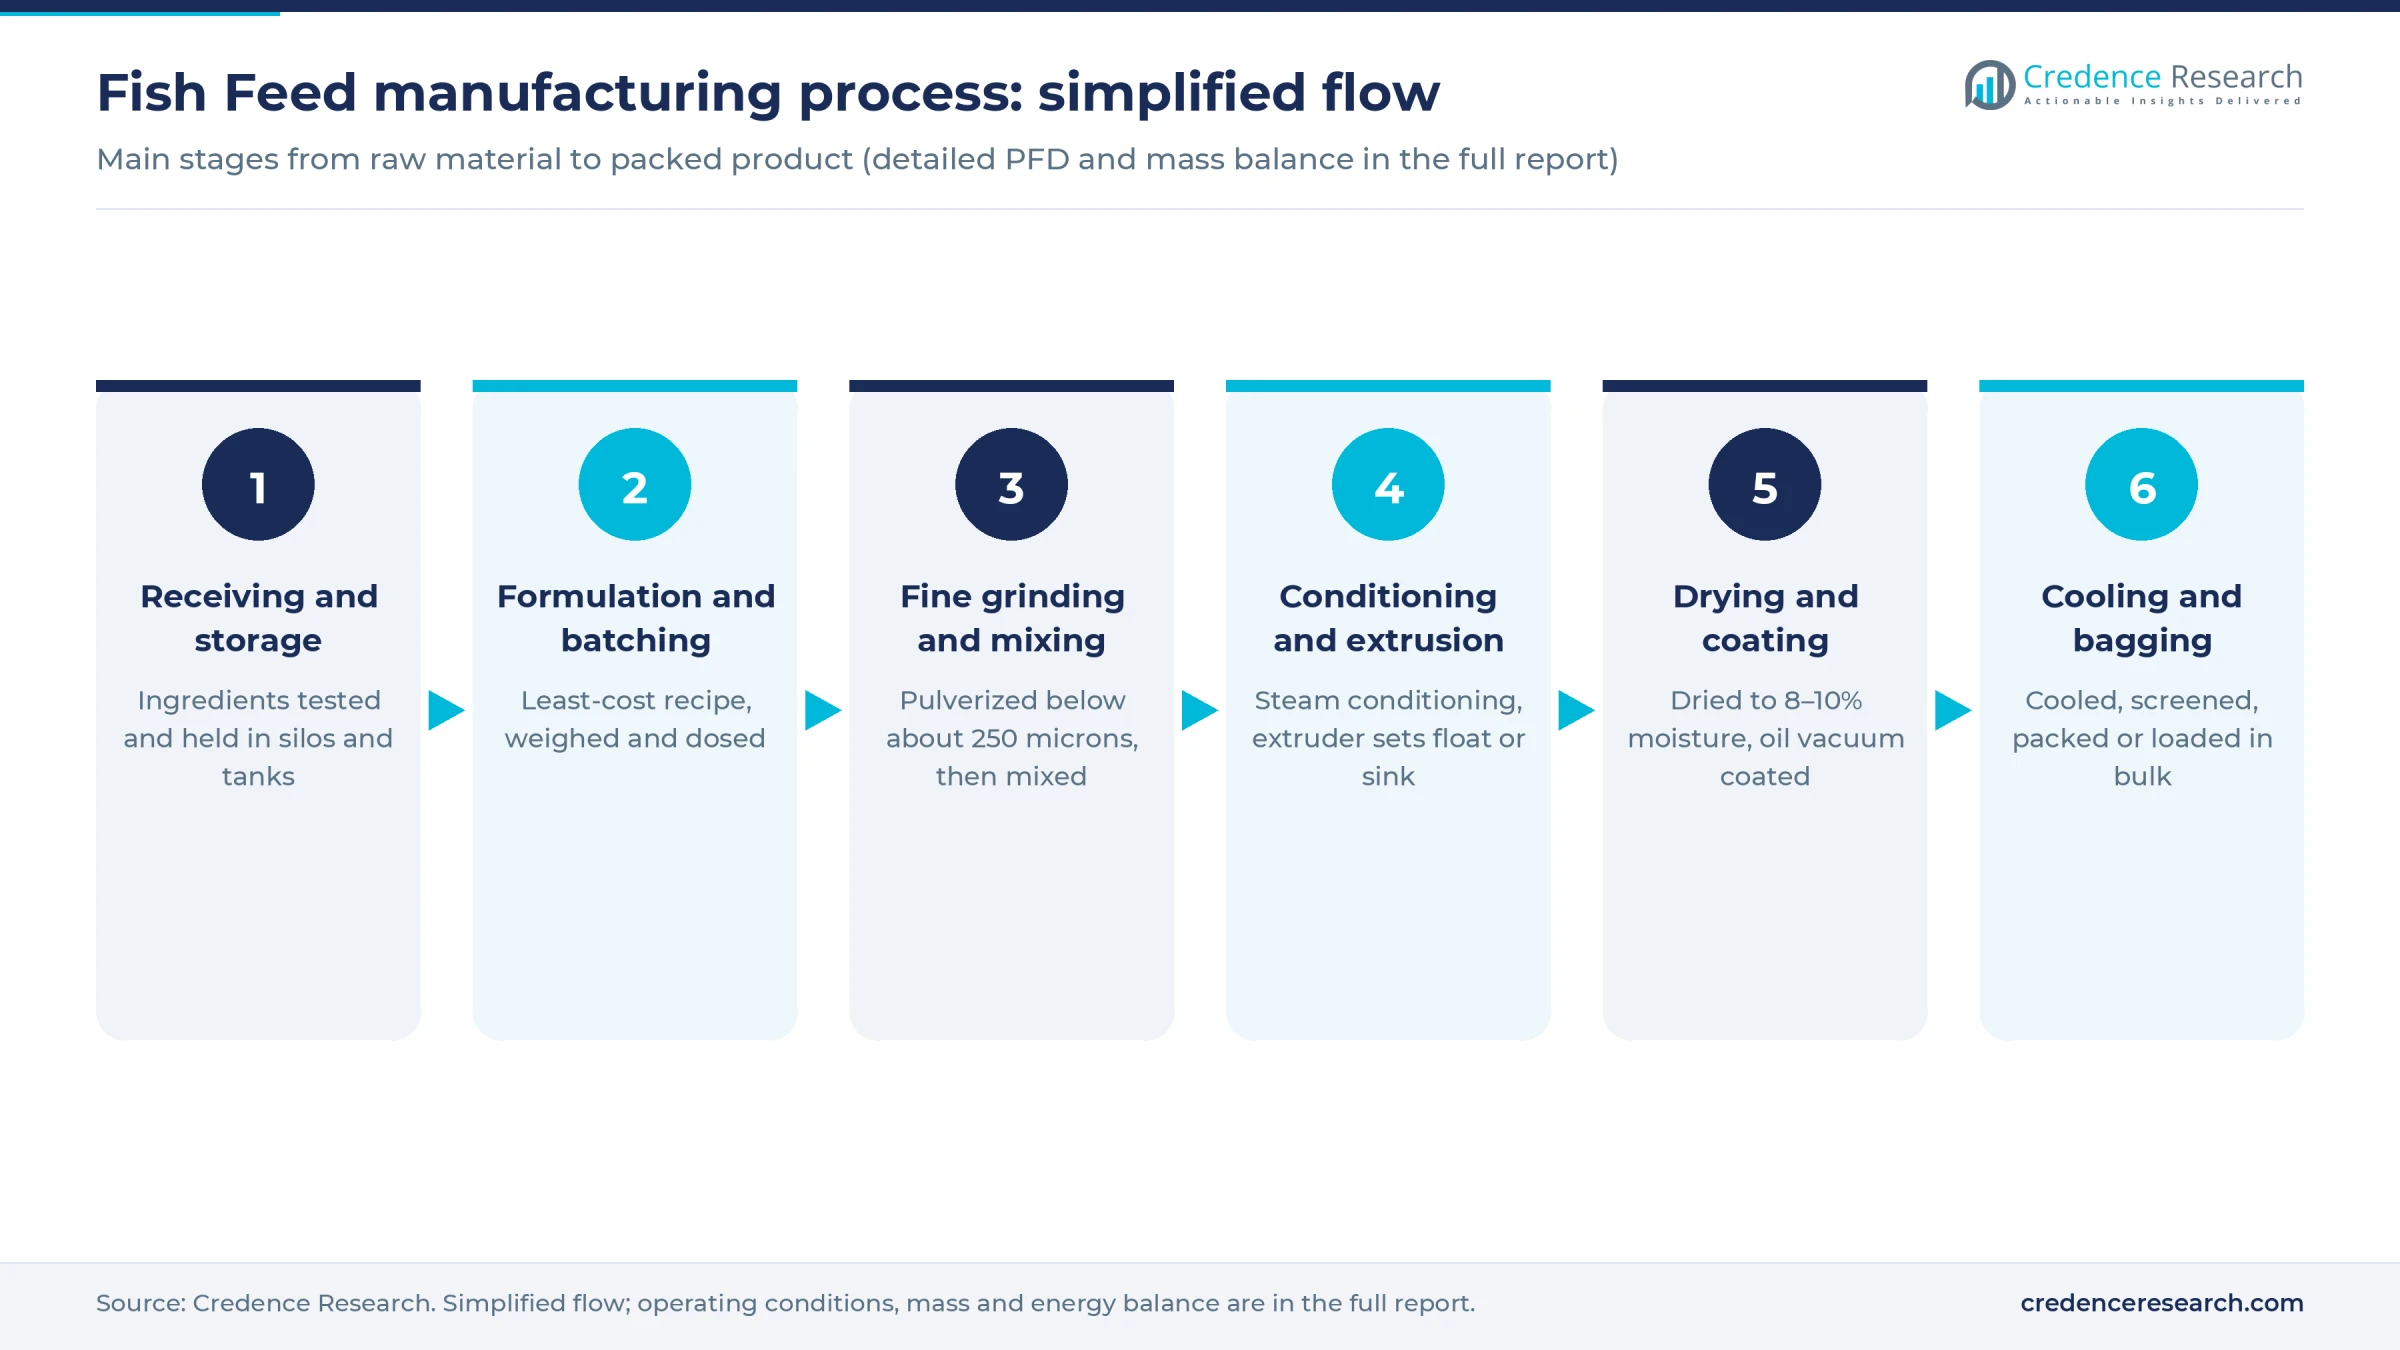
Receiving and storage. Soybean meal, corn, wheat, rice bran, fishmeal and oils arrive by truck or bulk vessel. Each lot is sampled for moisture, protein and mycotoxins, then held in silos, flat stores and heated oil tanks. Poor storage leads to mold and rancidity that no later step can fix.
Formulation and batching. Least-cost software sets each recipe against nutrient targets and the week's ingredient prices. Automatic scales dose macro ingredients, with micro-dosing for vitamins, minerals, binders and any approved additives.
Fine grinding and mixing. Fish feed needs far finer grinding than poultry feed, often to a particle size below about 250 microns, so a hammer mill or pulverizer is followed by sifting. Fine particles help the extruder form a smooth pellet and help small fish digest it. A batch mixer then produces a uniform mash.
Conditioning and extrusion. Steam and water raise moisture and temperature in a preconditioner before the mash enters a single- or twin-screw extruder. Die design, screw speed and moisture set pellet size and expansion, which decides whether the pellet floats, sinks slowly or sinks fast.
Drying and coating. A belt dryer brings moisture down to about 8–10% for safe storage. A vacuum coater then pushes oil into the pellet, which matters most for high-fat salmon and trout diets.
Cooling, screening and bagging. Pellets are cooled, screened to remove fines, which are recycled, then packed in 20–25 kg bags or loaded in bulk. Retained samples from each batch support complaints and traceability.
Fish feed plant setup cost
This overview models a greenfield mill producing 50,000 tonnes of extruded fish feed a year, about 167 tonnes a day over 300 days, using two extrusion lines of roughly 4–5 tonnes an hour each. Estimated total CapEx is USD 9–20 million at an Asian industrial site, excluding working capital.
The range comes from disclosed mills, scaled with a 0.65 capacity exponent. Skretting's Surat plant in India, opened in February 2023 at EUR 18.5 million for 50,000 tonnes a year on three lines, is about USD 20 million at the same capacity and sets the top of the range. Haid Group's 150,000-tonne Malaysian project, announced in August 2026 at RM 140 million, scales to about USD 16 million. Cargill's 90,000-tonne mill in Vijayawada, India, built in 2018 for more than USD 10 million, scales to about USD 9 million after cost escalation and sets the floor. The spread mostly reflects line count, automation and how much ingredient storage is built.
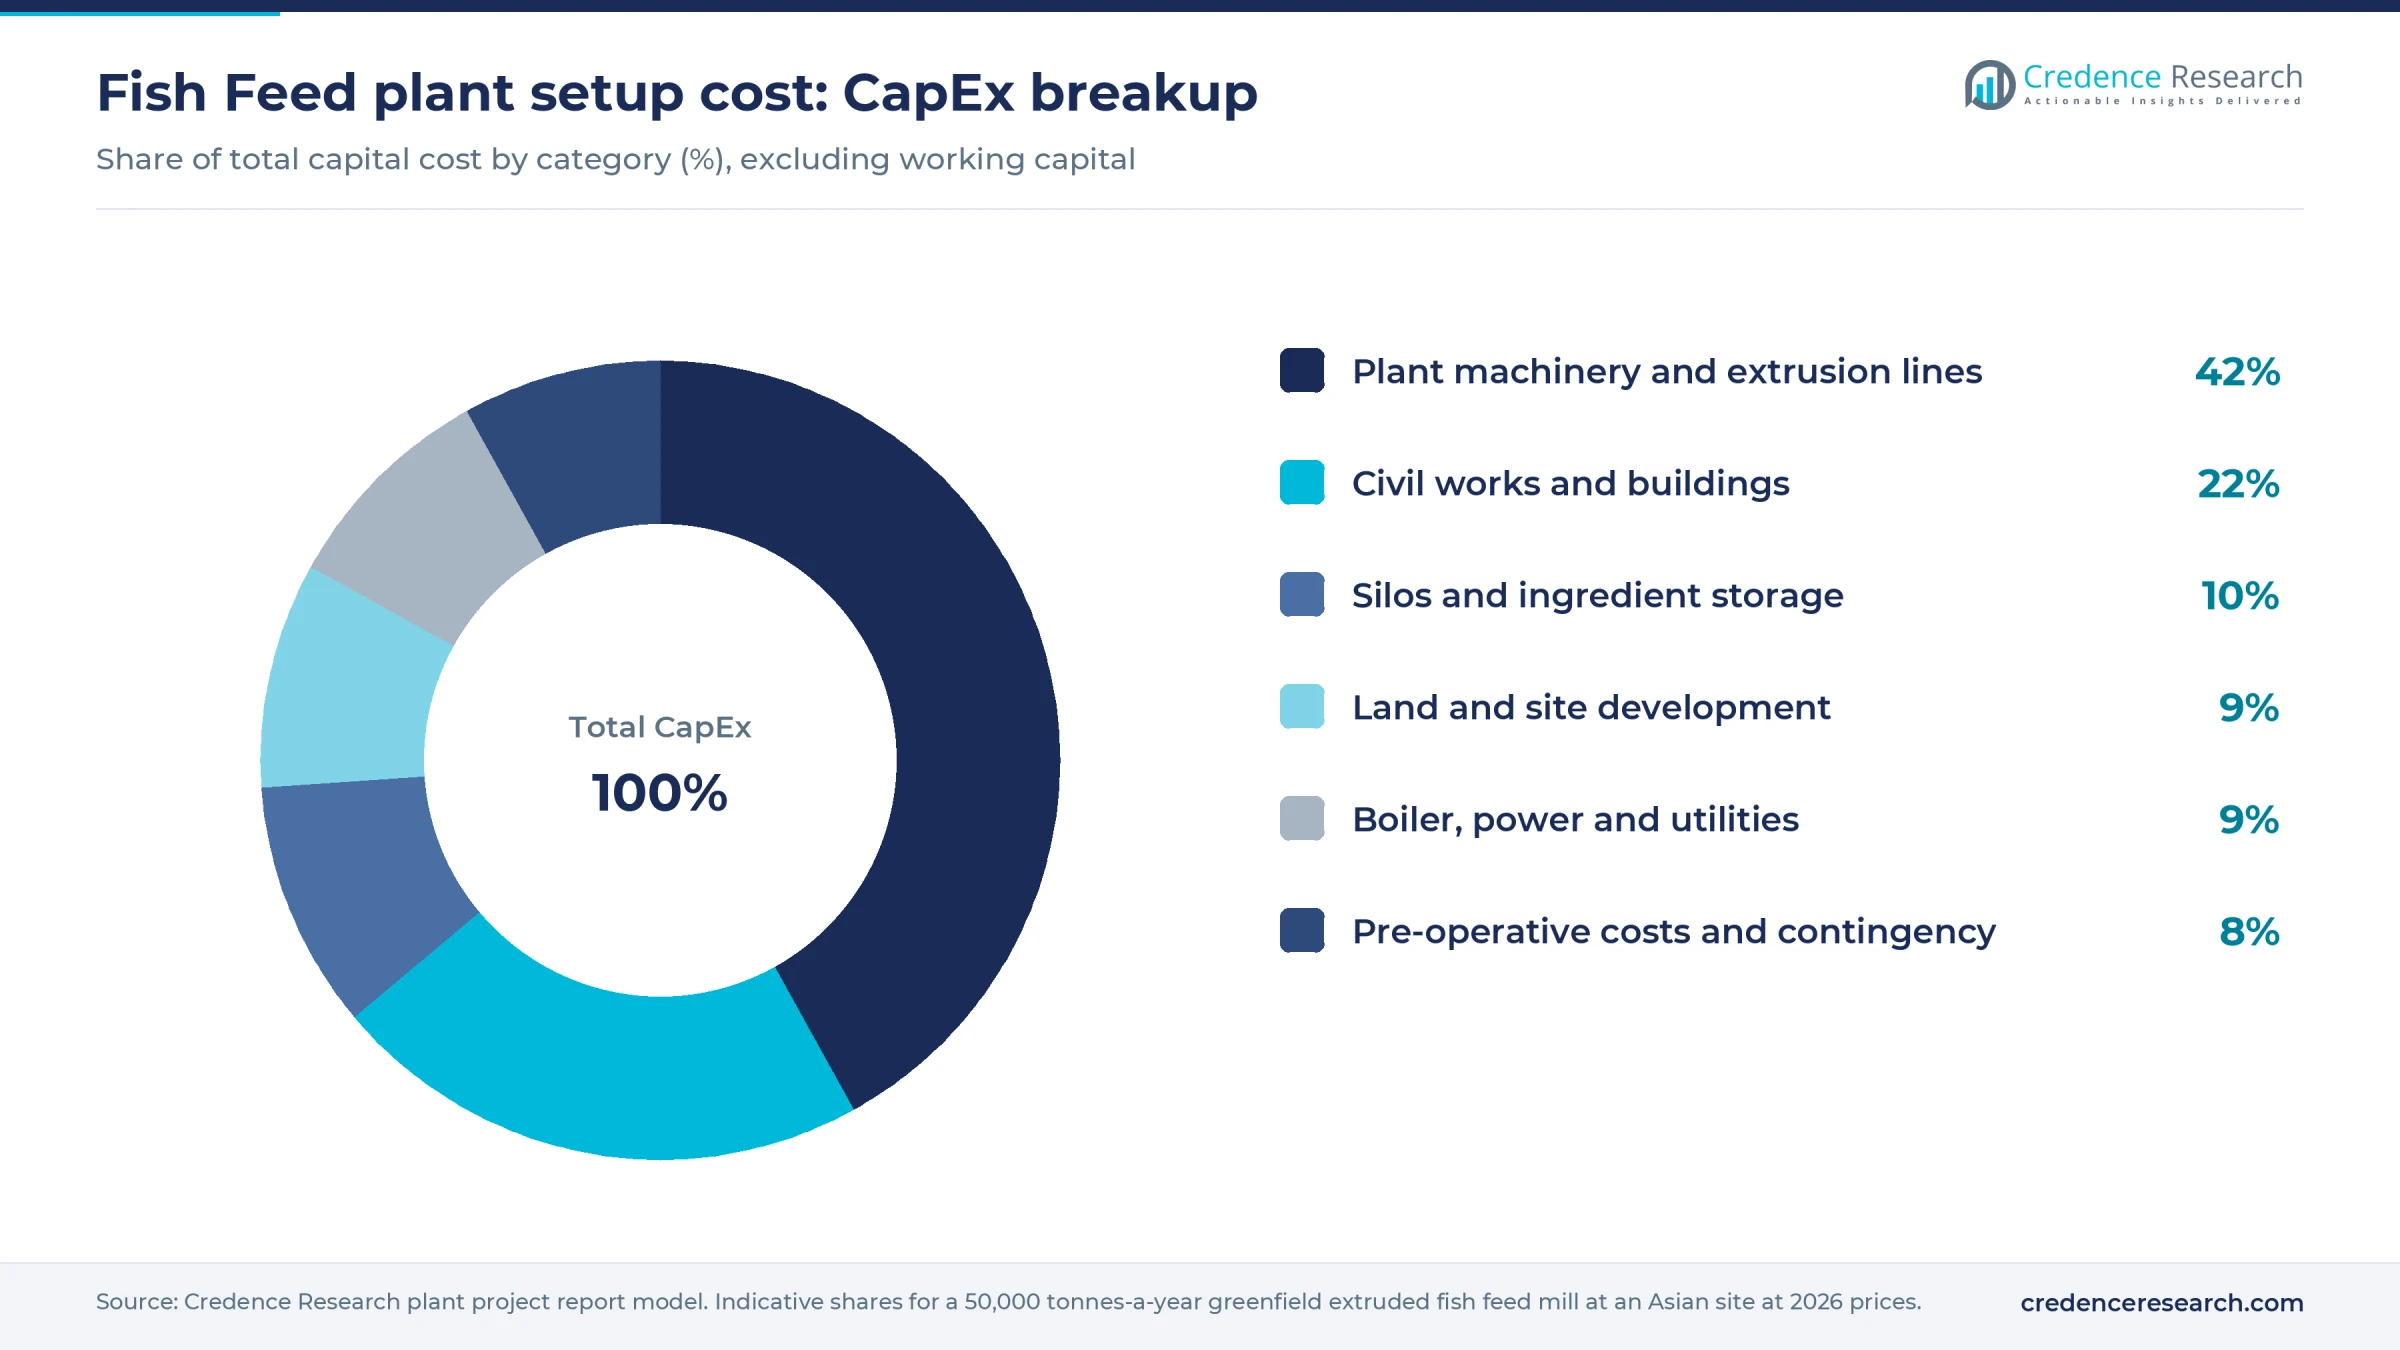
Worked example, land and site development. Skretting's 50,000-tonne mill occupies 20,000 square meters, so an assumed 2–3 hectares allows for silos, truck queues and later expansion. At an assumed USD 20–60 per square meter in an Asian industrial park, land costs USD 0.4–1.8 million. Site works add an assumed USD 0.3–0.6 million, so the row is about 8–12% of CapEx. An assumed USD 40–120 per square meter at a U.S. or EU site would mean USD 0.8–3.6 million for land alone, and higher construction and labor costs would likely put such a mill at or above the top of the range. The full report can be customized to any country.
Working capital is heavy because many fish farmers buy feed on 30–90 day credit. Inventory and receivables could tie up an estimated USD 3.5–7.5 million.
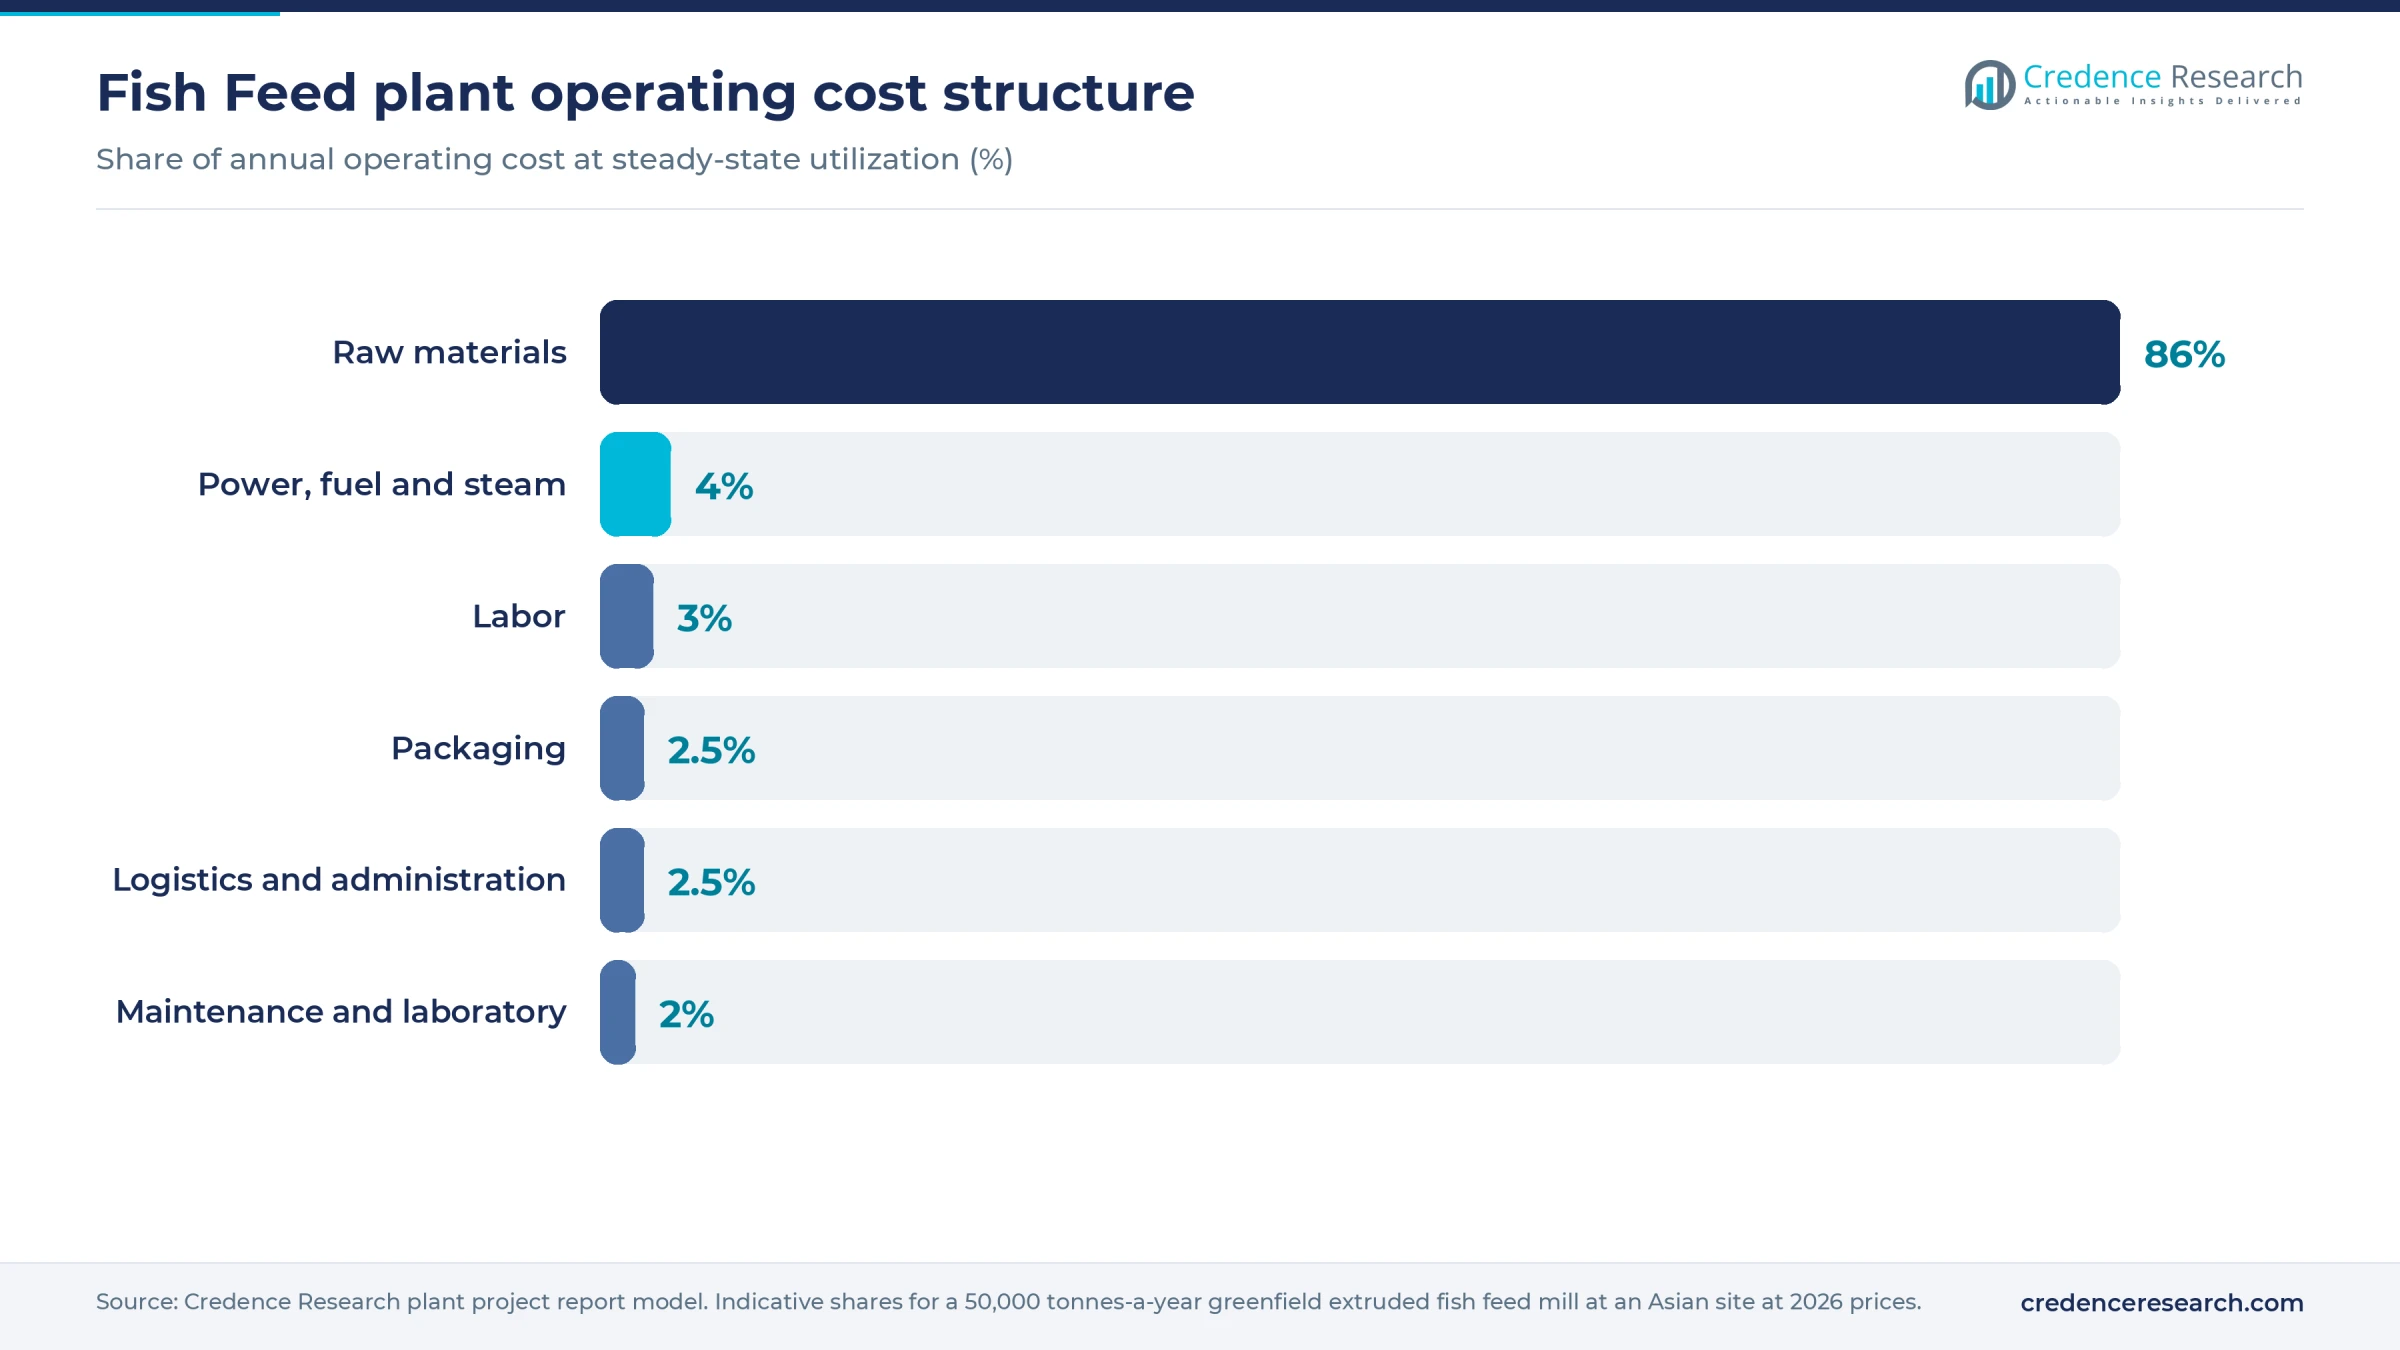
Ingredients take about 84–89% of operating cost.
Machinery and raw materials for a fish feed plant
A typical extruded fish feed mill uses the following equipment, sized in the full report:
- Intake pits, cleaners, magnets, bulk silos and oil tanks
- Hammer mills or pulverizers with sifters for fine grinding
- Batching scales, micro-dosing units and a paddle or ribbon mixer
- Preconditioners and single- or twin-screw extruders with interchangeable dies
- Belt dryers, vacuum coaters and counterflow coolers
- Rotary screens, crumblers for starter feed, bagging and palletizing machines
- Steam boiler, dust collection, compressed air and a quality control laboratory
The extruder and dryer set the mill's capacity and its energy bill, so they are usually bought from specialist suppliers even when other equipment is sourced locally.
Raw materials. Soybean meal is the main protein in most warm-water feeds and is sourced largely from Brazil, the U.S. and Argentina, either as meal or as beans crushed in China and other importing countries. Fishmeal and fish oil come mainly from Peru and Chile, with supply also from the U.S., Mauritania, Vietnam and India, while corn and wheat come from the U.S., Brazil, Ukraine, Argentina and the Black Sea region. Rice bran, broken rice and other local by-products come from Asian milling centers. Mills that can switch between protein sources, including rapeseed meal, poultry meal and insect or microbial proteins, are better protected when one ingredient spikes. Additive choices are reviewed in the aquafeed additives outlook.
Fish feed business profit margin and ROI
A fish feed mill earns the spread between its selling price and its formula cost. World Bank prices compiled by Protein Report show fishmeal rising from about USD 1,800 per tonne in early 2026 to about USD 2,900 in September 2026 after Peru halted anchovy fishing during a strong El Niño. Soybean meal was about USD 450 and corn about USD 227 per tonne in October 2026.
For a 30% protein floating feed with 3% fishmeal, these prices, plus assumed costs for bran, oil and premix and an assumed 8% landed premium, give a formula cost of about USD 490–525 per tonne. Recorded trade transactions for tilapia feed in Vietnam, Egypt and Ecuador in May 2026 ranged from about USD 700–790 per tonne. Against an assumed ex-mill price of USD 650–720 and assumed conversion costs of USD 43–70 per tonne, estimated gross margin is 9–26%.
At 85% utilization, after assumed overhead of USD 20–30 per tonne and 25% tax, annual cash profit is roughly USD 0.8–5.3 million. Payback is estimated at 3–8 years in mid- and high-margin years. If weak prices and peak ingredient costs persisted, payback could stretch beyond 10 years.
Soybean meal matters more than fishmeal in low-fishmeal diets. Each USD 50 per tonne move in soybean meal shifts gross margin by about 3 points, while a USD 100 move in fishmeal shifts it by about half a point.
| Metric | Value |
|---|---|
| IRR (post-tax) | Available in report |
| NPV | Available in report |
| ROI | Available in report |
| DSCR | Available in report |
How to start a fish feed business, licenses and approvals
Starting a fish feed mill generally requires company and tax registration, land use and building permits, an environmental permit covering boiler emissions, dust, odor and wastewater, and occupational safety approvals, because fine organic dust is an explosion hazard. Most markets also require a feed business registration or license, a documented hazard control plan, labeling that declares composition and nutrients, and controls on contaminants such as mycotoxins and heavy metals. Feed containing veterinary drugs needs a separate, stricter approval.
| Market | Feed approvals | Environment and safety |
|---|---|---|
| United States | FDA food facility registration and the Preventive Controls for Animal Food rule, 21 CFR Part 507; state commercial feed license and product labeling through the state department of agriculture; FDA medicated feed mill license under 21 CFR Part 515 only for Category II, Type A drugs | State air permit under the Clean Air Act for the boiler and dryers; OSHA grain handling standard, 29 CFR 1910.272, for dust control |
| European Union | Feed business registration, or approval where certain additives or premixtures are handled, under Regulation (EC) No 183/2005; labeling under Regulation (EC) No 767/2009; authorized additives under Regulation (EC) No 1831/2003; medicated feed under Regulation (EU) 2019/4 | National environmental permit; ATEX rules on explosive atmospheres under Directive 1999/92/EC |
| China | Feed production license from the provincial feed authority under the Regulations on the Administration of Feeds and Feed Additives; GB 13078 hygiene limits and GB 10648 labeling standard; MARA registration for imported feed and additives | Environmental impact assessment approval and pollutant discharge permit from local ecology and environment bureaus |
Rules and thresholds differ by state and province, so permits should be confirmed with local authorities before the layout is fixed.
Key fish feed manufacturers and recent developments
The industry is led by multinational aquafeed specialists and large Asian integrators. Global leaders include Nutreco's Skretting, BioMar, Cargill with its EWOS brand, and Mowi's feed division in salmon, along with Guangdong Haid Group, Tongwei, Charoen Pokphand Group, De Heus and Grobest in warm-water feeds. Strong national producers include Avanti Feeds and Growel in India, Vinh Hoan and Green Feed in Vietnam, and Japfa and Matahari Sakti in Indonesia.
- February 2026. BioMar said it would add a second line with 50,000 tonnes of capacity at its Wuxi joint venture with Tongwei in China, lifting its two Chinese plants to 200,000 tonnes, with commissioning expected in the first quarter of 2027.
- July 2026. Cargill announced a NOK 90 million expansion at its EWOS feed plant at Halsa in northern Norway, adding a finished-goods warehouse and staff facilities at a site expected to produce more than 200,000 tonnes next year.
- August 2026. Haid Group's subsidiary Sheng Long broke ground on a RM 140 million aquafeed factory in Perak, Malaysia, with two fish feed and two shrimp feed lines and 150,000 tonnes of annual capacity.
What's inside the Fish Feed project report PDF
The report runs to 21 chapters. Open a chapter to see its sections.
1. Preface
2. Scope and Methodology
- 2.1 Objectives of the Study
- 2.2 Stakeholders
- 2.3 Research Methodology
- 2.4 Data Sources and Key Assumptions
3. Executive Summary
- 3.1 Market Snapshot
- 3.2 Project at a Glance (Capacity, CapEx, OpEx)
- 3.3 Key Financial Indicators (IRR, NPV, Payback, Break-even)
- 3.4 Feasibility Verdict
4. Product Overview
- 4.1 Fish Feed Definition and Properties
- 4.2 Grades and Specifications (BIS / ISO / ASTM)
- 4.3 HS Code and Classification
- 4.4 Key Applications
- 4.5 Substitutes
5. Global Fish Feed Market
- 5.1 Market Overview
- 5.2 Historical and Current Market Performance (Volume and Value)
- 5.3 Market Breakup by Grade / Type
- 5.4 Market Breakup by End-Use Industry
- 5.5 Market Breakup by Region
- 5.6 Market Drivers, Restraints and Trends
- 5.7 Value Chain Analysis
- 5.8 Market Forecast
6. Target Country Fish Feed Market Analysis
- 6.1 Demand and Supply Analysis
- 6.2 Installed Capacity vs Demand Gap
- 6.3 Import Dependence
- 6.4 Demand Forecast by End-Use
7. Trade Analysis
- 7.1 Imports by Volume, Value and Country
- 7.2 Exports by Volume, Value and Country
- 7.3 Trade Balance and Opportunities
8. Price Analysis
- 8.1 Historical Fish Feed Price Trends by Region
- 8.2 Raw Material / Feedstock Price Trends and Linkage
- 8.3 Price Forecast
- 8.4 Margins Across the Value Chain
9. Competitive Landscape
- 9.1 Market Structure
- 9.2 Key Players and Installed Capacities
- 9.3 Profiles of Key Players
- 9.4 Recent Developments (Expansions, M&A, New Plants)
10. Manufacturing Process and Technology
- 10.1 Comparison of Technology Routes
- 10.2 Selected Route and Process Flow Diagram
- 10.3 Unit Operations Involved
- 10.4 Chemical Reactions Involved
- 10.5 Mass Balance and Raw Material Requirements
- 10.6 Energy Balance
- 10.7 Quality Assurance Criteria and Technical Tests
- 10.8 By-products and Waste Handling
- 10.9 Technology Licensors / Providers
11. Project Details, Requirements and Costs
- 11.1 Land, Location and Site Development
- 11.1.1 Site Selection Criteria
- 11.1.2 Location Analysis
- 11.1.3 Land Requirement and Costs
- 11.1.4 Site Development Costs
- 11.2 Plant Layout
- 11.2.1 Layout Principles
- 11.2.2 Proposed Layout
- 11.2.3 Factors Influencing Layout
- 11.3 Civil Works and Buildings
- 11.4 Plant Machinery
- 11.4.1 Machinery Requirements and Specifications
- 11.4.2 Machinery Costs
- 11.4.3 Machinery Suppliers
- 11.5 Raw Materials
- 11.5.1 Requirements per Tonne of Output
- 11.5.2 Procurement and Sourcing
- 11.5.3 Costs
- 11.5.4 Suppliers
- 11.6 Packaging
- 11.6.1 Packaging Requirements
- 11.6.2 Packaging Costs
- 11.6.3 Packaging Suppliers
- 11.7 Storage and Material Handling
- 11.8 Transportation Requirements and Costs
- 11.9 Utilities
- 11.9.1 Power Requirements and Costs
- 11.9.2 Water Requirements and Costs
- 11.9.3 Steam, Fuel and Other Utilities
- 11.10 Manpower Requirements and Wages
12. Environment, Health, Safety and Sustainability
- 12.1 Effluent and Emissions Management
- 12.2 Hazard Classification and Safety Measures
- 12.3 Carbon Footprint
- 12.4 Green / Low-Carbon Process Options
13. Regulatory Procedures, Approvals and Certifications
- 13.1 Licences and Registrations
- 13.2 Environmental Clearances
- 13.3 Product Certifications (BIS, REACH, etc.)
- 13.4 Approval Timeline
14. Project Implementation Schedule
15. Project Economics
- 15.1 Capital Cost of the Project
- 15.2 Techno-Economic Parameters
- 15.3 Capacity Utilization and Ramp-up
- 15.4 Product Pricing and Margins
- 15.5 Income Projections
- 15.6 Expenditure Projections
- 15.7 Working Capital Requirement
- 15.8 Taxation
- 15.9 Depreciation
16. Financial Analysis
- 16.1 Projected Profit and Loss Account
- 16.2 Projected Cash Flow Statement
- 16.3 Projected Balance Sheet
- 16.4 Liquidity Analysis
- 16.5 Profitability Analysis (Payback, NPV, IRR, ROI)
- 16.6 Break-even Analysis
- 16.7 Debt Service Coverage Ratio (DSCR)
- 16.8 Sensitivity Analysis
- 16.9 Scenario and Uncertainty Analysis
17. Funding and Incentives
- 17.1 Means of Finance and Debt-Equity Structure
- 17.2 Loans and Financial Assistance
- 17.3 Government Schemes and Subsidies (PLI, State Policies)
18. Risk Assessment
- 18.1 Key Success Factors
- 18.2 Key Risk Factors
- 18.3 Risk Mitigation
19. Strategic Recommendations
20. Case Study of a Successful Venture
21. Appendix
- 21.1 Detailed Assumptions
- 21.2 Abbreviations
- 21.3 List of Tables and Figures
- 21.4 Sources
This page vs. the full report
| Data point | On this page (free) | In the full report |
|---|---|---|
| Total CapEx | One rounded range at one capacity | Exact figure at three capacities with a line-item breakup |
| CapEx breakup | Category shares (%) only | Cost, quantity and supplier for every machine |
| Operating cost | Share of raw materials, utilities and labor | Per-unit cost sheet with each input price and consumption |
| Profitability | Gross margin range and payback band | Exact IRR, NPV, ROI, break-even and DSCR |
| Financial statements | List of what is included | 10-year P&L, cash flow, balance sheet and Excel model |
| Sensitivity | One directional line | Full sensitivity and scenario tables |
| Process | Simplified flow diagram | Detailed process flow, mass and energy balance, operating conditions |
| Machinery | Names of the main machines | Specifications, capacity, cost and supplier list |
| Market | Headline size, growth and global demand | Segment, region, trade and price forecast tables |
| Suppliers and buyers | Supplier types and sourcing hubs | Named suppliers and buyers |
Fish Feed project report: FAQs
How much does a fish feed manufacturing plant cost?
What profit margin does a fish feed business make?
What is the payback period for a fish feed mill?
What raw materials are used to make fish feed?
What is the difference between floating and sinking fish feed?
Which HS code applies to fish feed?
Which licenses are needed to start a fish feed plant?

About the analyst
Nisha Gupta, Senior Research Analyst
Nisha Gupta is a Senior Research Analyst at Credence Research Inc. who works across industry domains, including packaging, automotive parts and machinery. Her focus is the modelling engine behind each study: she builds quantitative market databases and econometric forecasting frameworks, and developed automated Excel-based market modelling templates that cut client turnaround time by 30%.
Related market research
- Fishmeal Market Size, Growth, Share, Trends and Forecast 2032
- Compound Feed Market Size, Trends, Share and Forecast 2032
- Fish Feed Pellet Making Machine Market Size, Share and Forecast 2032
- Aquafeed Additives Market Size, Share, Trends and Forecast 2032
- Fish Farming Market Size, Share, Trends and Forecast 2032
- Aquafeed and Aquaculture Additives Market Size, Growth and Forecast 2032
More plant project reports
- Biofertilizer Manufacturing Plant Project Report (DPR) 2026
- Avocado Processing Plant Project Report (DPR) 2026
- Mustard Oil Processing Plant Project Report (DPR) 2026
- Liquid Detergent Manufacturing Plant Project Report (DPR) 2026
- Ice Cream Cone Manufacturing Plant Project Report (DPR) 2026
- Formaldehyde Manufacturing Plant Project Report (DPR) 2026