Market Overview:
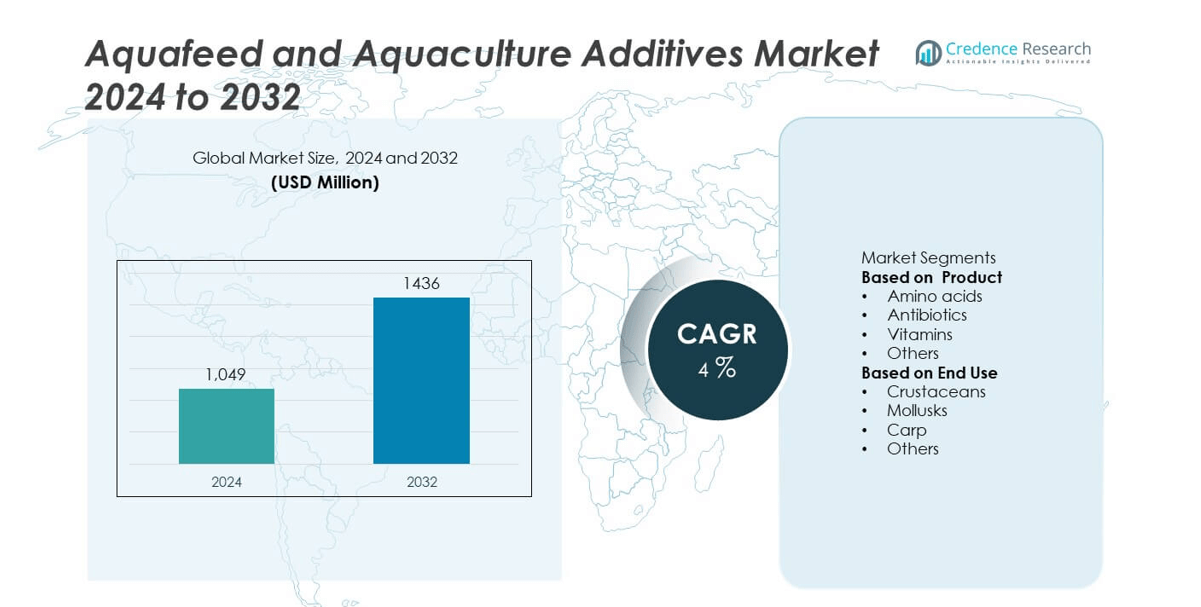
The global aquafeed and aquaculture additives market was valued at USD 1,049 million in 2024 and is projected to reach USD 1,436 million by 2032, expanding at a CAGR of 4% during the forecast period.
| REPORT ATTRIBUTE |
DETAILS |
| Historical Period |
2020-2023 |
| Base Year |
2024 |
| Forecast Period |
2025-2032 |
| Aquafeed and Aquaculture Additives Market Size 2024 |
USD 1,049 million |
| Aquafeed and Aquaculture Additives Market, CAGR |
4% |
| Aquafeed and Aquaculture Additives Market Size 2032 |
USD 1,436 million |
The aquafeed and aquaculture additives market is led by key players including Cargill Inc, Beneo GmbH, Alltech, Novus International, Biomar, Evonik, BASF, Ridley, DSM, and BASF SE. These companies emphasize sustainable feed solutions, focusing on amino acids, vitamins, and enzyme-based additives to improve fish health and feed efficiency. Asia Pacific dominated the global market with a 32.5% share in 2024, driven by large-scale aquaculture production and supportive government initiatives. Europe followed with 30.1%, supported by strict sustainability regulations, while North America accounted for 28.6%, benefiting from advanced farming systems and growing demand for high-quality aquafeed.
Market Insights
- The aquafeed and aquaculture additives market was valued at USD 1,049 million in 2024 and is projected to reach USD 1,436 million by 2032, growing at a CAGR of 4%.
- Rising global aquaculture production and demand for nutrient-rich, sustainable feed are driving market growth across fish and shrimp farming sectors.
- Advancements in amino acid- and enzyme-based additives are shaping trends toward improved feed efficiency and environmental sustainability.
- Major players such as Cargill, BASF, Biomar, and Alltech are investing in R&D and strategic partnerships to expand their global presence and product innovation.
- Asia Pacific led the market with a 32.5% share in 2024, followed by Europe with 30.1% and North America with 28.6%, while the amino acids segment accounted for a 38.4% share of total product demand.
Access crucial information at unmatched prices!
Request your sample report today & start making informed decisions powered by Credence Research Inc.!
Download Sample
Market Segmentation Analysis:
By Product
Amino acids accounted for a 38.4% share of the aquafeed and aquaculture additives market in 2024. Their vital role in enhancing fish growth, feed efficiency, and immunity drives extensive usage across aquaculture operations. Formulations containing lysine, methionine, and threonine improve protein synthesis and nutrient absorption, resulting in better growth rates and lower feed conversion ratios. Evonik Industries’ AQUAVI amino acid-based feed solutions support optimal fish nutrition while reducing nitrogen emissions. Rising demand for nutrient-balanced feed and sustainable production continues to strengthen the dominance of this segment globally.
- For instance, Evonik Industries developed AQUAVI Met-Met, a dipeptide methionine product with low water solubility and high bioavailability in shrimp, which allows for a significant reduction of fishmeal in diets, thereby helping to reduce nitrogen emissions and water pollution.
By End Use
The carp segment captured 42.1% of the market in 2024, primarily supported by large-scale aquaculture activities across Asia Pacific. Carp farming relies on nutritionally rich feed fortified with amino acids, vitamins, and minerals to enhance growth and disease resistance. Cargill’s tailored carp feed formulations improve feed conversion efficiency and fish health, helping farmers achieve consistent production yields. The increasing shift toward sustainable aquaculture, intensive rearing systems, and optimized nutrition continues to drive carp feed additive consumption, reinforcing this segment’s leadership in global aquafeed applications.
- For instance, Cargill’s AquaXcel carp feed line delivers high-protein nutrition designed to achieve a good Feed Conversion Ratio (FCR) of approximately 1.5 to 2.2 (meaning 1.5 to 2.2 kg of feed input is required to produce 1 kg of fish gain), significantly improving productivity in commercial farms across China and India compared to traditional methods.
Key Growth Drivers
Rising Global Aquaculture Production
The steady expansion of aquaculture to meet growing seafood demand continues to drive the aquafeed and aquaculture additives market. Fish farming activities in Asia Pacific and Latin America are increasing rapidly, boosting the need for nutrient-dense and sustainable feed. Governments are supporting intensive aquaculture to strengthen food security and exports. According to the FAO, global aquaculture output exceeded 94 million tons in 2023, with Asia contributing over 85% of total production. This surge in cultured fish and shrimp farming has significantly increased the demand for high-quality feed formulations and functional additives.
- For instance, BioMar produced over 1.3 million tons of aquafeed across its 17 global facilities, supplying advanced formulations for species such as salmon, shrimp, and trout to enhance feed performance and reduce environmental impact.
Growing Focus on Nutritional Efficiency
Feed optimization and better nutrient utilization remain central to improving aquaculture profitability. Modern formulations enriched with amino acids, vitamins, enzymes, and probiotics enhance feed conversion efficiency and fish immunity. Major feed companies are focusing on bioavailable ingredients that reduce nutrient loss and improve digestibility. DSM’s enzyme-based solutions have been adopted globally to enhance nutrient release and limit feed waste. The drive to maximize yield while minimizing cost supports continued innovation in balanced feed composition and ingredient functionality across multiple aquaculture species.
- For instance, DSM’s RONOZYME enzyme range has demonstrated nutrient digestibility improvements of up to 15 g of additional protein retention per kilogram of feed, supporting healthier growth and reduced nitrogen emissions in fish and shrimp farming.
Shift Toward Sustainable and Eco-Friendly Feed Additives
Environmental regulations and restrictions on antibiotics are encouraging the use of natural aquafeed additives. Producers are increasingly substituting synthetic inputs with probiotics, enzymes, algae-based ingredients, and plant extracts. Alltech’s algae-derived omega-3 products provide sustainable alternatives to fish oil, reducing ecological pressure while maintaining nutritional integrity. This movement aligns with global sustainability goals, promoting circular aquaculture practices and reducing carbon footprints. The ongoing focus on cleaner production and environmentally responsible inputs continues to redefine feed formulation standards worldwide.
Key Trends & Opportunities
Adoption of Functional and Specialty Feed Additives
The industry is witnessing greater use of functional feed additives aimed at disease prevention and stress management. Probiotics, immunostimulants, and organic acids are becoming integral in strengthening fish health and reducing disease outbreaks. Cargill and Biomin have introduced immune-boosting additives that improve shrimp and salmon survival rates under intensive farming conditions. These developments reflect the transition toward antibiotic-free aquaculture. As producers seek better resilience and feed efficiency, specialty additives are gaining strong traction across both freshwater and marine species segments.
- For instance, Biomin’s AquaStar® probiotic blend contains over 1×10⁹ CFU per gram of Bacillus strains, enhancing gut microbiota balance and improving shrimp survival by more than 20,000 viable post-larvae per hectare under controlled trials.
Expansion of Precision Nutrition and Digital Feed Management
Technological advancements are enabling data-driven precision feeding in aquaculture. IoT systems, machine learning, and predictive modeling now allow real-time adjustments to feeding patterns and formulations. Skretting’s AquaSim platform applies AI-based models to optimize feed programs by species, water quality, and growth stage. These tools reduce waste and enhance growth efficiency, supporting sustainability. The integration of digital solutions into feed management is creating opportunities for additive suppliers to develop intelligent, data-supported nutrition strategies for global aquaculture producers.
- For instance, Skretting’s AquaSim is a digital platform that brings real-time data and big data together in a smarter farm environment to enable more informed, proactive decision-making, with a focus on optimizing farm performance and providing tailored advice.
Key Challenges
High Feed Production Costs
Aquafeed manufacturers face challenges due to volatile prices of fishmeal, soybean meal, and plant proteins. Rising global demand and climate-related disruptions have strained raw material supply chains. Fishmeal costs have climbed sharply following production declines in key regions such as Peru. In response, companies are investing in alternative protein sources like insect meal and microbial biomass to maintain supply stability. Despite promising results, scaling these alternatives remains costly, highlighting the need for innovation in cost-effective ingredient sourcing and processing.
Limited Awareness and Infrastructure in Developing Regions
Small-scale aquaculture farmers in developing nations often lack access to advanced feed and additive technologies. Poor infrastructure and limited technical knowledge restrict adoption of formulated feeds. In parts of Africa and Southeast Asia, farmers still rely on low-protein, homemade feeds that reduce productivity. Limited cold chain facilities further constrain additive distribution. Expanding farmer training programs and strengthening public-private initiatives are essential to improving awareness, ensuring quality input accessibility, and advancing sustainable aquaculture development across these emerging regions.
Regional Analysis
North America
North America held a 28.6% share of the aquafeed and aquaculture additives market in 2024, driven by the growing demand for high-quality seafood and advanced aquaculture systems. The United States and Canada lead the region, focusing on sustainable feed solutions and disease-prevention additives. Strong regulatory support for environmentally friendly production enhances innovation in amino acid and vitamin formulations. For instance, Cargill and Alltech have introduced functional feed blends for salmon and trout to improve growth performance. Rising consumer preference for protein-rich, antibiotic-free seafood continues to strengthen market growth across North American aquaculture operations.
Europe
Europe accounted for a 30.1% share in 2024, supported by large-scale salmon and trout farming industries and strict sustainability standards. Norway, Scotland, and Denmark remain key contributors, investing heavily in nutritional efficiency and clean-label additives. The European Union’s ban on antibiotic growth promoters has accelerated the use of probiotics and enzymes in feed formulations. For instance, BioMar and Skretting are developing precision feed additives to enhance fish health and reduce environmental impact. High awareness of feed traceability and commitment to sustainable aquaculture practices continue to reinforce Europe’s leadership in the global market.
Asia Pacific
Asia Pacific dominated the aquafeed and aquaculture additives market with a 32.5% share in 2024 and is projected to expand fastest through 2032. China, India, Vietnam, and Indonesia lead regional production, fueled by strong aquaculture growth and government-backed fishery programs. Increasing adoption of amino acid- and vitamin-enriched feeds supports higher yields and disease resistance in species such as carp and shrimp. For instance, ADM and Charoen Pokphand Foods are investing in regional feed mills and additive research. Rising seafood consumption and expanding commercial aquaculture continue to position Asia Pacific as the primary growth engine for the global market.
Latin America
Latin America held a 5.8% market share in 2024, driven by the growing aquaculture industries in Chile, Brazil, and Ecuador. The region’s salmon and shrimp farming sectors are adopting advanced feed formulations to boost productivity and meet export standards. Investments in sustainable nutrition and disease control additives are expanding market reach. For instance, Vitapro and Biomar have developed customized vitamin and amino acid feeds tailored for regional aquaculture species. Supportive government policies and international trade growth are expected to further enhance the use of nutrient-rich, performance-oriented aquafeed across Latin America.
Middle East & Africa
The Middle East & Africa accounted for a 3% share in 2024, reflecting gradual progress in aquaculture infrastructure and feed technology. Egypt and Saudi Arabia are leading contributors, focusing on aquafeed modernization to improve yield efficiency. Local initiatives promoting fish farming for food security and reduced import dependency are driving market growth. For instance, Aller Aqua and ACIAR are partnering with regional producers to develop vitamin-fortified and cost-effective feed solutions. Rising investments in aquaculture projects and expanding awareness of feed quality benefits are expected to support long-term growth across emerging markets in this region.
Market Segmentations:
By Product
- Amino acids
- Antibiotics
- Vitamins
- Others
By End Use
- Crustaceans
- Mollusks
- Carp
- Others
By Geography
- North America
- Europe
- Germany
- France
- U.K.
- Italy
- Spain
- Rest of Europe
- Asia Pacific
- China
- Japan
- India
- South Korea
- South-east Asia
- Rest of Asia Pacific
- Latin America
- Brazil
- Argentina
- Rest of Latin America
- Middle East & Africa
- GCC Countries
- South Africa
- Rest of the Middle East and Africa
Competitive Landscape
The competitive landscape of the aquafeed and aquaculture additives market is defined by strong innovation and strategic expansion among major players such as Cargill Inc, Beneo GmbH, Alltech, Novus International, Biomar, Evonik, BASF, Ridley, DSM, and BASF SE. These companies focus on developing high-performance feed formulations and nutrient-efficient additives to enhance fish health and feed conversion ratios. Continuous investment in amino acids, probiotics, and enzyme-based solutions supports improved aquaculture sustainability and productivity. Leading firms are forming partnerships with aquaculture producers to strengthen supply chains and regional reach, particularly in Asia Pacific and Latin America. Product diversification, digital feed management solutions, and R&D in alternative proteins such as algae and insect meal are shaping the next phase of competition. Regulatory compliance with sustainability standards and innovations in functional feed ingredients remain key factors driving long-term competitiveness in this evolving market.
Shape Your Report to Specific Countries or Regions & Enjoy 30% Off!
Key Player Analysis
Recent Developments
- In October 2025, Alltech earned ASC Feed Standard certifications for Alltech Coppens (Germany) and Alltech Fennoaqua (Finland), firsts in both countries.
- In October 2025, BioMar secured ASC Feed certification for its Nersac, France facility, expanding ASC-conforming feed supply in the West Mediterranean and Africa region.
- In June 2025, Cargill Inc achieved ASC Feed certification for its Westfield, Scotland aquafeed operations, making all salmonid-feed sites ASC-compliant.
- In April 2025, Beneo GmbH inaugurated a pulse-processing plant in Germany to supply food and feed ingredients, expanding protein inputs relevant to aquafeed.
Report Coverage
The research report offers an in-depth analysis based on Product, End Use and Geography. It details leading market players, providing an overview of their business, product offerings, investments, revenue streams, and key applications. Additionally, the report includes insights into the competitive environment, SWOT analysis, current market trends, as well as the primary drivers and constraints. Furthermore, it discusses various factors that have driven market expansion in recent years. The report also explores market dynamics, regulatory scenarios, and technological advancements that are shaping the industry. It assesses the impact of external factors and global economic changes on market growth. Lastly, it provides strategic recommendations for new entrants and established companies to navigate the complexities of the market.
Future Outlook
- Rising seafood consumption will continue to boost demand for high-quality aquafeed and additives.
- Development of functional and fortified feed solutions will enhance fish health and productivity.
- Increasing focus on sustainable and eco-friendly feed formulations will shape future product innovation.
- Expansion of aquaculture in emerging economies will create strong growth opportunities for feed producers.
- Advancements in enzyme and probiotic technologies will improve nutrient absorption and feed efficiency.
- Strategic collaborations between feed manufacturers and farmers will strengthen supply chain integration.
- Digital tools and precision feeding systems will optimize feed usage and reduce environmental waste.
- Growing regulations on antibiotic-free aquaculture will drive adoption of natural and bio-based additives.
- R&D investments in alternative proteins like algae and insect meal will diversify feed sources.
- Asia Pacific will remain the key growth region, supported by government initiatives and expanding aquaculture infrastructure.


