Market Overview
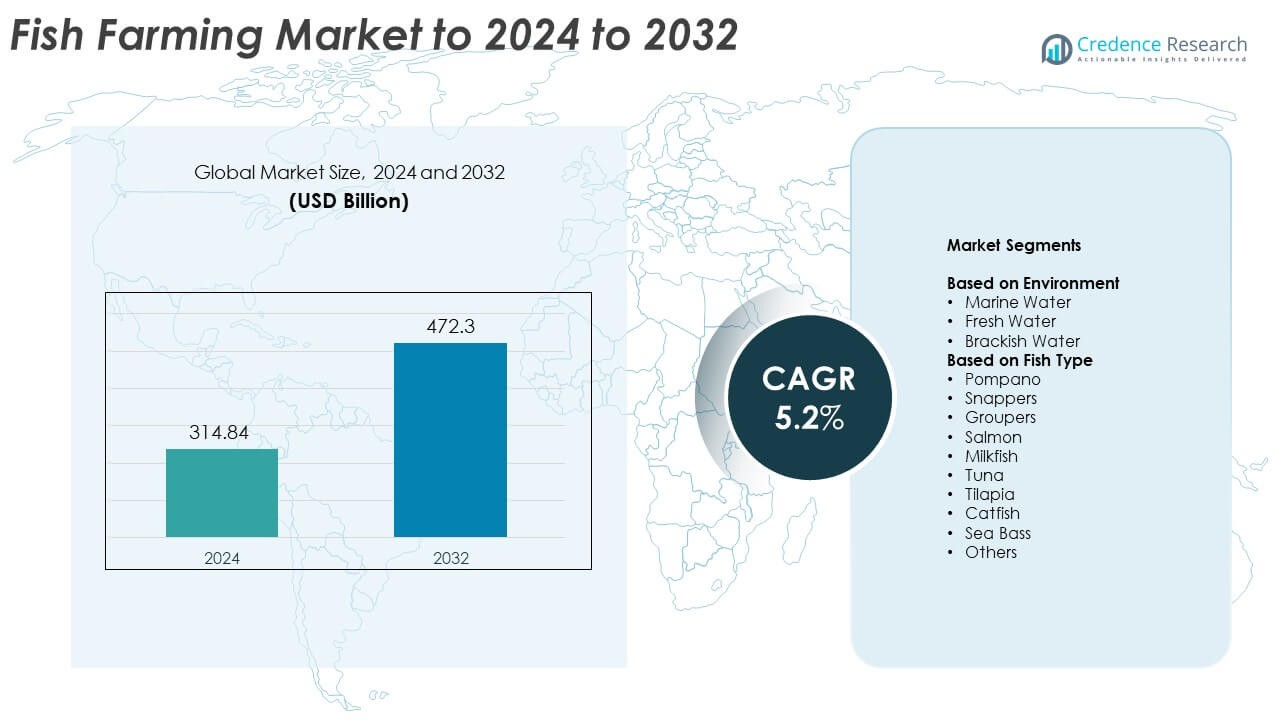
Fish Farming Market size was valued at USD 314.84 billion in 2024 and is anticipated to reach USD 472.3 billion by 2032, at a CAGR of 5.2% during the forecast period.
| REPORT ATTRIBUTE |
DETAILS |
| Historical Period |
2020-2023 |
| Base Year |
2024 |
| Forecast Period |
2025-2032 |
| Fish Farming Market Size 2024 |
USD 314.84 Billion |
| Fish Farming Market, CAGR |
5.2% |
| Fish Farming Market Size 2032 |
USD 472.3 Billion |
The Fish Farming Market features major players such as Stolt Sea Farm, Tassal Group Limited, Cermaq Group AS, P/F Bakkafrost, Grupo Farallon Aquaculture, Thai Union Group Public Company Limited, Cooke Aquaculture Inc., Hendrix Genetics, Mowi, and Leroy Sea Food Group, all expanding capacity through advanced hatcheries, selective breeding, and sustainable production systems. Asia Pacific remained the leading region in 2024 with about 46% share, driven by large-scale freshwater and coastal farming in China, India, Indonesia, and Vietnam. Europe followed with around 28% share, supported by strong salmon and sea bass production, while North America held nearly 21% share through growing demand for premium farmed seafood.
Access crucial information at unmatched prices!
Request your sample report today & start making informed decisions powered by Credence Research Inc.!
Download Sample
Market Insights
- The Fish Farming Market reached USD 314.84 billion in 2024 and will grow to USD 472.3 billion by 2032 at a 5.2% CAGR through expanding aquaculture capacity and rising global seafood demand.
- Rising protein consumption and improved hatchery efficiency drive adoption of freshwater and coastal farming, while tilapia holds the largest fish-type share due to fast growth rates and low production costs.
- Key trends include wider use of recirculating aquaculture systems, sustainable feed innovation, and offshore cage expansion to improve yield and reduce environmental pressure.
- Competition intensifies as major producers strengthen genetics programs, enhance biosecurity, and invest in automation, but disease outbreaks and strict environmental rules remain major restraints affecting farm stability and compliance costs.
- Asia Pacific dominated with nearly 46% share in 2024, followed by Europe at about 28% and North America at 21%, while the freshwater environment led the segment with roughly 61% share due to low setup cost and strong adoption across developing economies.
Market Segmentation Analysis:
By Environment
Fresh Water dominated the environment segment in 2024 with about 61% share due to its low setup cost and strong adoption across Asia-Pacific. Farmers preferred this environment because ponds and inland systems support stable production with predictable yields. Demand grew as tilapia, carp, and catfish farms expanded under government-backed food security programs. Fresh Water also advanced with wider use of recirculating systems that improved stocking density and feed efficiency. Marine Water and Brackish Water grew at steady rates, yet high infrastructure needs kept Fresh Water in a clear lead.
- For instance, Mowi ASA’s 2023 report records harvest volumes of 474,664 tonnes of farmed salmon produced through its network of freshwater hatcheries and sea sites across multiple countries.
By Fish Type
Tilapia led the fish-type segment in 2024 with nearly 27% share due to its fast growth rate, low feed cost, and strong consumption in Asia and Africa. Farmers favored tilapia because the species adapts well to varied water conditions and supports high survival rates. Growth accelerated as retail chains increased demand for affordable white fish with stable supply. Salmon, catfish, and tuna followed, but tilapia maintained dominance through large-scale freshwater production and strong demand from processed food makers.
- For instance, Aquafinca Saint Peter Fish’s tilapia processing plant in Honduras has an annual capacity of 30,000 metric tons of tilapia products, as reported by SeafoodSource.
Key Growth Drivers
Rising Global Protein Demand
Growing demand for affordable animal protein pushed fish farming ahead in many regions. Consumers shifted toward fish as a healthier choice due to lower fat levels and rich omega-3 content. Expanding middle-income groups in Asia increased intake of farmed tilapia, carp, and catfish. Governments also promoted aquaculture to reduce pressure on wild stocks and improve food security. Faster production cycles and steady year-round yield helped farms meet rising consumption. This driver remained one of the strongest forces behind market expansion.
- For instance, Avanti Feeds Limited reported in FY24 a shrimp feed production capacity of 775,000 metric tonnes per year and shrimp processing and export capacity of 29,000 metric tonnes per year, supporting large-scale farmed shrimp protein supply.
Advances in Aquaculture Technology
Modern systems such as recirculating aquaculture, oxygen monitoring tools, and automated feeders improved efficiency and reduced production losses. Farmers adopted digital water-quality controls to prevent disease and stabilize growth rates. These tools supported higher stocking density and lower feed waste, which raised profitability. Technology also enabled large farms to scale faster while reducing environmental impact. Wider use of selective breeding and improved hatchery practices strengthened output across major species. This factor continued to boost long-term productivity in fish farming.
- For instance, a Smart Prosperity profile notes that XpertSea’s digital platform processed data on more than 1.8 billion shrimp over a single year, demonstrating technology-enabled precision aquaculture management.
Government Support and Aquaculture Policies
Many countries expanded subsidies, training programs, and low-interest loans for fish farmers. Authorities promoted pond renovation, hatchery development, and cold-chain upgrades to strengthen supply. National aquaculture missions in Asia and Latin America helped small farmers improve stocking practices and adopt better feed. Supportive rules also encouraged private investment in coastal farming zones. These policies increased production stability and reduced market gaps caused by import fluctuations. This driver played a major role in increasing farm capacity.
Key Trends and Opportunities
Growth of Sustainable and Eco-Friendly Farming
Demand for fish raised through responsible methods increased as buyers looked for traceable and low-impact seafood. Producers shifted toward eco-certified feed, improved waste treatment, and better water-reuse systems. Retailers also expanded certified product lines to meet sustainability targets. This trend opened opportunities for farms using biofloc systems, integrated multitrophic aquaculture, and lower-carbon operations. Cleaner practices helped producers access premium markets and long-term export contracts. Environmental standards continued to shape investment decisions across major producing nations.
- For instance, BioMar Group reported total aquafeed sales volume of 1.6 million tons in 2023, including salmon and shrimp feeds, in its 2023 results update, much of which is produced under documented sustainability programs
Expansion of High-Value Species Production
Farmers increased output of salmon, sea bass, and grouper due to strong demand from urban markets and the food-service sector. High-value species fetched better margins and encouraged investment in advanced hatcheries. Growth in chilled and ready-to-cook seafood also raised the need for premium fish. Companies expanded offshore cages and high-density systems to support stable supply. This trend created opportunities for technology suppliers, feed makers, and integrated processors. Rising incomes in Asia and Europe accelerated this shift toward value-focused farming.
- For instance, Lerøy Seafood Group’s 2024 trading update shows a total harvest volume of 171,200 tonnes of salmon and trout for the year, up from 159,600 tonnes in 2023, highlighting expansion in high-value species output.
Key Challenges
Disease Outbreaks and Biosecurity Risks
Disease remained a major threat, causing sudden mortality and heavy economic losses. Many farms struggled with viral infections, water contamination, and poor biosecurity practices. High stocking density increased vulnerability in both freshwater and marine systems. Farmers faced rising costs for monitoring tools and preventive treatment. Limited training in rural regions made outbreaks harder to control. These risks reduced output predictability and discouraged long-term investment in sensitive species.
Pressure from Environmental and Regulatory Compliance
Stricter rules on water discharge, antibiotic use, and coastal zoning increased operational complexity. Farms needed better waste-management systems and improved monitoring to meet new standards. Compliance raised production costs, especially for small and mid-scale operators. Environmental groups also pushed for reduced habitat impact and stronger oversight of marine cages. These pressures slowed expansion in certain regions and forced producers to upgrade systems. Meeting regulatory demands remained a core challenge for sustainable growth.
Regional Analysis
North America
North America held about 21% share in 2024, driven by strong demand for salmon, trout, and catfish across the United States and Canada. Growth increased as farmers adopted recirculating systems that improved water use and reduced disease risk. Expanding retail preference for locally raised seafood also supported production. Government-backed sustainability programs improved hatchery operations and feed standards across coastal regions. The region strengthened output through investments in cold-water species and advanced monitoring tools. Rising imports continued to pressure pricing, yet domestic aquaculture gained traction through premium farmed fish offerings.
Europe
Europe accounted for nearly 28% share in 2024, supported by strong production of salmon, sea bass, and trout across Norway, Scotland, and the Mediterranean belt. Strict sustainability standards encouraged farms to adopt advanced cage systems and improved feed formulations. The region benefited from well-established cold-chain infrastructure and strong export networks. Demand rose as consumers preferred traceable and eco-certified seafood. Innovation in offshore farming increased long-term capacity. Despite higher operational costs due to regulations, Europe maintained a leading position through technology-driven farming and consistent government support for low-impact operations.
Asia Pacific
Asia Pacific dominated the global market with about 46% share in 2024, supported by large-scale freshwater and coastal farming in China, India, Indonesia, Vietnam, and Bangladesh. Heavy consumption of tilapia, carp, catfish, and shrimp strengthened regional output. Governments invested in hatchery expansion, cold-chain improvement, and disease-control training. Rapid urbanization increased demand for affordable fish protein. The region also advanced high-density systems and integrated farming practices that improved feed efficiency. Strong export strength, particularly from China and Vietnam, reinforced Asia Pacific’s leadership. Low production costs helped the region remain the primary global supplier.
Latin America
Latin America held roughly 3% share in 2024, driven by expanding salmon, tilapia, and trout production in Chile, Brazil, and Mexico. Chile’s strong role in global salmon exports supported regional prominence. Investments in biosecurity and offshore cages improved productivity and reduced disease risk. Local demand increased as fish became a preferred protein option in urban markets. Regional farms benefited from favorable water resources and rising government support for aquaculture zones. Despite infrastructure gaps in some countries, Latin America continued to strengthen export potential, especially in premium salmon and tilapia categories.
Middle East and Africa
Middle East and Africa accounted for nearly 2% share in 2024, supported by freshwater farming expansion in Egypt, Nigeria, and Saudi Arabia. Egypt remained one of the world’s largest tilapia producers, driving regional output. Governments invested in hatcheries, feed mills, and integrated farming programs to reduce import dependence. Water-efficient systems gained interest due to arid climate challenges. Growing urban populations increased the need for affordable protein sources. Limited technological adoption and high input costs slowed wider growth, yet ongoing investments in controlled-environment aquaculture improved long-term potential across the region.
Market Segmentations:
By Environment
- Marine Water
- Fresh Water
- Brackish Water
By Fish Type
- Pompano
- Snappers
- Groupers
- Salmon
- Milkfish
- Tuna
- Tilapia
- Catfish
- Sea Bass
- Others
By Geography
- North America
- Europe
- Germany
- France
- U.K.
- Italy
- Spain
- Rest of Europe
- Asia Pacific
- China
- Japan
- India
- South Korea
- South-east Asia
- Rest of Asia Pacific
- Latin America
- Brazil
- Argentina
- Rest of Latin America
- Middle East & Africa
- GCC Countries
- South Africa
- Rest of the Middle East and Africa
Competitive Landscape
The Fish Farming Market is shaped by major players such as Stolt Sea Farm, Tassal Group Limited, Cermaq Group AS, P/F Bakkafrost, Grupo Farallon Aquaculture, Thai Union Group Public Company Limited, Cooke Aquaculture Inc., Hendrix Genetics, Mowi, and Leroy Sea Food Group. Companies focused on expanding production through advanced hatchery systems, optimized feed solutions, and biosecurity upgrades that reduce disease risks. Many operators invested in offshore farming structures and recirculating aquaculture systems to boost yield while lowering environmental impact. Firms also strengthened cold-chain networks to support global exports and meet rising demand for premium and eco-certified seafood. Sustainability certifications, genetic improvement programs, and integrated supply chains continued to influence competitive strategy. Leading producers expanded automation across feeding, monitoring, and harvesting to improve efficiency and consistency. Digital water-quality analytics helped farms enhance survival rates and reduce operational losses. Strategic partnerships and regional capacity expansions further reinforced competitiveness across key markets.
Key Player Analysis
- Stolt Sea Farm
- Tassal Group Limited
- Cermaq Group AS
- P/F Bakkafrost
- Grupo Farallon Aquaculture
- Thai Union Group Public Company Limited
- Cooke Aquaculture Inc.
- Hendrix Genetics
- Mowi
- Leroy Sea Food Group
Recent Developments
- In 2025, Cooke Aquaculture acquired AquaBounty’s former land-based salmon facility on Prince Edward Island. The site will be redeveloped to expand Cooke’s post-smolt and land-based salmon farming capacity in Atlantic Canada.
- In 2025, Mowi secured all approvals to acquire a controlling stake in Norwegian salmon farmer Nova Sea. With Nova Sea included, Mowi expects a sharp increase in harvest volumes in northern Norway.
- In 2023, Hendrix Genetics Opened a new shrimp breeding multiplication center in India to enhance shrimp genetics and resilience for the local market.
Shape Your Report to Specific Countries or Regions & Enjoy 30% Off!
Report Coverage
The research report offers an in-depth analysis based on Environment, Fish Type and Geography. It details leading market players, providing an overview of their business, product offerings, investments, revenue streams, and key applications. Additionally, the report includes insights into the competitive environment, SWOT analysis, current market trends, as well as the primary drivers and constraints. Furthermore, it discusses various factors that have driven market expansion in recent years. The report also explores market dynamics, regulatory scenarios, and technological advancements that are shaping the industry. It assesses the impact of external factors and global economic changes on market growth. Lastly, it provides strategic recommendations for new entrants and established companies to navigate the complexities of the market.
Future Outlook
- Demand for farmed fish will rise as consumers shift toward healthier protein.
- Advanced recirculating systems will expand due to water savings and higher yields.
- Offshore and deep-water farming will grow to support large-scale production.
- Sustainable feed ingredients will gain traction as producers cut environmental impact.
- Digital monitoring tools will improve disease control and lower mortality rates.
- High-value species such as salmon and sea bass will see stronger investment.
- Government aquaculture programs will support small and mid-scale farmers.
- Cold-chain upgrades will boost export capacity across major producing countries.
- Eco-certified seafood will gain market share as buyers prefer traceable products.
- Integrated farming models will help reduce costs and improve long-term output stability.


