
Quick answer
Liquid detergent is a water-based cleaning product that blends anionic and nonionic surfactants with soluble builders, enzymes, fragrance and a preservative, then fills it into bottles or pouches. A greenfield plant making 25,000 tonnes a year needs an estimated USD 5–16 million of CapEx, excluding working capital. A regional mid-tier or private-label producer can expect a gross margin of about 18–30%, with payback in about 2–7 years. Surfactant and bottle costs set most of the outcome.
Feasible for a regional producer with private-label or distribution contracts and purchased bottles; a high-cost build selling diluted liquid against multinational brands is the main way this project fails.
Liquid Detergent plant: key highlights
| Parameter | Indicative value | Note |
|---|---|---|
| Plant capacity | 25,000 tonnes per year | Batch cold blending with bottle and pouch filling, about 83 tonnes a day over 300 operating days |
| Total CapEx | USD 5–16 million | Greenfield, excluding working capital; high end includes in-house bottle blow molding |
| Raw material share of operating cost | 55–62% | Surfactants, builders, enzymes, fragrance and preservative; packaging adds about a fifth more |
| Gross margin | 18–30% | At an assumed ex-factory price of USD 780–950 per tonne |
| Payback period | 2–7 years | From commissioning, including about six months of ramp-up |
| IRR | Available in report | Post-tax, 10-year model |
| Break-even | Available in report | Capacity utilization basis |
Ranges assume 25,000 tonnes a year of liquid laundry detergent filled in 0.5–5 liter bottles and pouches, a representative greenfield site from an Asian industrial park to a U.S. or EU location, 2026 prices, 85% steady-state utilization, purchased surfactants and bottles at the low end, an assumed ex-factory price of USD 780–950 a tonne, and INR at an assumed 77 (2022) and 88 (2026) per USD. Excludes working capital and brand marketing. Customizable to any country or region.
What is liquid detergent?
Liquid detergent is a pourable cleaning product in which surfactants are dissolved or dispersed in water rather than dried into granules. A typical household laundry liquid carries 10–30% active ingredients, mainly sodium linear alkylbenzene sulfonate, sodium laureth sulfate and nonionic alcohol ethoxylates, together with fatty acid soap, citrate or other soluble builders, enzymes, optical brightener, polymers, fragrance, dye and a preservative. Water makes up most of the rest, which is why the product is cheap to make but costly to move.
Grades run from diluted economy liquids sold in 1–5 liter jugs and refill pouches to concentrated and high-efficiency formulas for front-loading machines, and on to unit-dose capsules wrapped in water-soluble film. Dishwashing liquid and fabric conditioner can run on the same tanks and fillers.
Internationally, liquid detergents put up for retail sale fall under HS code 3402.50 of the 2022 Harmonized System, while bulk preparations not for retail sale fall under 3402.90. Buyers are households served through supermarkets, e-commerce and general trade, along with hotels, commercial laundries and retailers that commission private labels.
Liquid detergent market overview and global demand
Credence Research's global study of the liquid detergents category values it at USD 38.05 billion in 2024, growing at a 4.6% CAGR to USD 54.53 billion by 2032. That implies about USD 39.8 billion in 2025, based on the 2024 figure and the stated growth rate. Formulas made for high-efficiency washers form a large slice, put at USD 13.12 billion in 2024 in the company's high-efficiency laundry liquid analysis.
Growth tracks washing machine ownership, because liquids dissolve fully in cold, short cycles and dose cleanly in front-loaders, so they lead in North America, Western Europe, Japan and much of urban China, where powders have been losing share for two decades. In South and Southeast Asia, Africa and Latin America, powders and bars still win on price per wash, but liquids are the fastest-growing laundry format as machine ownership, modern retail and online grocery spread. Brand owners are answering that demand with local filling rather than imports.
Trade stays regional because a laundry liquid is mostly water. U.S. exports of HS heading 3402 washing and cleaning preparations were about USD 3.67 billion in 2023, and Canada and Mexico took more than half of that value, a neighbor-to-neighbor pattern repeated inside the EU and the Gulf.
For a new entrant, the openings are private label for regional chains, hotel and laundry supply, contract filling and value brands in markets where liquids are still early.
Liquid detergent manufacturing process
Liquid detergent is made by batch or continuous cold blending, a simpler and far less energy-hungry route than spray drying. The plant mixes rather than dries, so most of the capital goes into tanks, pumps, controls and filling lines. This overview models a batch plant with two to three blending trains feeding bottle and pouch lines.
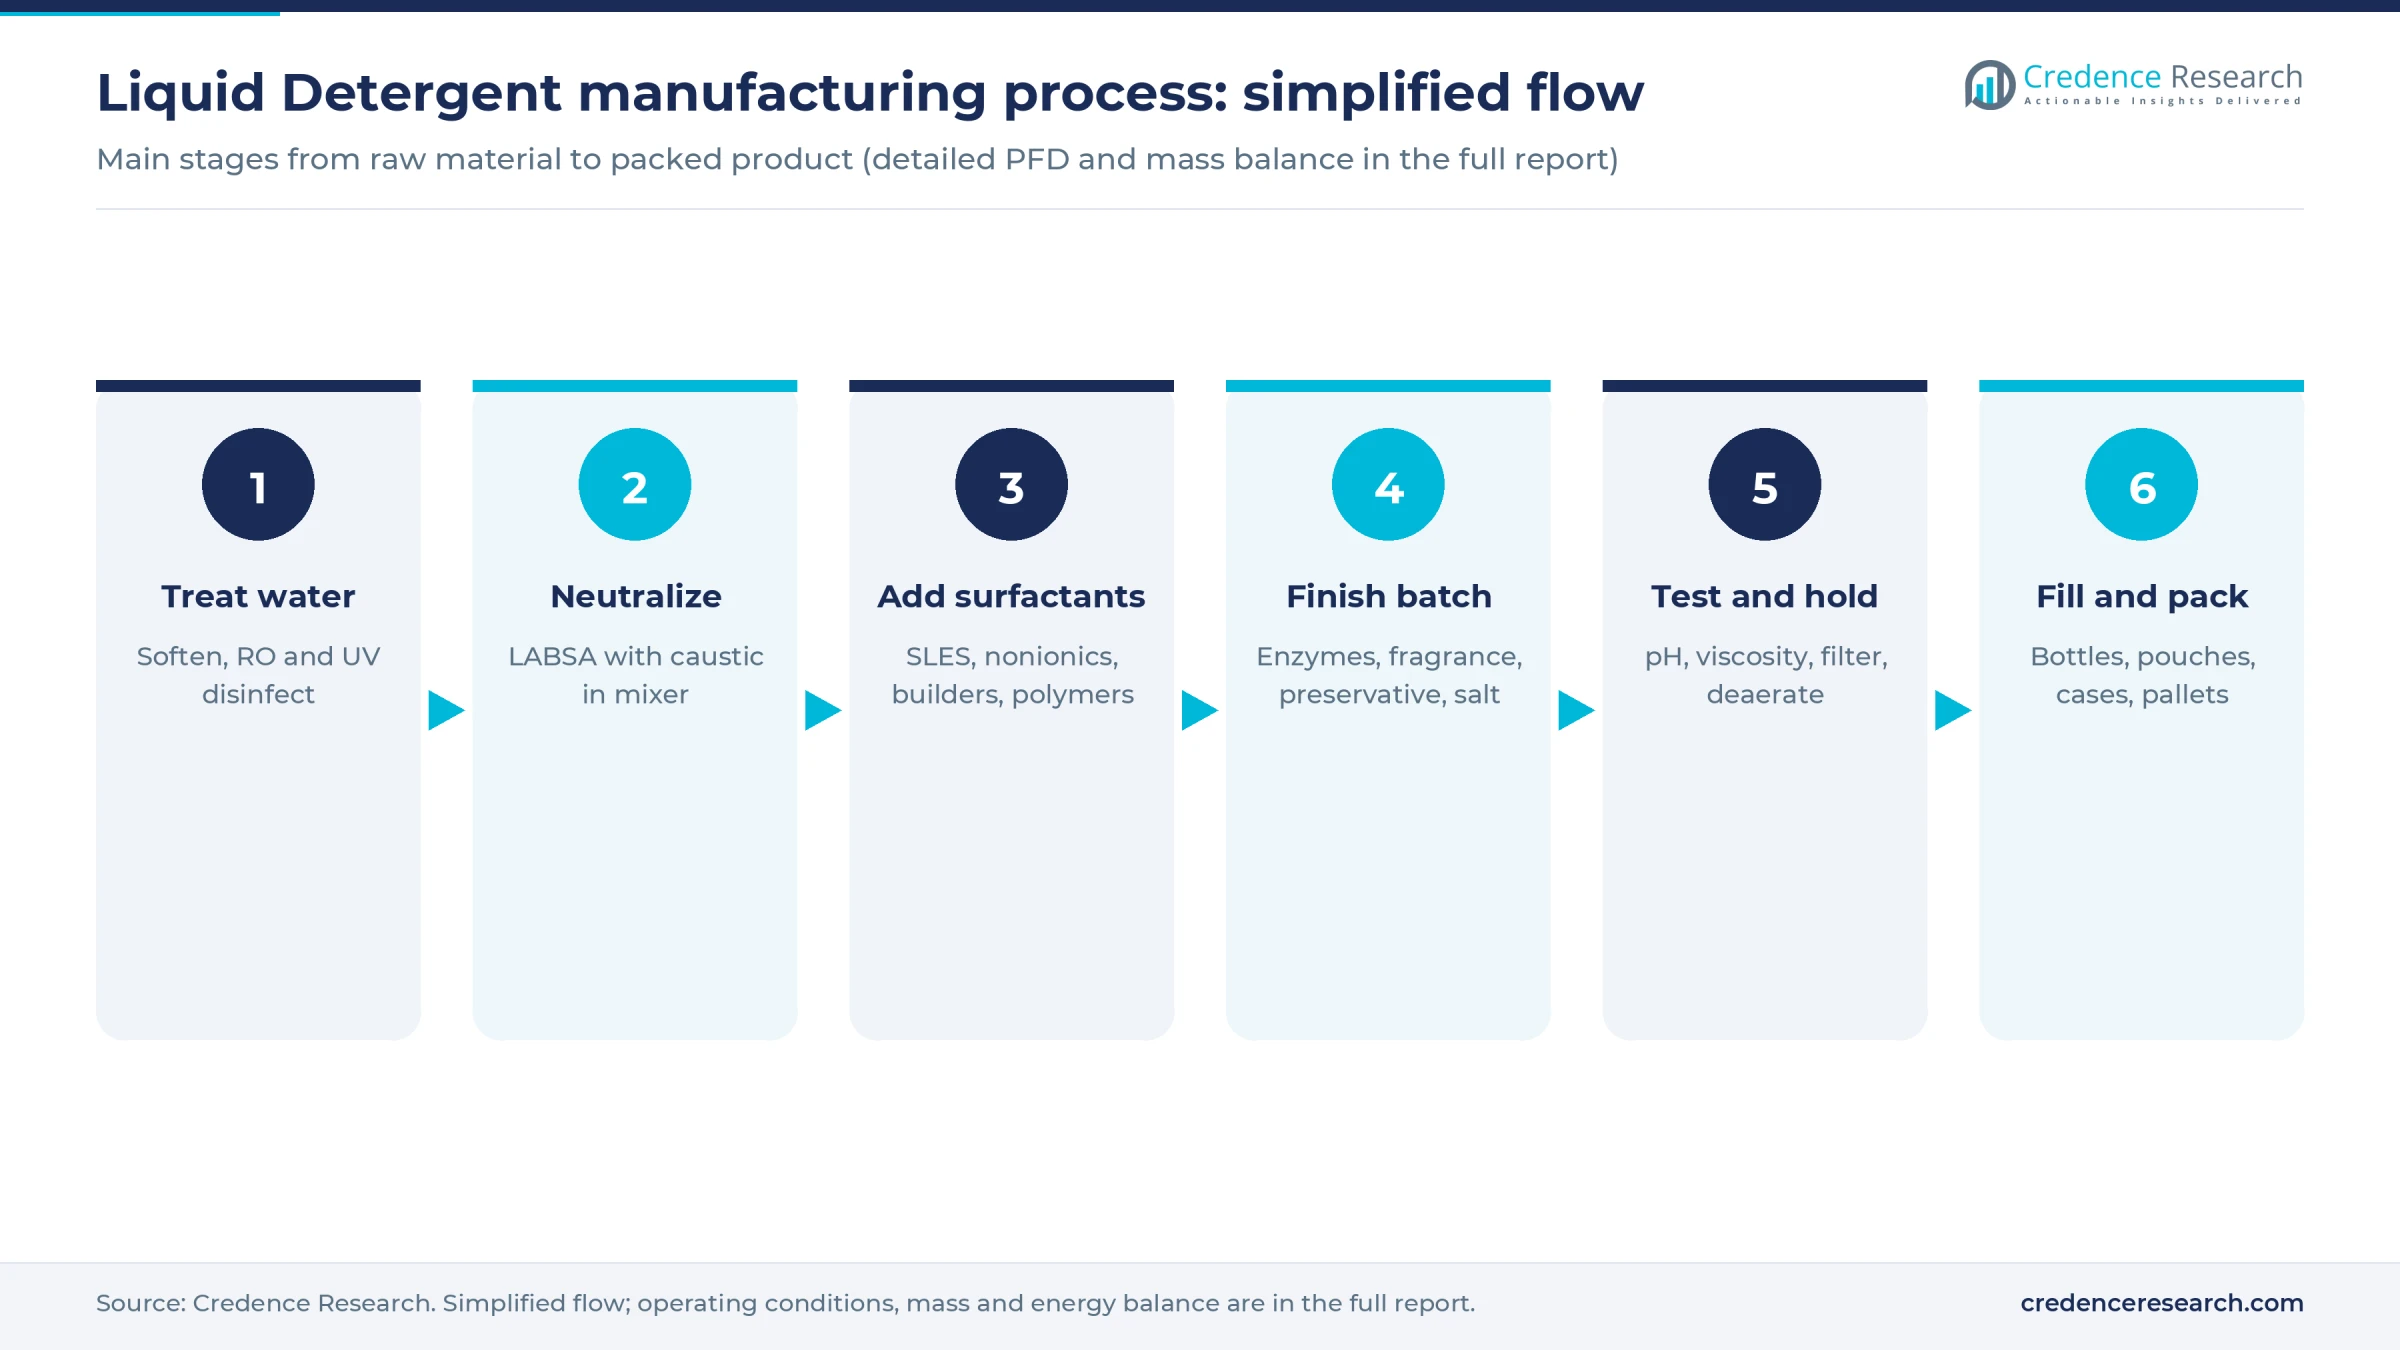
- Water treatment. Process water passes through softening, reverse osmosis and ultraviolet treatment, since hardness ions destabilize the formula and microbes cause odor, gas and color change in the bottle.
- Neutralization. Caustic soda solution is charged to a jacketed mixer and LABSA is fed slowly under agitation, forming sodium LAS. The reaction releases heat, so cooling water circulates and pH is held near neutral before anything else goes in. Fatty acid is neutralized at this stage when the formula includes soap.
- Surfactant and builder addition. SLES paste, nonionic ethoxylates, citrate or other soluble builders, polymers, optical brightener and hydrotropes are added in sequence, each fully dispersed before the next, to avoid gel phases that trap air and slow the batch.
- Finishing. Once the batch cools below about 35–40 degrees Celsius, enzymes, fragrance, dye and preservative are dosed, pH is trimmed and salt is added to build viscosity to the target value.
- Testing and holding. Each batch is checked for pH, viscosity, active matter, appearance and odor, then filtered and pumped to holding tanks to deaerate.
- Filling and packing. Rotary piston or flowmeter fillers dose bottles from 500 milliliters to 5 liters, followed by capping, induction sealing, labeling, case packing and palletizing. Pouch and sachet machines serve price-sensitive channels.
The hard part of the process is stability, not chemistry. A formula that separates, thickens or loses enzyme activity after three months on a hot shelf comes back as returns, so every reformulation goes through accelerated stability testing. Concentrated formulas and unit-dose capsules need tighter water control and dedicated lines, and are not included in this model.
Liquid detergent plant setup cost
This overview models a greenfield liquid detergent plant making 25,000 tonnes a year, at an estimated CapEx of USD 5–16 million excluding working capital. The low end reflects Asian-built stainless tanks and filling lines in an Asian industrial park, with bottles bought in. The high end adds in-house blow molding, European fillers, a larger warehouse and a U.S. or EU site.
Two disclosed projects bracket the modeled range. Ecuadorian consumer goods maker La Fabril announced a USD 8 million plant in Montecristi in September 2023 for liquid detergent, fabric softener and disinfectant, near the middle of the model. Procter & Gamble's first Ariel liquid detergent unit in India, at Kothur near Hyderabad, opened in May 2022 with about 2 billion rupees invested, roughly USD 26 million at an assumed 77 rupees per dollar. That sits above the model, reflecting multinational automation and quality systems. Neither project disclosed capacity, so assumed bottom-up estimates for equipment, buildings and utilities set the floor and ceiling.
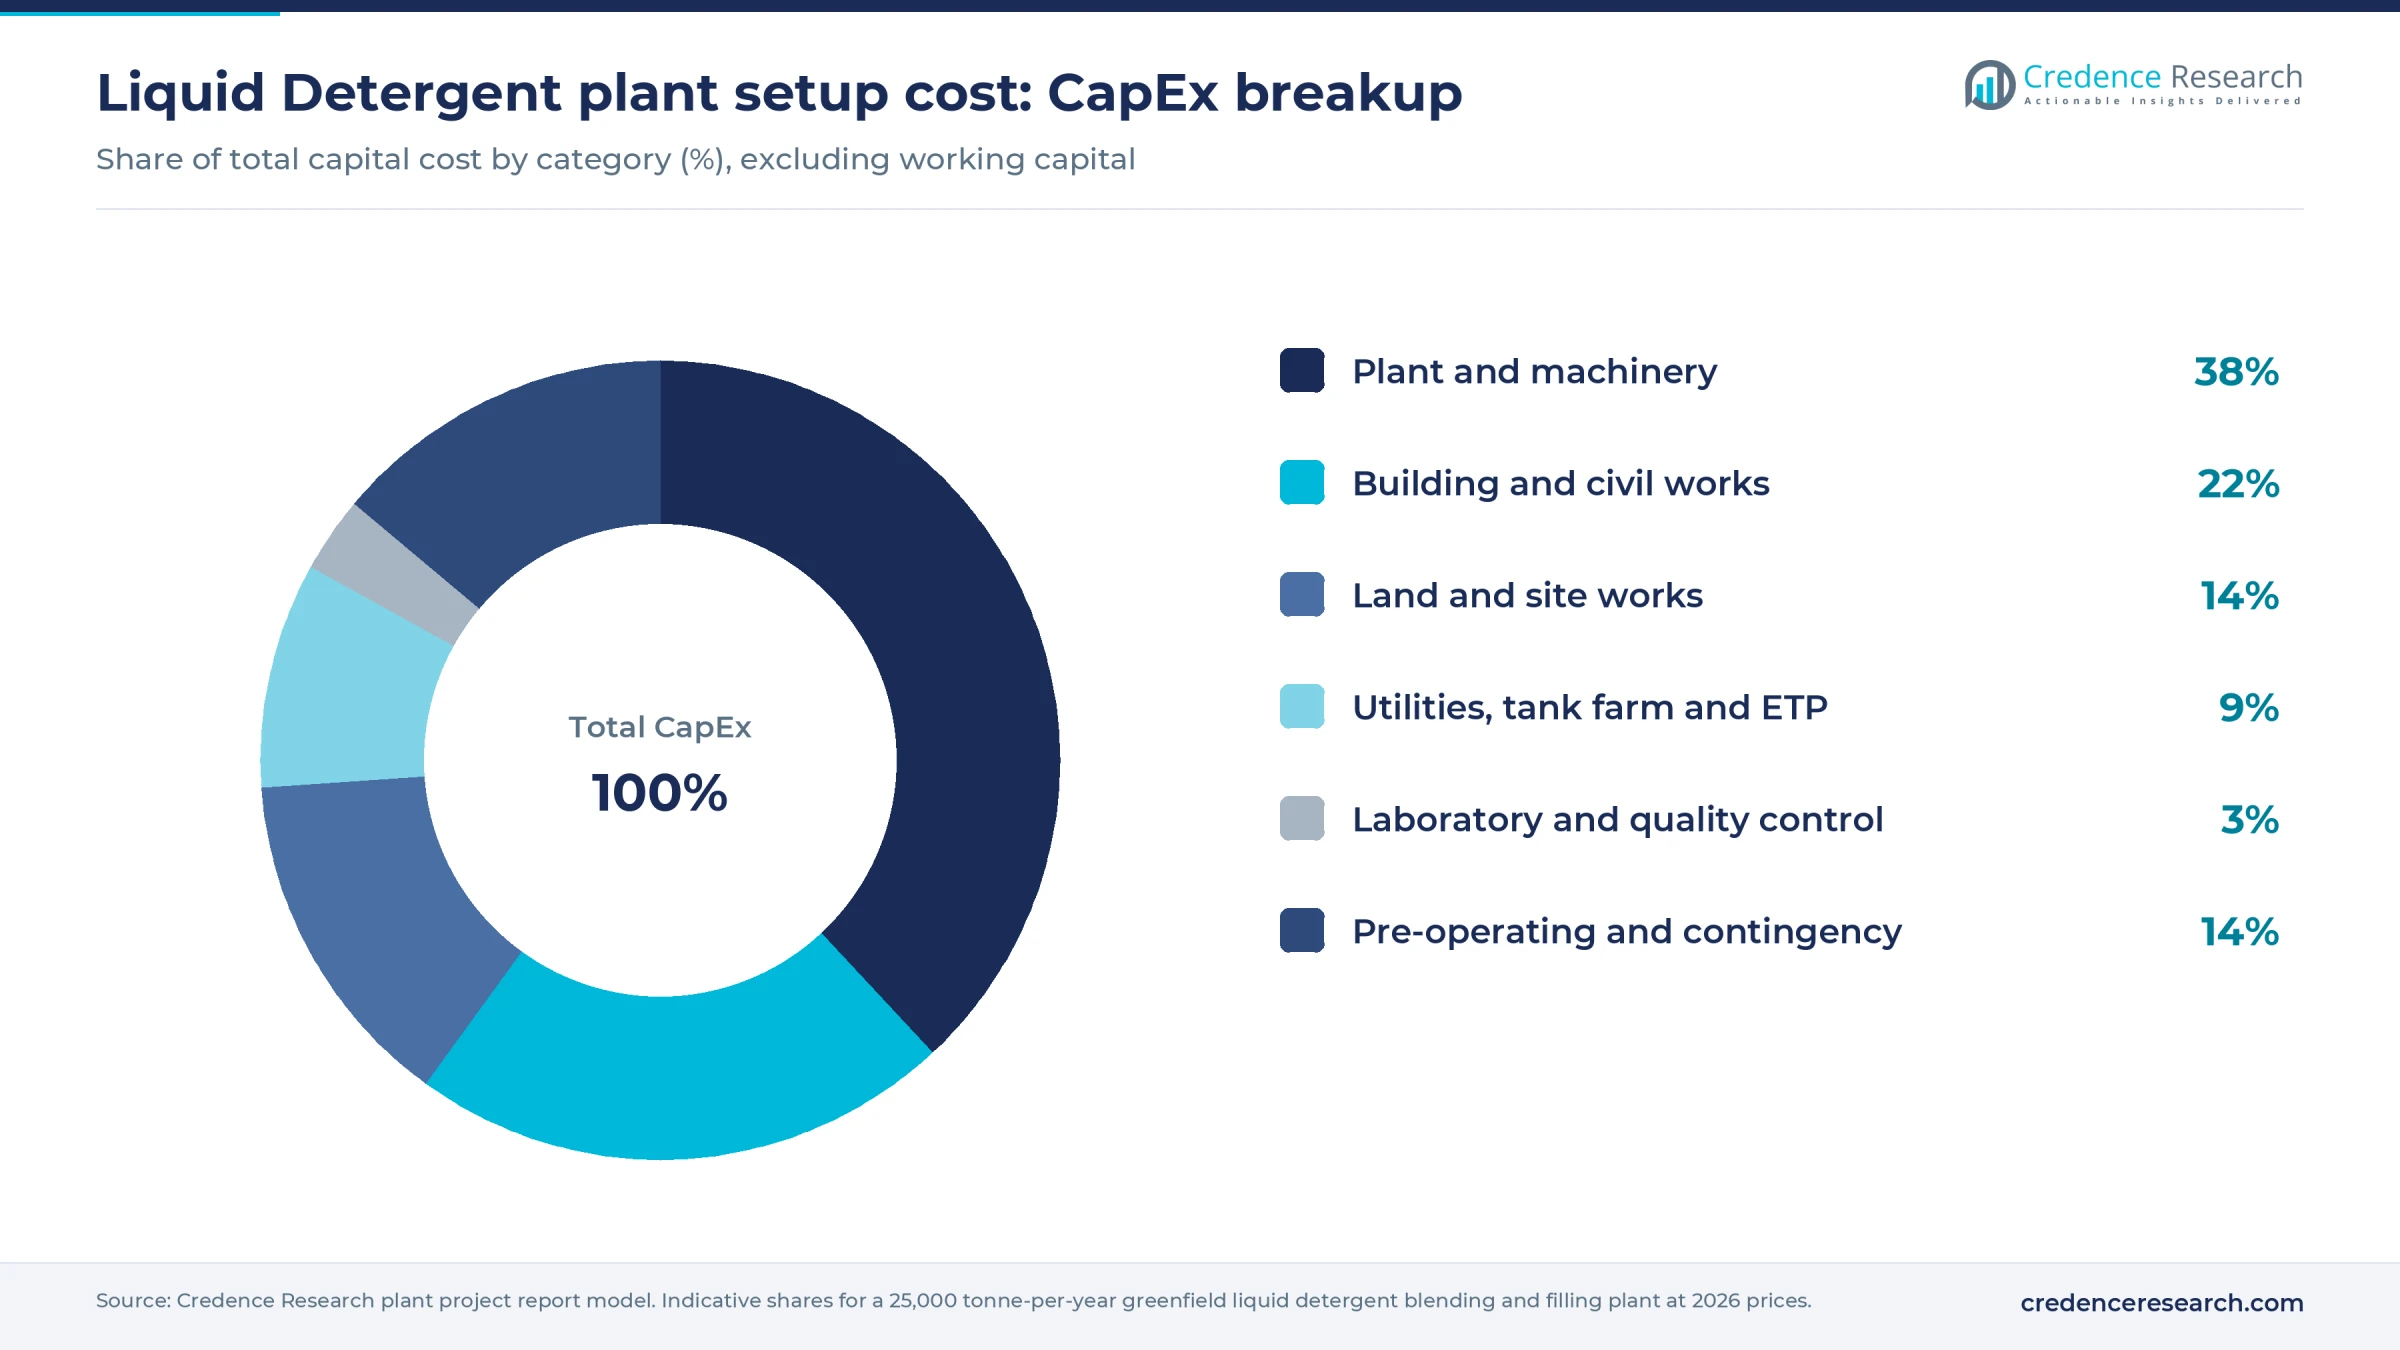
Worked example, land and site development. The model assumes a plot of 10,000–15,000 square meters for the tank farm, blending hall, filling hall and a finished goods warehouse sized for bulky bottles. At an assumed USD 30–80 per square meter in an Asian industrial park, the plot costs about USD 0.3–1.2 million, and at an assumed USD 60–200 at a U.S. or EU site, about USD 0.6–3 million. Site works add an assumed USD 0.2–0.5 million, so this row is about 10–22% of CapEx.
Working capital adds an estimated USD 2.5–4 million, mostly surfactants, bottles and caps in stock and about 45 days of receivables from retailers and distributors.
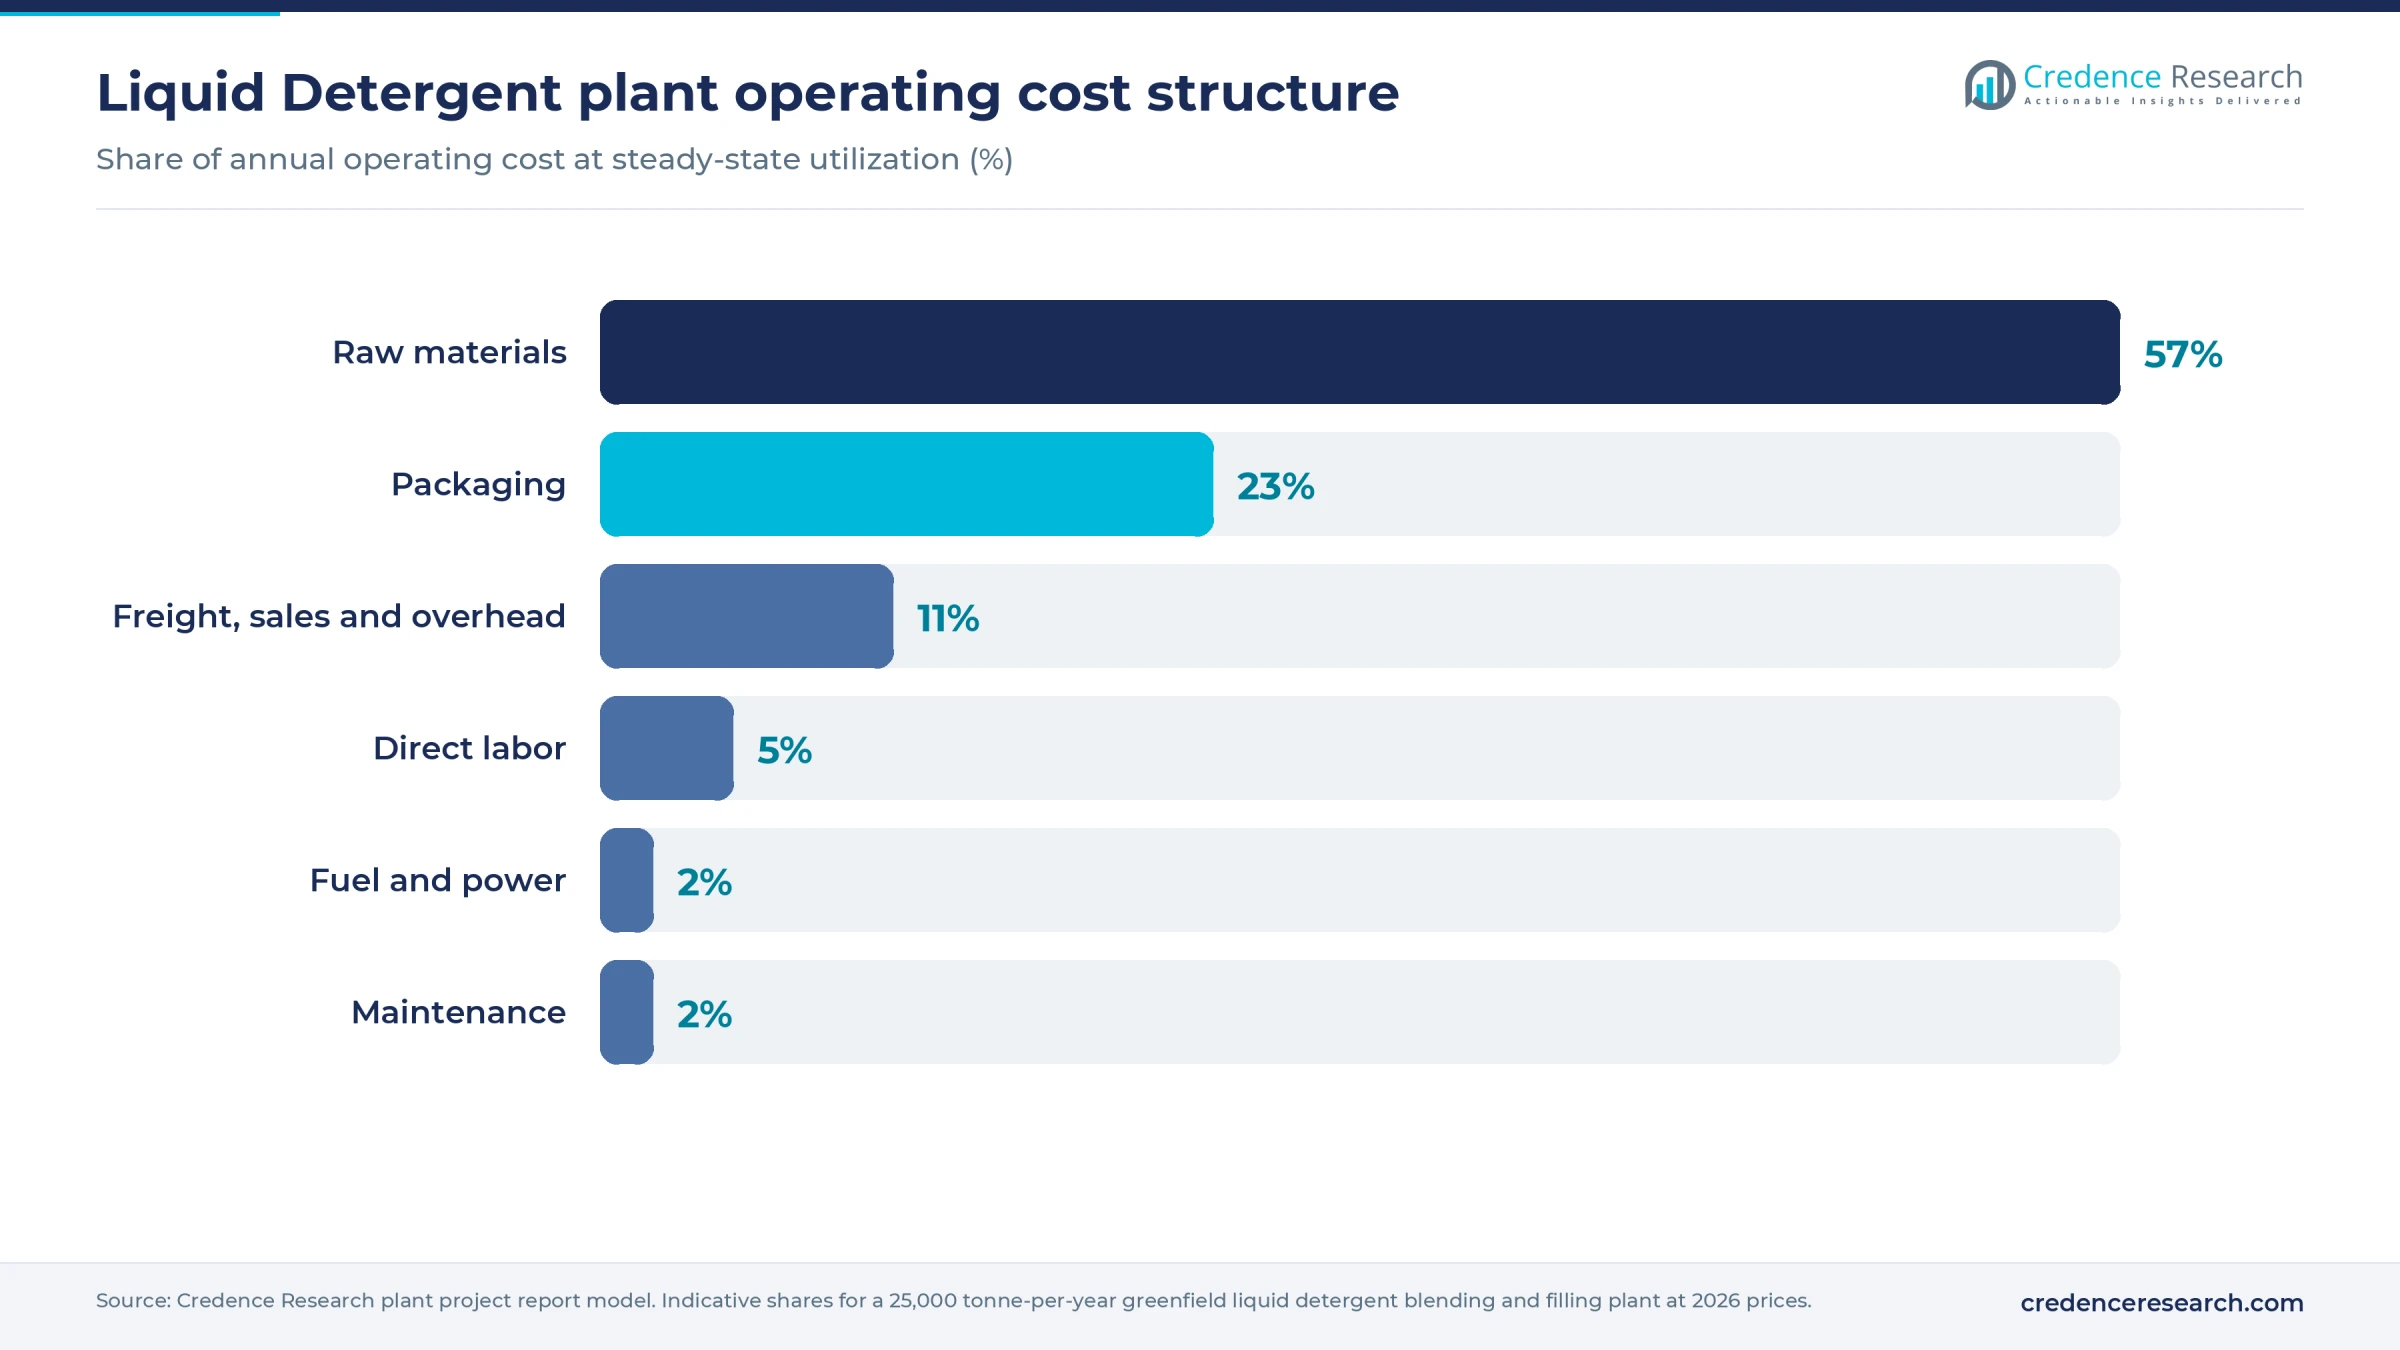
Packaging is the line that sets liquids apart from powder, at roughly a fifth of operating cost, because every tonne leaves the gate in plastic. A 10% rise in surfactant prices takes about 3 points off gross margin at the mid-range price, and a 10% rise in bottle and cap costs takes about 1.6 points. The full report can be customized to any country or region.
Machinery and raw materials for a liquid detergent plant
Core equipment includes bulk tanks for LABSA, SLES, nonionic surfactant, caustic soda and finished liquid, a water treatment skid with softener, reverse osmosis membranes and ultraviolet lamp, jacketed stainless mixing vessels of about 10–20 cubic meters with anchor and high-shear agitators, an inline homogenizer, dosing pumps with load cells or mass flowmeters, a plate heat exchanger and chiller, cartridge filters and a clean-in-place system. The packing hall needs bottle unscramblers, fillers, cappers, induction sealers, labelers, checkweighers, case packers and a palletizer, plus pouch machines and optional blow molding. The laboratory needs a viscometer, pH meter, stability ovens and a microbiology bench.
Raw materials come from distinct supply chains. LAB is made from kerosene-range paraffins and benzene at refinery-linked plants in Asia, the Middle East, Europe and the Americas. SLES and alcohol ethoxylates are built on fatty alcohols, drawn either from palm kernel and coconut oil, largely from Indonesia, Malaysia and the Philippines, or from ethylene in the U.S. Gulf Coast, the Middle East and Europe, and ethoxylation usually happens close to ethylene oxide plants because the gas is hazardous to ship, as covered in Credence Research's surfactants market study. Enzymes are fermented mainly in Europe, the United States and China, citric acid comes largely from China, and HDPE resin for bottles comes from petrochemical hubs in the Middle East, North America and Asia. Caustic soda is made locally in most markets.
Liquid detergent business profit margin and ROI
Liquid margins hinge on formula strength and pack mix. At an assumed ex-factory price of USD 780–950 per tonne for a regional mid-tier brand or private label, and an assumed USD 600–670 per tonne for materials, packaging and direct conversion, gross margin runs about 18–30%. The price assumption is informed by Indian business-to-business listings, where 5-liter jugs trade at about 55 rupees a liter and 1-liter bottles at 95–105 rupees, or roughly USD 0.60–1.20 a liter at an assumed 88 rupees per dollar.
Diluting a formula cuts cost quickly, since water is nearly free, but buyers judge liquids by thickness and results, and a thin product that needs a double dose loses repeat sales. Larger packs lower plastic per liter and lift margin, while small bottles and premium fragrances raise price per liter but add packaging. Private-label contracts bring steady volume at lower prices.
At 85% utilization the plant sells about 21,250 tonnes a year. Estimated post-tax cash generation of about USD 0.9–3.3 million supports a payback of about 2–7 years, including about six months of ramp-up. A top-of-range build recovers inside that window only near the upper end of the margin range. Main risks are surfactant and resin price swings, retailer price pressure and batches lost to microbial contamination.
| Metric | Value |
|---|---|
| IRR | Available in report |
| NPV | Available in report |
| ROI | Available in report |
| DSCR | Available in report |
How to start a liquid detergent business, licenses and approvals
A liquid detergent plant needs approvals in seven areas in most jurisdictions. These are business and tax registration; land use, zoning and building permits; an environmental permit or consent, mainly for wash-down wastewater, since cold blending emits little to air; fire and occupational safety approval for acid, caustic and flammable fragrance storage; chemical registration or notification of ingredients; detergent composition and labeling rules, including disclosure of preservatives and fragrance allergens; and packaged-goods and customs registration. Sanitizing claims add a biocide or pesticide registration.
| Market | Product rules | Plant permits |
|---|---|---|
| United States | EPA TSCA Inventory status for every ingredient; Federal Hazardous Substances Act labeling, enforced by the Consumer Product Safety Commission; ingredient disclosure under California's Cleaning Product Right to Know Act; EPA registration under FIFRA for any product that claims to sanitize or disinfect | NPDES or local pretreatment permit for wastewater; state air permit or exemption; OSHA Hazard Communication Standard |
| European Union | Detergents Regulation (EC) No 648/2004 for surfactant biodegradability and labeling, including preservatives and listed fragrance allergens; CLP classification, labeling and poison center notification, with opaque, hard-to-open outer packaging and a bittering agent required for liquid laundry capsules; in-can preservatives approved under the Biocidal Products Regulation | National environmental permit for wastewater; national safety and fire rules |
| India | Packer registration under the Legal Metrology (Packaged Commodities) Rules, 2011; BIS IS 9458:2020 for detergents sold for wool and silk, with no dedicated household liquid laundry standard in the BIS soaps and detergents list | Consent to establish and consent to operate from the state pollution control board; factory license; fire no-objection certificate |
The EU is replacing its detergent law with Regulation (EU) 2026/405, published in March 2026. It adds digital labeling and applies from Sept. 23, 2029.
Key liquid detergent manufacturers and recent developments
Global production is led by Procter & Gamble, with Tide, Ariel and Gain, Unilever, with OMO, Surf, Persil in the United Kingdom and Comfort, and Henkel, with Persil and all, alongside Church & Dwight's Arm & Hammer in the United States and Kao and Lion in Japan. China has its own liquid leaders, including Blue Moon, Guangzhou Liby and Nice Group, and regional makers include Wings in Indonesia, Godrej Consumer Products and Jyothy Labs in India and La Fabril in Ecuador.
- February 2026. Dangote Group announced a 400,000-tonne-a-year linear alkylbenzene plant at its Lekki refinery complex in Nigeria, a future regional source of the feedstock behind LABSA, the main anionic surfactant in laundry liquids.
- March 2026. Unilever Philippines opened its first factory outside Luzon, a 1,600-square-meter site in Mandaue City, Cebu, run with local partners to make Surf fabric conditioners and Fabclean liquids for the Visayas and Mindanao.
- July 2026. Lion announced NANOX Deep-Penetrating Clean, a liquid laundry detergent designed to reach into fibers and remove persistent odors and stains.
The pattern favors plants that fill close to consumers and compete on performance claims.
What's inside the Liquid Detergent project report PDF
The report runs to 21 chapters. Open a chapter to see its sections.
1. Preface
2. Scope and Methodology
- 2.1 Objectives of the Study
- 2.2 Stakeholders
- 2.3 Research Methodology
- 2.4 Data Sources and Key Assumptions
3. Executive Summary
- 3.1 Market Snapshot
- 3.2 Project at a Glance (Capacity, CapEx, OpEx)
- 3.3 Key Financial Indicators (IRR, NPV, Payback, Break-even)
- 3.4 Feasibility Verdict
4. Product Overview
- 4.1 Liquid Detergent Definition and Properties
- 4.2 Grades and Specifications (BIS / ISO / ASTM)
- 4.3 HS Code and Classification
- 4.4 Key Applications
- 4.5 Substitutes
5. Global Liquid Detergent Market
- 5.1 Market Overview
- 5.2 Historical and Current Market Performance (Volume and Value)
- 5.3 Market Breakup by Grade / Type
- 5.4 Market Breakup by End-Use Industry
- 5.5 Market Breakup by Region
- 5.6 Market Drivers, Restraints and Trends
- 5.7 Value Chain Analysis
- 5.8 Market Forecast
6. Target Country Liquid Detergent Market Analysis
- 6.1 Demand and Supply Analysis
- 6.2 Installed Capacity vs Demand Gap
- 6.3 Import Dependence
- 6.4 Demand Forecast by End-Use
7. Trade Analysis
- 7.1 Imports by Volume, Value and Country
- 7.2 Exports by Volume, Value and Country
- 7.3 Trade Balance and Opportunities
8. Price Analysis
- 8.1 Historical Liquid Detergent Price Trends by Region
- 8.2 Raw Material / Feedstock Price Trends and Linkage
- 8.3 Price Forecast
- 8.4 Margins Across the Value Chain
9. Competitive Landscape
- 9.1 Market Structure
- 9.2 Key Players and Installed Capacities
- 9.3 Profiles of Key Players
- 9.4 Recent Developments (Expansions, M&A, New Plants)
10. Manufacturing Process and Technology
- 10.1 Comparison of Technology Routes
- 10.2 Selected Route and Process Flow Diagram
- 10.3 Unit Operations Involved
- 10.4 Chemical Reactions Involved
- 10.5 Mass Balance and Raw Material Requirements
- 10.6 Energy Balance
- 10.7 Quality Assurance Criteria and Technical Tests
- 10.8 By-products and Waste Handling
- 10.9 Technology Licensors / Providers
11. Project Details, Requirements and Costs
- 11.1 Land, Location and Site Development
- 11.1.1 Site Selection Criteria
- 11.1.2 Location Analysis
- 11.1.3 Land Requirement and Costs
- 11.1.4 Site Development Costs
- 11.2 Plant Layout
- 11.2.1 Layout Principles
- 11.2.2 Proposed Layout
- 11.2.3 Factors Influencing Layout
- 11.3 Civil Works and Buildings
- 11.4 Plant Machinery
- 11.4.1 Machinery Requirements and Specifications
- 11.4.2 Machinery Costs
- 11.4.3 Machinery Suppliers
- 11.5 Raw Materials
- 11.5.1 Requirements per Tonne of Output
- 11.5.2 Procurement and Sourcing
- 11.5.3 Costs
- 11.5.4 Suppliers
- 11.6 Packaging
- 11.6.1 Packaging Requirements
- 11.6.2 Packaging Costs
- 11.6.3 Packaging Suppliers
- 11.7 Storage and Material Handling
- 11.8 Transportation Requirements and Costs
- 11.9 Utilities
- 11.9.1 Power Requirements and Costs
- 11.9.2 Water Requirements and Costs
- 11.9.3 Steam, Fuel and Other Utilities
- 11.10 Manpower Requirements and Wages
12. Environment, Health, Safety and Sustainability
- 12.1 Effluent and Emissions Management
- 12.2 Hazard Classification and Safety Measures
- 12.3 Carbon Footprint
- 12.4 Green / Low-Carbon Process Options
13. Regulatory Procedures, Approvals and Certifications
- 13.1 Licences and Registrations
- 13.2 Environmental Clearances
- 13.3 Product Certifications (BIS, REACH, etc.)
- 13.4 Approval Timeline
14. Project Implementation Schedule
15. Project Economics
- 15.1 Capital Cost of the Project
- 15.2 Techno-Economic Parameters
- 15.3 Capacity Utilization and Ramp-up
- 15.4 Product Pricing and Margins
- 15.5 Income Projections
- 15.6 Expenditure Projections
- 15.7 Working Capital Requirement
- 15.8 Taxation
- 15.9 Depreciation
16. Financial Analysis
- 16.1 Projected Profit and Loss Account
- 16.2 Projected Cash Flow Statement
- 16.3 Projected Balance Sheet
- 16.4 Liquidity Analysis
- 16.5 Profitability Analysis (Payback, NPV, IRR, ROI)
- 16.6 Break-even Analysis
- 16.7 Debt Service Coverage Ratio (DSCR)
- 16.8 Sensitivity Analysis
- 16.9 Scenario and Uncertainty Analysis
17. Funding and Incentives
- 17.1 Means of Finance and Debt-Equity Structure
- 17.2 Loans and Financial Assistance
- 17.3 Government Schemes and Subsidies (PLI, State Policies)
18. Risk Assessment
- 18.1 Key Success Factors
- 18.2 Key Risk Factors
- 18.3 Risk Mitigation
19. Strategic Recommendations
20. Case Study of a Successful Venture
21. Appendix
- 21.1 Detailed Assumptions
- 21.2 Abbreviations
- 21.3 List of Tables and Figures
- 21.4 Sources
This page vs. the full report
| Data point | On this page (free) | In the full report |
|---|---|---|
| Total CapEx | One rounded range at one capacity | Exact figure at three capacities with a line-item breakup |
| CapEx breakup | Category shares (%) only | Cost, quantity and supplier for every machine |
| Operating cost | Share of raw materials, utilities and labor | Per-unit cost sheet with each input price and consumption |
| Profitability | Gross margin range and payback band | Exact IRR, NPV, ROI, break-even and DSCR |
| Financial statements | List of what is included | 10-year P&L, cash flow, balance sheet and Excel model |
| Sensitivity | One directional line | Full sensitivity and scenario tables |
| Process | Simplified flow diagram | Detailed process flow, mass and energy balance, operating conditions |
| Machinery | Names of the main machines | Specifications, capacity, cost and supplier list |
| Market | Headline size, growth and global demand | Segment, region, trade and price forecast tables |
| Suppliers and buyers | Supplier types and sourcing hubs | Named suppliers and buyers |
Liquid Detergent project report: FAQs
How much does it cost to set up a liquid detergent plant?
What gross margin can a liquid detergent manufacturer expect?
How long is the payback on a liquid detergent factory?
Is a liquid detergent plant cheaper than a powder plant?
Which raw materials matter most in liquid detergent?
Which approvals matter most for liquid detergent manufacturing?

About the analyst
Rajdeep Kumar Deb, Lead Analyst - Consumer & Finance
Rajdeep brings a decade of consumer goods and financial services insight to strategic market analysis.
Related market research
- Liquid Detergent Market Size, Share, Growth and Forecast 2032
- High Efficiency Laundry Liquid Detergent Market Size, Share & Forecast 2032
- Liquid Laundry Detergent Market Size, Growth and Forecast 2032
- Laundry Care Market Size, Share, Growth and Forecast 2032
- Surfactants Market Size, Share, Growth & Forecast to 2032
- Natural Surfactant Market Size, Growth, Share and Forecast 2032
More plant project reports
- Mustard Oil Processing Plant Project Report (DPR) 2026
- Hair Color Manufacturing Plant Project Report (DPR) 2026
- Cotton Seed Oil Processing Plant Project Report (DPR) 2026
- Detergent Powder Manufacturing Plant Project Report (DPR) 2026
- Essential Oil Manufacturing Plant Project Report (DPR) 2026
- Cigarette Lighter Manufacturing Plant Project Report (DPR) 2026