
rPET Flakes Market Overview:
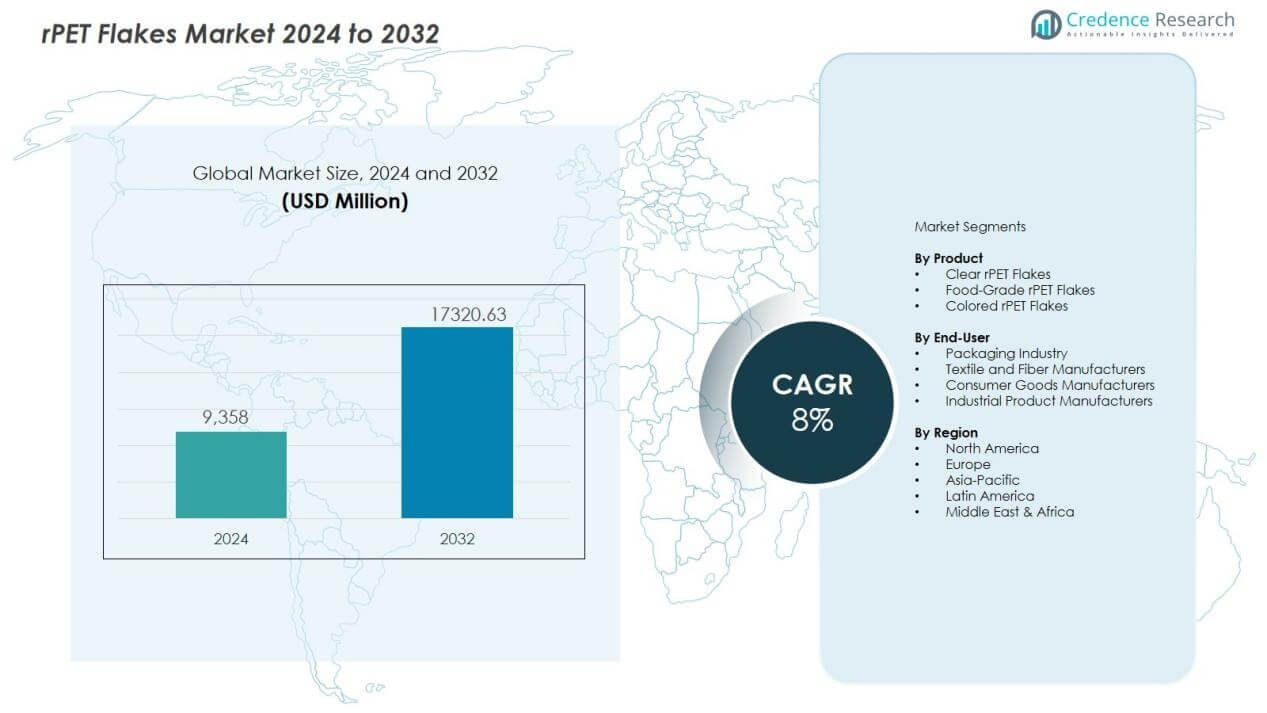
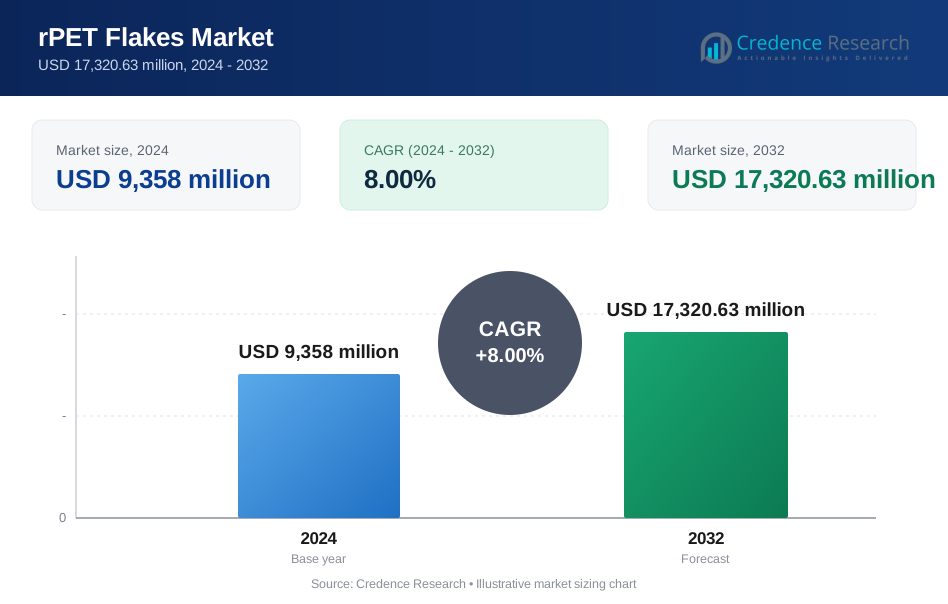
The rPET Flakes Market size was valued at USD 9,358 million in 2024 and is anticipated to reach USD 17320.63 million by 2032, at a CAGR of 8% during the forecast period.
| REPORT ATTRIBUTE | DETAILS |
|---|---|
| Historical Period | 2020-2024 |
| Base Year | 2025 |
| Forecast Period | 2026-2032 |
| rPET Flakes Market Size 2024 | USD 9,358 million |
| rPET Flakes Market, CAGR | 8% |
| rPET Flakes Market Size 2032 | USD 17320.63 million |
rPET Flakes Market Insights:
- Europe (34%), Asia-Pacific (32%), and North America (21%) represent the top three regional shares, driven respectively by strict regulatory enforcement, high beverage and textile demand with capacity investment, and corporate sustainability targets supported by recycling infrastructure.
- Asia-Pacific, with a 32% share, stands as the fastest-growing region due to rising beverage consumption, expanding apparel manufacturing, improving collection systems, and increasing domestic recycling investments.
- By product, Clear rPET flakes account for 48% of demand due to dominance in bottle-to-bottle applications, while Food-grade rPET flakes hold 29%, supported by regulatory compliance needs in food and personal care packaging.
- By end-user, Packaging represents 52% of total consumption, followed by Textiles at 31%, reflecting strong recycled-content adoption in beverage bottles and recycled polyester fiber production.
rPET Flakes Market Drivers:
Regulatory Mandates for Recycled Content Compliance and Circularity Targets
The rPET Flakes Market gains momentum from binding recycled-content mandates across beverage, packaging, and consumer goods sectors. Governments enforce minimum thresholds for recycled PET in bottles and thermoformed packaging, which compels converters to secure consistent flake supply. Extended producer responsibility frameworks raise collection rates and improve feedstock availability. It benefits from clearer compliance pathways that favor mechanically recycled flakes with certified traceability. Policy certainty supports long-term contracts and capacity planning across the value chain.
- For instance, Coca-Cola achieved 100% rPET bottle production in select European markets by 2025 through its World Without Waste initiative, enabling compliance with EU directives requiring 25% recycled content.
Brand Sustainability Commitments and Procurement Specifications
The rPET Flakes Market advances due to corporate sustainability pledges that require verified recycled inputs at scale. Global brands embed recycled-content criteria into procurement, which shifts demand toward food-grade and premium flakes. Retail pressure and consumer preference for low-impact packaging reinforce adoption. It responds through quality upgrades and certification programs that meet brand audits. These dynamics stabilize offtake and support price premiums for high-purity material.
- For instance, Coca-Cola committed to using 50% recycled content in its PET bottles across Europe by 2025, sourcing food-grade rPET flakes to meet these targets through verified suppliers.
Technology Progress in Sorting, Washing, and Decontamination
The rPET Flakes Market expands with technology progress that lifts yield, purity, and consistency. Advanced optical sorting, hot washing, and solid-state decontamination raise suitability for food contact. Process automation improves throughput and reduces variability across batches. It enables penetration into bottles, trays, and high-tenacity fibers. Improved performance narrows the gap with virgin PET in critical applications.
Cost Volatility of Virgin PET and Supply Security Considerations
The rPET Flakes Market benefits when virgin PET prices fluctuate and supply risks rise. Recycled flakes offer procurement stability through diversified feedstock and local sourcing. Converters value predictable input costs that protect margins during resin cycles. It aligns with supply-chain resilience strategies and domestic recycling investment. These factors strengthen demand across packaging and textiles.
rPET Flakes Market Trends:
Shift Toward Food-Grade and Bottle-to-Bottle Quality Standards Across Value Chains
The rPET Flakes Market trends toward higher adoption of food-grade and bottle-to-bottle quality standards across packaging value chains. Brand owners specify tighter limits on color, intrinsic viscosity, and contaminant levels to secure consistent performance. Recycling operators prioritize advanced washing, super-clean decontamination, and stricter bale selection. It supports greater use of recycled flakes in beverage bottles, trays, and personal care packaging. Certification schemes and third-party audits gain prominence to validate compliance. Long-term offtake agreements align recyclers and converters around stable quality benchmarks. This shift elevates average selling prices for premium flakes.
- For instance, Coca-Cola Europe employs advanced rPET processes achieving contamination below 100 ppm in flakes for direct bottle use, enabling 50% rPET content in select beverages.
Expansion of Closed-Loop Recycling Systems and Regional Capacity Localization
The rPET Flakes Market shows a clear trend toward closed-loop recycling systems and localized processing capacity. Beverage and consumer goods companies invest in collection partnerships and dedicated recycling assets. It reduces dependency on long-distance feedstock movement and improves supply reliability. Regional capacity expansion shortens lead times and lowers logistics costs. Recycling hubs emerge near high-consumption urban centers to secure post-consumer PET. Digital traceability tools gain adoption to track material origin and quality. These developments strengthen circular supply chains and support scalable recycled-content targets.
- For instance, Coca-Cola established a closed-loop system in partnership with local recyclers in India, processing post-consumer PET bottles into food-grade rPET flakes at regional facilities near urban centers.
rPET Flakes Market Challenges Analysis:
Inconsistent Feedstock Quality and Structural Constraints in Collection Systems
The rPET Flakes Market faces persistent challenges from inconsistent post-consumer PET feedstock quality. Variations in bottle color, polymer composition, and contamination levels limit yield and raise processing costs. Collection systems in many regions lack standardization and adequate segregation. It increases reliance on manual sorting and rejects material that fails quality thresholds. Seasonal fluctuations in collection volumes disrupt operating stability. These factors constrain scalability and hinder uniform supply to converters.
Cost Pressure from Processing Intensity and Competitive Material Economics
The rPET Flakes Market encounters cost pressure due to energy-intensive washing, sorting, and decontamination processes. Capital expenditure for advanced recycling lines remains high for small and mid-scale operators. It competes with virgin PET during periods of low resin pricing. Margin compression emerges when recycled-content premiums narrow. Logistics expenses rise where feedstock sources sit far from processing hubs. These challenges limit profitability and slow capacity expansion in price-sensitive regions.
rPET Flakes Market Opportunities:
Rising Demand for High-Purity Recycled Content Across Food and Personal Care Packaging
The rPET Flakes Market presents strong opportunities through rising demand for high-purity recycled content in food and personal care packaging. Brand commitments to circular packaging create sustained demand for certified flakes. Regulatory recycled-content targets support long-term procurement visibility. It enables recyclers to secure premium pricing for food-grade output. Investment in advanced decontamination expands addressable end uses. Strategic partnerships with converters strengthen demand certainty. These factors improve return profiles for quality-focused capacity.
Emergence of Regional Recycling Hubs and Closed-Loop Supply Models
The rPET Flakes Market gains opportunity from regional recycling hubs and closed-loop supply models. Localized processing reduces logistics exposure and improves feedstock access. It supports stable supply agreements with beverage and consumer goods producers. Public–private collaboration enhances collection efficiency and infrastructure funding. Digital traceability builds confidence across value chains. Expansion in emerging economies opens new growth corridors. These developments support scalable circular economy adoption.
rPET Flakes Market Segmentation Analysis:
By Product
The rPET Flakes Market by product centers on clear flakes, colored flakes, and food-grade flakes, each serving distinct performance and compliance needs. Clear flakes command the largest share due to suitability for bottle-to-bottle and tray applications that demand high transparency and consistent intrinsic viscosity. Food-grade flakes register faster growth as brand owners adopt recycled content for beverages and personal care packaging under strict safety standards. Colored flakes maintain steady demand in fibers, strapping, and non-food packaging where aesthetics permit variability. It benefits from quality differentiation, with premium grades earning price uplifts tied to purity, color control, and certification. Technology upgrades elevate yield and widen application scope across product classes.
- For instance, Eastman's methanolysis process achieves virgin-quality monomers from PET waste, enabling 95% yield in clear flake production for premium packaging.
By End-User
The rPET Flakes Market by end-user spans packaging, textiles, consumer goods, and industrial applications, with packaging leading consumption. Beverage bottles and thermoformed packaging drive volumes due to regulatory targets and brand commitments to circular materials. Textiles follow as apparel producers expand recycled polyester fiber use for sustainability claims and cost stability. Consumer goods adopt recycled flakes in rigid packaging and molded parts to meet procurement criteria. Industrial uses such as strapping and sheets provide baseline demand with tolerant specifications. It gains resilience from diversified end-use exposure that balances premium food contact demand with volume fiber markets.
- For Instance, Indorama Ventures has established a goal to recycle 1.5 million tons of post-consumer PET annually by 2030.
Segmentations:
By Product
- Clear rPET Flakes
- Food-Grade rPET Flakes
- Colored rPET Flakes
By End-User
- Packaging Industry
- Textile and Fiber Manufacturers
- Consumer Goods Manufacturers
- Industrial Product Manufacturers
By Region
- North America
- U.S.
- Canada
- Mexico
- Europe
- Germany
- France
- U.K.
- Italy
- Spain
- Rest of Europe
- Asia Pacific
- China
- Japan
- India
- South Korea
- South-east Asia
- Rest of Asia Pacific
- Latin America
- Brazil
- Argentina
- Rest of Latin America
- Middle East & Africa
- GCC Countries
- South Africa
- Rest of the Middle East and Africa
Regional Analysis:
Europe Leads Through Regulatory Enforcement and Advanced Recycling Infrastructure
The rPET Flakes Market in Europe reflects strong leadership driven by strict recycled-content mandates and well-established recycling systems. The region enforces binding targets for recycled PET use in beverage bottles and food packaging. Collection rates remain high due to deposit return schemes and mature waste segregation practices. It benefits from advanced sorting, washing, and decontamination capacity that supports food-grade output. Brand owners secure long-term supply contracts to ensure compliance and quality. Price premiums persist for certified flakes that meet safety and traceability standards. Europe maintains stable demand across packaging and fibers.
North America Shows Steady Growth Supported by Corporate Commitments
The rPET Flakes Market in North America advances through corporate sustainability targets and expanding recycling infrastructure. Beverage and consumer goods companies commit to recycled-content goals that drive procurement of high-quality flakes. Collection systems improve through state-level policies and private investment. It supports growing use in bottles, trays, and personal care packaging. Technology upgrades enhance yield and reduce contamination risks. Cost sensitivity remains present during low virgin resin cycles. Demand shows consistent growth across packaging and textiles.
Asia-Pacific Expands Rapidly with Volume Growth and Capacity Investment
The rPET Flakes Market in Asia-Pacific records rapid expansion supported by rising beverage consumption and textile manufacturing. Countries invest in recycling capacity to secure domestic feedstock and reduce import reliance. Collection efficiency improves through urban waste reforms and private-sector participation. It serves both packaging and fiber applications at scale. Export-oriented recyclers target certified flakes for global brands. The region shows strong volume growth with gradual quality improvement.
Key Player Analysis:
- Clear Path Recycling LLC
- Verdeco Recycling
- Indorama Ventures Public Ltd.
- PolyQuest
- Evergreen Plastics, Inc.
- Biffa
- GSM Plastic Industries
- RCS Entsorgung GmbH
- TOMRA System ASA
- Polyvim LLC
- Veolia Umweltservice GmbH
- AMAANI POLYFLAKES
Competitive Analysis:
The rPET Flakes Market features a competitive landscape shaped by scale, feedstock access, and quality assurance capabilities. Large integrated recyclers such as Indorama Ventures and Veolia leverage global collection networks and advanced processing to supply food-grade flakes at volume. Packaging specialists like Plastipak and ALPLA align recycling output with captive demand, which strengthens supply security. Asian producers such as Far Eastern New Century focus on fiber and bottle applications with cost-efficient operations. It shows rising competition on purity, certification, and long-term offtake agreements. Players invest in hot washing, super-clean decontamination, and traceability to meet brand audits. Regional mid-sized recyclers compete through localized feedstock control and flexible pricing. Competitive intensity increases as brand commitments tighten quality thresholds and favor reliable suppliers.
Recent Developments:
- In August 2025, Indorama Ventures announced recycling 150 billion PET bottles since 2011, with facilities processing 789 bottles per second into rPET resins.
- In February 2024, TOMRA further strengthened its AI position by taking a 25% stake in waste analysis startup PolyPerception, broadening their strategic AI alliance.
Report Coverage:
The research report offers an in-depth analysis based on Product, End-User and Region. It details leading Market players, providing an overview of their business, product offerings, investments, revenue streams, and key applications. Additionally, the report includes insights into the competitive environment, SWOT analysis, current Market trends, as well as the primary drivers and constraints. Furthermore, it discusses various factors that have driven Market expansion in recent years. The report also explores Market dynamics, regulatory scenarios, and technological advancements that are shaping the industry. It assesses the impact of external factors and global economic changes on Market growth. Lastly, it provides strategic recommendations for new entrants and established companies to navigate the complexities of the Market.
Future Outlook:
- The rPET Flakes Market will advance as recycled-content mandates tighten across beverage, food, and personal care packaging, reinforcing durable demand for certified output.
- Producers will prioritize food-grade quality, traceability, and audit readiness to secure long-term contracts with global brand owners.
- Technology upgrades in sorting, washing, and decontamination will lift yield consistency and expand eligibility for high-value applications.
- Closed-loop partnerships between brands, converters, and recyclers will strengthen supply security and stabilize offtake.
- Regional recycling hubs will grow near consumption centers to reduce logistics exposure and improve feedstock access.
- Textiles will remain a volume anchor while packaging captures a rising share of premium grades.
- Digital tracking and certification will become standard requirements for procurement and compliance reviews.
- Public–private collaboration will improve collection efficiency and material segregation in emerging markets.
- Energy optimization and water reuse will gain focus to lower operating costs and environmental footprint.
- It will benefit from diversified end uses that balance premium food contact demand with resilient fiber and industrial applications.
Request a Free Sample
Fill in your details and we'll send you a free sample report.
- Sample data tables & charts
- Research methodology
Need a Custom Version of This Report?
Tailor the scope, geography, or segments to your exact requirements.
- Custom geography or segment scope
- Direct access to our analyst team
Frequently Asked Questions
What was the market size of the rPET Flakes Market in 2024 and what is its expected value by 2032?
What factors are driving growth in the rPET Flakes Market?
Which product segment holds the largest share in the rPET Flakes Market?
Which end-user segment contributes most to market demand?
Which region leads the rPET Flakes Market in 2024?
Who are the key players operating in the rPET Flakes Market?
Table of Content
Chapter 1. Report Introduction
- 1.1 Report Description & Purpose
- 1.1.1 Report Title & Market Definition
- 1.1.2 Unique Selling Propositions (USP) & Key Differentiators
- 1.1.3 Value Proposition for Stakeholders
- 1.2 Research Objectives
- 1.2.1 Market Sizing Objectives (Volume & Revenue)
- 1.2.2 Segmentation Objectives
- 1.2.3 Competitive Intelligence Objectives
- 1.2.4 Forecast & Scenario Objectives
- 1.3 Report Scope
- 1.3.1 rPET Flakes Scope – Types & Subtypes Covered
- 1.3.2 Geographic Scope – Regions & Countries Covered
- 1.3.3 Historical Period, Base Year & Forecast Period (2024; forecast to 2032)
- 1.3.4 Inclusions & Exclusions
- 1.4 HS Code & Classification Framework
- 1.5 Currency, Units & Pricing Basis
- 1.6 Target Stakeholders
- 1.7 Limitations & Assumptions
Chapter 2. Executive Summary
- 2.1 Global rPET Flakes Market Snapshot
- 2.1.1 Market Size – Historical (2024) & Forecast (2024-2032) (2024: USD 9,358 million → 2032: USD 17,320.63 million)
- 2.1.2 Volume & Revenue – Global Totals
- 2.1.3 Key Market Highlights – Top Five Facts
- 2.2 rPET Flakes Market Segmentation Snapshot
- 2.2.1 Market Split by Region – 2024 vs. 2032
- 2.3 Competitive Snapshot
- 2.3.1 Top 10 Players by Revenue Share – 2024
- 2.3.2 Top 10 Players by Volume Share – 2024
- 2.3.3 Recent Strategic Developments (18-Month Summary)
- 2.4 Key Investment Highlights & Strategic Conclusions
Chapter 3. rPET Flakes Market Dynamics & Industry Analysis
- 3.1 Market Overview & Context
- 3.1.1 rPET Flakes Market Position in the Broader Automotive Value Chain
- 3.1.2 OEM vs. Replacement Market Dynamics
- 3.1.3 Market Maturity & Development Stage by Region
- 3.2 rPET Flakes Market Drivers
- 3.3 rPET Flakes Market Restraints & Challenges
- 3.4 rPET Flakes Market Opportunities
- 3.5 Porter's Five Forces Analysis
- 3.5.1 Threat of New Entrants
- 3.5.2 Bargaining Power of Suppliers
- 3.5.3 Bargaining Power of Buyers
- 3.5.4 Threat of Substitutes
- 3.5.5 Competitive Rivalry – Intensity Assessment
- 3.6 rPET Flakes Value Chain Analysis
- 3.6.1 Upstream – Raw Material/Input Suppliers
- 3.6.1.1 Raw Material/Input 1
- 3.6.1.2 Raw Material/Input 2
- 3.6.1.3 Raw Material/Input 3
- 3.6.2 Midstream – Production/Manufacturing/Service Delivery
- 3.6.2.1 Production/Process Overview
- 3.6.2.2 Key Facility Locations & Capacity by Manufacturer
- 3.6.3 Downstream – Distribution & End Consumer
- 3.6.3.1 Primary Channel – B2B/OEM
- 3.6.3.2 Secondary Channels – Dealer, Retail, Online, Direct
- 3.6.4 Value Chain Profitability Analysis
- 3.6.1 Upstream – Raw Material/Input Suppliers
- 3.7 PESTEL Analysis
- 3.7.1 Political Factors
- 3.7.2 Economic Factors
- 3.7.3 Social Factors
- 3.7.4 Technological Factors
- 3.7.5 Environmental Factors
- 3.7.6 Legal Factors
- 3.8 rPET Flakes Supply Chain Analysis
- 3.8.1 Raw Material/Input Supply Risk Assessment
- 3.8.2 Manufacturing Concentration Risk (Geographic Exposure)
- 3.8.3 Trade Disruption Impact Analysis
- 3.9 Regulatory & Policy Landscape
Note: The regulatory and policy landscape section covers regulations based on their applicability to the market, rPET Flakes category, geography, and scope of the study. Only regulatory frameworks with a material impact on operations, compliance, trade, sustainability, or market access are analyzed in detail.
Chapter 4. Key Investment Pockets & Opportunity Analysis
- 4.1 rPET Flakes Market Attractiveness Analysis
- 4.1.1 By Region – Investment Attractiveness Matrix (Volume × CAGR)
- 4.2 Absolute Revenue Growth Opportunity
- 4.2.1 By Region – Absolute USD Growth Through 2032
- 4.3 Incremental Volume Opportunity
- 4.3.1 By Region – Incremental Volume Through 2032
- 4.3.2 Segment – Incremental Volume
- 4.4 Emerging Submarket Opportunity Deep Dive (Subject to Applicability)
- 4.5 Emerging Market Opportunity Scorecards
- 4.5.1 United States
- 4.5.2 Europe
- 4.5.3 Asia
- 4.5.4 Middle East & Africa
Note: Emerging Market Opportunity Scorecards will be included based on relevance and strategic importance. Regions listed are indicative and may vary depending on data availability and market dynamics.
Chapter 5. rPET Flakes Import-Export Analysis & Trade Flows
- 5.1 Global Trade Overview
- 5.1.1 Global Export Value by Country (2024)
- 5.1.2 Global Export Volume by Country (2024)
- 5.1.3 Global Import Value by Country (2024)
- 5.1.4 Global Import Volume by Country (2024)
- 5.1.5 Net Trade Balance by Country (2024)
- 5.2 Export Analysis – Segment
- 5.2.1 Type 1 (HS Code)
- 5.2.2 Type 2 (HS Code)
- 5.2.3 Type 3 (HS Code)
- 5.2.4 Type 4 (HS Code)
- 5.2.5 Type 5 (HS Code)
- 5.3 Import Analysis – Segment
- 5.3.1 Type 1 (HS Code)
- 5.3.2 Type 2 (HS Code)
- 5.3.3 Type 3 (HS Code)
- 5.3.4 Type 4 (HS Code)
- 5.3.5 Type 5 (HS Code)
- 5.4 Average Unit Trade Prices
- 5.4.1 Average Export Price – Segment & Country
- 5.4.2 Average Import Price – Segment & Source Country
- 5.4.3 Price Trends (2024)
- 5.5 Key Trade Route Analysis
- 5.5.1 Trade Route 1
- 5.5.2 Trade Route 2
- 5.5.3 Trade Route 3
- 5.5.4 Trade Route 4
- 5.5.5 Trade Route 5
- 5.6 Trade Policy Impact Assessment
- 5.6.1 US Anti-Dumping & Section 301 Tariffs
- 5.6.2 EU Customs Union Impact
- 5.6.3 Major Free Trade Agreements
- 5.6.4 USMCA Rules of Origin
Note: Trade policy analysis will be included only where relevant to the rPET Flakes market.
Chapter 6. Competitive Landscape & Company Benchmarking
- 6.1 rPET Flakes Market Concentration & Structure
- 6.1.1 Herfindahl-Hirschman Index (HHI) – vs. 2024
- 6.1.2 Tier 1, Tier 2 & Tier 3 Market Structure
- 6.1.3 Global, Regional & Local Player Dynamics
- 6.2 rPET Flakes Market Share Analysis – 2024
- 6.2.1 Global Revenue Share by Company
- 6.2.2 Global Volume Share by Company
- 6.2.3 Regional Revenue Share
- 6.2.4 Market Share Evolution ( vs. 2024)
- 6.2.5 OEM Segment Share by Company
- 6.2.6 Replacement Segment Share by Company
- 6.3 Production/Delivery Capacity & Facility Analysis
- 6.3.1 Global Installed Capacity
- 6.3.2 Capacity Utilization Rates
- 6.3.3 Production/Output Volume
- 6.3.4 Facility Locations & Capacity Map
- 6.3.5 Planned Capacity Additions
- 6.4 rPET Flakes Competitive Benchmarking Matrix
- 6.4.1 Revenue, Volume, CAGR & Profitability Comparison
- 6.4.2 Channel Revenue Mix
- 6.4.3 Geographic Revenue Exposure
- 6.4.4 R&D Intensity
- 6.4.5 Sustainability Maturity
- 6.5 Strategic Developments in rPET Flakes (Last 24 Months)
- 6.5.1 Mergers, Acquisitions & Divestments
- 6.5.2 New rPET Flakes Launches
- 6.5.3 Facility Expansions
- 6.5.4 Strategic Alliances, Joint Ventures & Partnerships
- 6.5.5 Distribution Expansion & Market Entry
- 6.5.6 Sustainability & ESG Initiatives
- 6.6 Competitive Strategy Mapping
- 6.6.1 Leader, Challenger, Follower & Niche Classification
- 6.6.2 Pricing Strategy Comparison
- 6.6.3 Channel Strategy Matrix
Note: Strategic developments are included based on their materiality and the availability of reliable information.
Chapter 7. Global rPET Flakes Market – By Distribution Channel
- 7.1 Segment Overview
- 7.1.1 Volume & Revenue Split by Channel (2024 & 2032)
- 7.1.2 Channel Mix Evolution (2024-2032)
Chapter 8. Regional Market Analysis – Global Overview
- 8.1 Global Regional Overview
- 8.1.1 Regional Volume Share
- 8.1.2 Regional Revenue Share
- 8.1.3 Regional Volume by Region
- 8.1.4 Regional Revenue by Region
- 8.1.5 Regional Forecast Through 2032
- 8.2 Cross-Regional Segment Analysis
- 8.2.1 By Distribution Channel
- 8.2.2 By Brand/Price Tier
Chapter 9. North America rPET Flakes Market
- 9.1 United States
- 9.2 Canada
- 9.3 Mexico
Chapter 10. Europe rPET Flakes Market
- 10.1 Germany
- 10.2 France
- 10.3 Italy
- 10.4 United Kingdom
- 10.5 Spain
- 10.6 Poland
- 10.7 Russia
- 10.8 Netherlands
- 10.9 Belgium
- 10.10 Sweden
- 10.11 Denmark
- 10.12 Norway
- 10.13 Rest of Europe
Chapter 11. Asia Pacific rPET Flakes Market
- 11.1 China
- 11.2 India
- 11.3 Japan
- 11.4 South Korea
- 11.5 Thailand
- 11.6 Indonesia
- 11.7 Vietnam
- 11.8 Malaysia
- 11.9 Australia
- 11.10 Rest of Asia Pacific
Chapter 12. Latin America rPET Flakes Market
- 12.1 Brazil
- 12.2 Argentina
- 12.3 Colombia
- 12.4 Chile
- 12.5 Rest of Latin America
Chapter 13. Middle East rPET Flakes Market
- 13.1 Saudi Arabia
- 13.2 United Arab Emirates
- 13.3 Turkey
- 13.4 Israel
- 13.5 Iran
- 13.6 Rest of the Middle East
Chapter 14. Africa rPET Flakes Market
- 14.1 South Africa
- 14.2 Egypt
- 14.3 Nigeria
- 14.4 Morocco
- 14.5 Rest of Africa
Chapter 15. rPET Flakes Company Profiles
- 15.1 [Company 01]
- 15.1.1 Company Overview
- 15.1.2 Key Management Personnel
- 15.1.3 Products & Services Portfolio
- 15.1.4 Financial Performance
- 15.1.5 Key Market Focus & Geographic Presence
- 15.1.6 Recent Developments & Strategic Initiatives
Note: The company profile list is preliminary and may change based on research findings, market developments, data availability, and client requirements.
Chapter 16. Appendices
- Appendix A – List of Abbreviations & Acronyms
- Appendix B – Industry Classification Code Reference – Full Series
- Appendix C – Production & Capacity Data Tables
- Appendix D – End-Use & Demand Base Tables
- Appendix E – Consumption & Replacement Rate Assumptions
- Appendix F – ASP Reference Tables
- Appendix G – Manufacturing & Facility Database
- Appendix H – Import-Export Data Tables
- Appendix I – Regulatory Summary Tables
- Appendix J – Primary Research Participant List (Anonymized)
- Appendix K – Primary Research Questionnaire Framework
- Appendix L – Data Sources & Bibliography
- Appendix M – Market Size Divergence & Source Comparison
Chapter 17. Research Methodology
- 17.1 Research Framework & Philosophy
- 17.2 Secondary Research – Sources, Hierarchy & Data Extraction
- 17.3 Data Modeling – Bottom-Up & Top-Down Market Sizing
- 17.4 Primary Research – Stakeholder Framework, LOI & Sample Sizes
- 17.5 Forecast Methodology – Regression, Scenario & Sensitivity Analysis
- 17.6 Quality Control – Four-Layer Validation Framework
- 17.7 Limitations & Standard Assumptions
- 17.8 Disclaimer
