
Market Overview
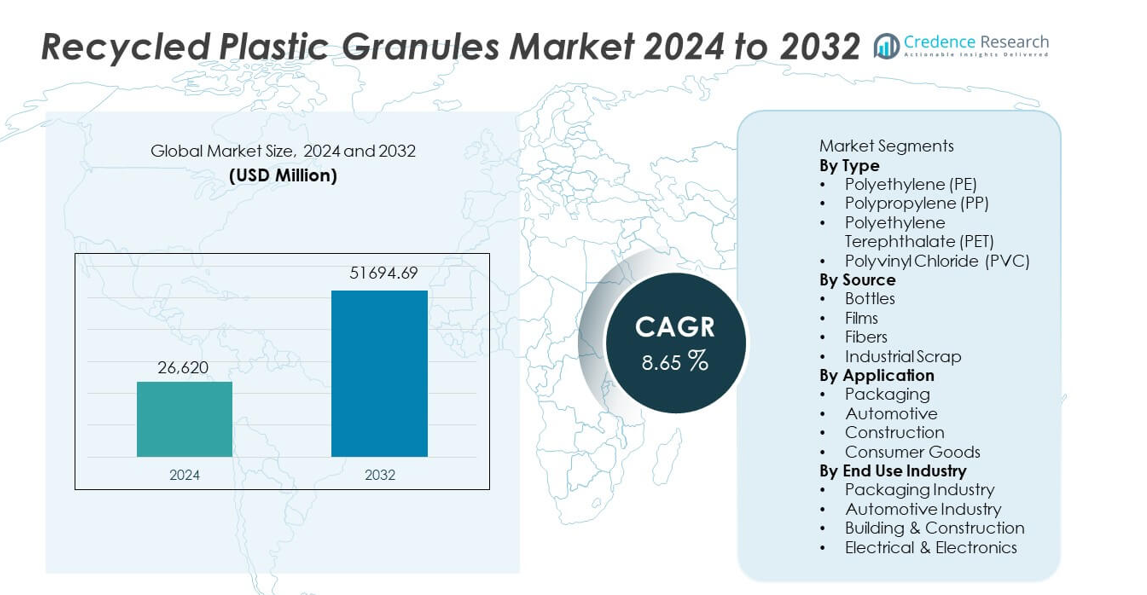
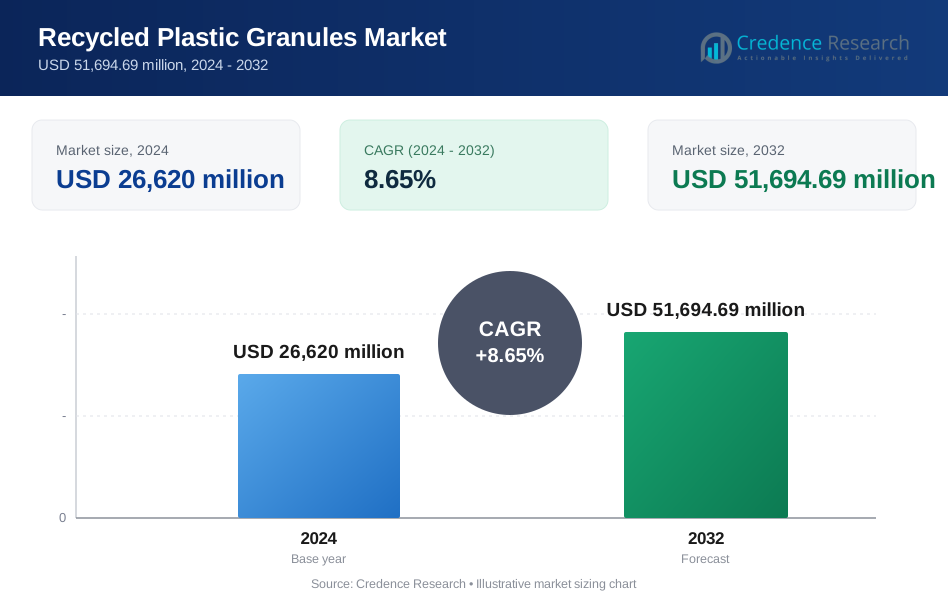
The Recycled Plastic Granules Market was valued at USD 26,620 million in 2024 and is projected to reach USD 51,694.69 million by 2032, growing at a CAGR of 8.65% during the forecast period.
| REPORT ATTRIBUTE | DETAILS |
|---|---|
| Historical Period | 2020-2023 |
| Base Year | 2024 |
| Forecast Period | 2025-2032 |
| Recycled Plastic Granules Market Size 2024 | USD 26,620 million |
| Recycled Plastic Granules Market, CAGR | 8.65% |
| Recycled Plastic Granules Market Size 2032 | USD 51,694.69 million |
Top players in the Recycled Plastic Granules market include Veolia Environnement, SUEZ, Indorama Ventures Public Company Limited, Plastipak Holdings, KW Plastics, Biffa plc, Clean Harbors, Envision Plastics, MBA Polymers, and Republic Services. These companies lead through advanced recycling technologies, large-scale collection networks, and strong partnerships with packaging, automotive, and consumer goods manufacturers. Their focus on high-quality PET, PE, and PP granules supports global sustainability commitments and circular economy goals. Asia Pacific remains the leading region with a 36% market share, driven by expanding recycling capacity and strong manufacturing demand. Europe follows with 32%, supported by strict environmental regulations, while North America holds 28%, driven by rising adoption of recycled content across industries.
Market Insights
- The Recycled Plastic Granules market reached USD 26,620 million in 2024 and will grow at a CAGR of 8.65% through 2032, driven by rising demand for sustainable materials.
- Polyethylene (PE) leads the type segment with a 39% share, supported by strong adoption in packaging films, bags, and containers across major industries.
- Growing focus on circular economy practices, food-grade recycled PET, and advanced recycling technologies shapes major market trends as brands increase recycled content commitments.
- Quality variability in waste feedstock and limited collection infrastructure restrain growth, especially in regions with low recycling rates and fragmented waste management systems.
- Asia Pacific holds a 36% share, followed by Europe at 32% and North America at 28%, supported by strong regulatory support, rising sustainability goals, and expanding recycling capacities.
Market Segmentation Analysis:
By Type
Polyethylene (PE) dominates the type segment with a 39% market share, driven by its broad use in packaging films, bags, and containers. PE granules offer strong flexibility, durability, and recyclability, making them the preferred choice for high-volume applications. Polypropylene (PP) follows due to rising demand in automotive components and household goods. PET shows strong growth supported by high recycling rates from beverage bottles and textile waste. PVC maintains a smaller share as it is used mainly in construction and piping. Growing regulations for sustainable materials continue to increase demand for recycled PE and PET across global industries.
- For instance, Indorama Ventures expanded its PET recycling output through upgrades across its U.S. and Europe facilities. The company operates a facility in Thailand that processes post-consumer PET bottles using advanced flake-to-resin technology.
By Source
Bottles lead the source segment with a 44% share, supported by large-scale collection systems and high recyclability of PET beverage bottles. Strong waste management infrastructure and deposit-return programs boost bottle recovery rates, making them the most reliable feedstock for high-quality recycled granules. Films follow as a growing source due to rising recycling of agricultural films, packaging wraps, and retail bags. Fibers gain traction with increased textile recycling initiatives. Industrial scrap contributes steadily due to consistent availability. Expanding circular economy programs and corporate sustainability targets drive continued growth in bottle-derived granules.
- For instance, Veolia operates multiple plastic recycling facilities worldwide and processes significant amounts of plastic waste each year. Veolia is investing in an innovative facility in the UK which will process mixed plastics from homes and businesses, contributing substantially to the domestic recycling industry's capacity using established technology.
By Application
Packaging dominates the application segment with a 48% market share, driven by strong demand from food, beverage, and consumer goods industries adopting recycled granules for bottles, films, trays, and flexible packaging. Regulations mandating recycled content in packaging materials further accelerate adoption. The automotive sector grows as manufacturers use recycled PP and PE for interior components to reduce costs and improve sustainability. Construction applications expand with rising use of recycled PVC and PE in pipes, sheets, and insulation materials. Consumer goods manufacturers increasingly shift to recycled plastics for durable, cost-effective household products.
Key Growth Drivers
Rising Demand for Sustainable and Circular Materials
Demand for recycled plastic granules grows as industries shift toward environmentally responsible materials. Governments enforce strict recycling targets and promote circular economy practices, pushing manufacturers to increase recycled content in packaging, automotive parts, and consumer goods. Brands adopt recycled plastics to meet ESG commitments and reduce carbon footprints. Rising public awareness of plastic pollution also supports higher adoption. These factors strengthen long-term market expansion across major end-use sectors.
- For instance, SUEZ upgraded its Valorsys sorting system in France to handle 70,000 tons of plastic waste per year using high-speed optical sensors. The plant produces high-purity PE and PP granules that meet industrial-grade specifications.
Expansion of Packaging and Consumer Goods Applications
The packaging industry drives strong growth as companies replace virgin plastics with recycled PE, PP, and PET to meet regulatory and sustainability requirements. Food and beverage brands increase the use of recycled PET in bottles and trays, while flexible packaging manufacturers adopt recycled PE films. Consumer goods producers integrate recycled polymers into household products, toys, and accessories to reduce material costs and improve brand image. This rising application diversity boosts market demand.
- For instance, Plastipak’s Clean Tech UK facility processes a significant volume of PET bottles annually and converts them into food-grade rPET. The company is a major global supplier of plastic containers and preforms and utilizes its patented multi-stage decontamination technology in its operations.
Advancements in Recycling Technology and Processing Efficiency
Innovations in sorting, washing, and pelletizing technologies improve the quality, purity, and consistency of recycled plastic granules. Advanced systems support higher recovery rates from mixed waste streams and enable production of food-grade recycled materials. Chemical recycling expands opportunities by converting difficult-to-recycle plastics into high-quality feedstock. These technological improvements strengthen supply reliability and encourage industries to adopt recycled granules in more demanding applications.
Key Trends & Opportunities
Growing Focus on Food-Grade and High-Purity Recycled Plastics
Food-grade recycled PET and PE gain traction as brands commit to using recycled content in beverage bottles, food trays, and retail packaging. Improved decontamination and purification technologies support production of high-purity granules that meet global safety standards. This trend opens new opportunities for recyclers to supply premium-grade materials. Rising demand from multinational FMCG companies further accelerates market development.
- For instance, Loop Industries is developing an Infinite Loop™ facility designed to depolymerize post-consumer PET waste into virgin-quality monomers. The process produces monomers that meet specifications for food-grade approvals.
Increased Corporate Commitments to Recycled Content Targets
Global brands set ambitious recycled content goals, creating strong demand for recycled granules across packaging, electronics, and automotive sectors. Partnerships between recyclers, manufacturers, and waste management companies expand collection networks and processing capacity. Investments in circular supply chains enhance traceability and improve material availability. These commitments create long-term opportunities for recycled plastic producers to scale operations.
- For instance, Coca-Cola collaborates with Indorama Ventures to support processing capacity across several joint recycling plants in various countries, including a significant facility in the Philippines.
Key Challenges
Quality Variability and Contamination in Recycled Feedstock
Inconsistent feedstock quality remains a major challenge, as mixed waste streams often contain contaminants such as adhesives, dyes, and multilayer packaging. These impurities affect the mechanical properties and appearance of recycled granules, limiting their suitability for high-performance applications. Manufacturers must invest in advanced sorting and purification technologies to meet quality standards. However, high processing costs may restrain adoption in price-sensitive segments.
Limited Collection Infrastructure and Supply Constraints
Many regions lack efficient waste collection and segregation systems, resulting in lower recycling rates and limited availability of high-quality feedstock. Informal recycling networks dominate in several developing markets, leading to supply inconsistencies and quality issues. Rising demand for recycled plastics outpaces available supply, creating cost pressure for manufacturers. Strengthening collection systems and expanding recycling facilities remain essential to address these constraints.
Regional Analysis
North America
North America holds a 28% market share, driven by strong regulatory pressure to increase recycled content in packaging and consumer goods. The region benefits from advanced recycling infrastructure, high awareness of plastic waste reduction, and strong demand from FMCG and automotive industries. Growth accelerates as major brands commit to circular economy initiatives and expand sourcing of high-quality recycled PE, PP, and PET. Technological advancements in sorting and chemical recycling support production of premium-grade granules. Rising investment in bottle-to-bottle recycling and sustainable packaging solutions continues to strengthen market expansion.
Europe
Europe accounts for a 32% market share, supported by strict environmental regulations, high recycling targets, and strong circular economy adoption. The EU mandates recycled content in packaging, driving significant demand for recycled PET and PE granules. Well-established collection systems and advanced processing technologies enhance feedstock availability and material quality. Consumer demand for sustainable products remains strong, encouraging manufacturers to integrate recycled materials across automotive, construction, and household goods. Continuous investment in chemical recycling and closed-loop systems further supports regional growth.
Asia Pacific
Asia Pacific leads the global market with a 36% market share, driven by high plastic consumption, expanding recycling capacity, and strong demand from packaging, textiles, and automotive industries. Countries such as China, India, Indonesia, and Vietnam increase investment in mechanical and chemical recycling infrastructure to manage growing plastic waste volumes. The region’s cost-effective production capabilities and large manufacturing base support high-volume output of recycled granules. Rising sustainability regulations and multinational brand commitments strengthen long-term market growth.
Latin America
Latin America holds a 3% market share, supported by growing recycling awareness and increased use of recycled plastics in packaging and consumer goods. Brazil and Mexico lead regional demand due to expanding FMCG sectors and supportive government initiatives for waste management. Limited collection infrastructure poses challenges, but investments from private recyclers help improve feedstock availability. Demand grows for recycled PET and PE in food packaging, beverage bottles, and household products. Economic development and rising sustainability programs continue to support steady market expansion.
Middle East & Africa
The Middle East & Africa region captures a 1% market share, influenced by gradual development of recycling systems and rising interest in sustainable materials. GCC countries invest in advanced recycling technologies to support national waste reduction goals. Demand increases in packaging, construction, and consumer goods as manufacturers adopt recycled plastics to meet regulatory and corporate sustainability requirements. Africa sees growing participation from informal recycling sectors, improving feedstock collection. Regional investment in recycling infrastructure is expected to strengthen market growth over time.
Market Segmentations:
By Type
- Polyethylene (PE)
- Polypropylene (PP)
- Polyethylene Terephthalate (PET)
- Polyvinyl Chloride (PVC)
By Source
- Bottles
- Films
- Fibers
- Industrial Scrap
By Application
- Packaging
- Automotive
- Construction
- Consumer Goods
By End Use Industry
- Packaging Industry
- Automotive Industry
- Building & Construction
- Electrical & Electronics
By Geography
- North America
- U.S.
- Canada
- Mexico
- Europe
- Germany
- France
- U.K.
- Italy
- Spain
- Rest of Europe
- Asia Pacific
- China
- Japan
- India
- South Korea
- South-east Asia
- Rest of Asia Pacific
- Latin America
- Brazil
- Argentina
- Rest of Latin America
- Middle East & Africa
- GCC Countries
- South Africa
- Rest of the Middle East and Africa
Competitive Landscape
The competitive landscape includes major players such as Veolia Environnement, SUEZ, Indorama Ventures Public Company Limited, Plastipak Holdings, KW Plastics, Biffa plc, Clean Harbors, Envision Plastics, MBA Polymers, and Republic Services. These companies strengthen their market position through large-scale recycling operations, advanced material recovery technologies, and strong partnerships with packaging, automotive, and consumer goods manufacturers. Leading recyclers invest heavily in high-purity PET and PE production, supported by improved sorting, washing, and chemical recycling capabilities. Strategic acquisitions and capacity expansions enhance feedstock availability and supply consistency. Companies also collaborate with brand owners to meet recycled content targets and support circular economy goals. Growing demand for food-grade recycled plastics drives innovation in decontamination and purification processes. Regional recyclers further intensify competition by offering cost-effective granules tailored to local market needs.
Key Player Analysis
- Veolia Environnement
- SUEZ
- Indorama Ventures Public Company Limited
- Plastipak Holdings
- KW Plastics
- Biffa plc
- Clean Harbors
- Envision Plastics
- MBA Polymers
- Republic Services
Recent Developments
- In October 2025, Plastipak Holdings, Inc. was described as focusing on sustainable packaging production using recycled plastics.
- In November 2024, Veolia Environnement promoted its existing global PlastiLoop program in Asia, specifically at the inaugural Plastics Recycling Show Asia (PRSA) in Singapore, to encourage the use of high-quality recycled polymers (including pellets).
Report Coverage
The research report offers an in-depth analysis based on Type, Source, Application, End Use Industry and Geography. It details leading market players, providing an overview of their business, product offerings, investments, revenue streams, and key applications. Additionally, the report includes insights into the competitive environment, SWOT analysis, current market trends, as well as the primary drivers and constraints. Furthermore, it discusses various factors that have driven market expansion in recent years. The report also explores market dynamics, regulatory scenarios, and technological advancements that are shaping the industry. It assesses the impact of external factors and global economic changes on market growth. Lastly, it provides strategic recommendations for new entrants and established companies to navigate the complexities of the market.
Future Outlook
- Demand for recycled plastic granules will rise as industries increase sustainable material adoption.
- Food-grade recycled PET and PE usage will expand due to packaging regulations and brand commitments.
- Chemical recycling will gain momentum, enabling higher-quality output from difficult-to-recycle plastics.
- Investments in advanced sorting and purification technologies will improve granule consistency and performance.
- Circular economy initiatives will strengthen partnerships between recyclers, manufacturers, and waste collectors.
- Automotive and construction sectors will adopt more recycled PP, PE, and PVC to reduce material costs and emissions.
- Global brands will set higher recycled content targets, increasing long-term demand for premium-grade granules.
- Emerging markets will expand recycling infrastructure, improving feedstock availability and processing capacity.
- Digital tracking systems will enhance transparency in recycled material sourcing and certification.
- Competition will intensify as new entrants adopt efficient recycling technologies and target high-growth applications.
Request a Free Sample
Fill in your details and we'll send you a free sample report.
- Sample data tables & charts
- Research methodology
Need a Custom Version of This Report?
Tailor the scope, geography, or segments to your exact requirements.
- Custom geography or segment scope
- Direct access to our analyst team
Frequently Asked Questions
What is the current market size for the Recycled Plastic Granules market, and what is its projected size in 2032?
At what Compound Annual Growth Rate is the Recycled Plastic Granules market projected to grow between 2025 and 2032?
In terms of the plastic types, which market category is in the lead?
Which recycling methods segment is estimated to have the highest CAGR throughout the forecast period?
Who are the leading companies in the Recycled Plastic Granules market?
Table of Content
Chapter 1. Report Introduction
- 1.1 Report Description & Purpose
- 1.1.1 Report Title & Market Definition
- 1.1.2 Unique Selling Propositions (USP) & Key Differentiators
- 1.1.3 Value Proposition for Stakeholders
- 1.2 Research Objectives
- 1.2.1 Market Sizing Objectives (Volume & Revenue)
- 1.2.2 Segmentation Objectives
- 1.2.3 Competitive Intelligence Objectives
- 1.2.4 Forecast & Scenario Objectives
- 1.3 Report Scope
- 1.3.1 Recycled Plastic Granules Scope – Types & Subtypes Covered
- 1.3.2 Geographic Scope – Regions & Countries Covered
- 1.3.3 Historical Period, Base Year & Forecast Period (2024; forecast to 2032)
- 1.3.4 Inclusions & Exclusions
- 1.4 HS Code & Classification Framework
- 1.5 Currency, Units & Pricing Basis
- 1.6 Target Stakeholders
- 1.7 Limitations & Assumptions
Chapter 2. Executive Summary
- 2.1 Global Recycled Plastic Granules Market Snapshot
- 2.1.1 Market Size – Historical (2024) & Forecast (2024-2032) (2024: USD 26,620 million → 2032: USD 51,694.69 million)
- 2.1.2 Volume & Revenue – Global Totals
- 2.1.3 Key Market Highlights – Top Five Facts
- 2.2 Recycled Plastic Granules Market Segmentation Snapshot
- 2.2.1 Market Split by Region – 2024 vs. 2032
- 2.3 Competitive Snapshot
- 2.3.1 Top 10 Players by Revenue Share – 2024
- 2.3.2 Top 10 Players by Volume Share – 2024
- 2.3.3 Recent Strategic Developments (18-Month Summary)
- 2.4 Key Investment Highlights & Strategic Conclusions
Chapter 3. Recycled Plastic Granules Market Dynamics & Industry Analysis
- 3.1 Market Overview & Context
- 3.1.1 Recycled Plastic Granules Market Position in the Broader Automotive Value Chain
- 3.1.2 OEM vs. Replacement Market Dynamics
- 3.1.3 Market Maturity & Development Stage by Region
- 3.2 Recycled Plastic Granules Market Drivers
- 3.3 Recycled Plastic Granules Market Restraints & Challenges
- 3.4 Recycled Plastic Granules Market Opportunities
- 3.5 Porter's Five Forces Analysis
- 3.5.1 Threat of New Entrants
- 3.5.2 Bargaining Power of Suppliers
- 3.5.3 Bargaining Power of Buyers
- 3.5.4 Threat of Substitutes
- 3.5.5 Competitive Rivalry – Intensity Assessment
- 3.6 Recycled Plastic Granules Value Chain Analysis
- 3.6.1 Upstream – Raw Material/Input Suppliers
- 3.6.1.1 Raw Material/Input 1
- 3.6.1.2 Raw Material/Input 2
- 3.6.1.3 Raw Material/Input 3
- 3.6.2 Midstream – Production/Manufacturing/Service Delivery
- 3.6.2.1 Production/Process Overview
- 3.6.2.2 Key Facility Locations & Capacity by Manufacturer
- 3.6.3 Downstream – Distribution & End Consumer
- 3.6.3.1 Primary Channel – B2B/OEM
- 3.6.3.2 Secondary Channels – Dealer, Retail, Online, Direct
- 3.6.4 Value Chain Profitability Analysis
- 3.6.1 Upstream – Raw Material/Input Suppliers
- 3.7 PESTEL Analysis
- 3.7.1 Political Factors
- 3.7.2 Economic Factors
- 3.7.3 Social Factors
- 3.7.4 Technological Factors
- 3.7.5 Environmental Factors
- 3.7.6 Legal Factors
- 3.8 Recycled Plastic Granules Supply Chain Analysis
- 3.8.1 Raw Material/Input Supply Risk Assessment
- 3.8.2 Manufacturing Concentration Risk (Geographic Exposure)
- 3.8.3 Trade Disruption Impact Analysis
- 3.9 Regulatory & Policy Landscape
Note: The regulatory and policy landscape section covers regulations based on their applicability to the market, Recycled Plastic Granules category, geography, and scope of the study. Only regulatory frameworks with a material impact on operations, compliance, trade, sustainability, or market access are analyzed in detail.
Chapter 4. Key Investment Pockets & Opportunity Analysis
- 4.1 Recycled Plastic Granules Market Attractiveness Analysis
- 4.1.1 By Region – Investment Attractiveness Matrix (Volume × CAGR)
- 4.2 Absolute Revenue Growth Opportunity
- 4.2.1 By Region – Absolute USD Growth Through 2032
- 4.3 Incremental Volume Opportunity
- 4.3.1 By Region – Incremental Volume Through 2032
- 4.3.2 Segment – Incremental Volume
- 4.4 Emerging Submarket Opportunity Deep Dive (Subject to Applicability)
- 4.5 Emerging Market Opportunity Scorecards
- 4.5.1 United States
- 4.5.2 Europe
- 4.5.3 Asia
- 4.5.4 Middle East & Africa
Note: Emerging Market Opportunity Scorecards will be included based on relevance and strategic importance. Regions listed are indicative and may vary depending on data availability and market dynamics.
Chapter 5. Recycled Plastic Granules Import-Export Analysis & Trade Flows
- 5.1 Global Trade Overview
- 5.1.1 Global Export Value by Country (2024)
- 5.1.2 Global Export Volume by Country (2024)
- 5.1.3 Global Import Value by Country (2024)
- 5.1.4 Global Import Volume by Country (2024)
- 5.1.5 Net Trade Balance by Country (2024)
- 5.2 Export Analysis – Segment
- 5.2.1 Type 1 (HS Code)
- 5.2.2 Type 2 (HS Code)
- 5.2.3 Type 3 (HS Code)
- 5.2.4 Type 4 (HS Code)
- 5.2.5 Type 5 (HS Code)
- 5.3 Import Analysis – Segment
- 5.3.1 Type 1 (HS Code)
- 5.3.2 Type 2 (HS Code)
- 5.3.3 Type 3 (HS Code)
- 5.3.4 Type 4 (HS Code)
- 5.3.5 Type 5 (HS Code)
- 5.4 Average Unit Trade Prices
- 5.4.1 Average Export Price – Segment & Country
- 5.4.2 Average Import Price – Segment & Source Country
- 5.4.3 Price Trends (2024)
- 5.5 Key Trade Route Analysis
- 5.5.1 Trade Route 1
- 5.5.2 Trade Route 2
- 5.5.3 Trade Route 3
- 5.5.4 Trade Route 4
- 5.5.5 Trade Route 5
- 5.6 Trade Policy Impact Assessment
- 5.6.1 US Anti-Dumping & Section 301 Tariffs
- 5.6.2 EU Customs Union Impact
- 5.6.3 Major Free Trade Agreements
- 5.6.4 USMCA Rules of Origin
Note: Trade policy analysis will be included only where relevant to the Recycled Plastic Granules market.
Chapter 6. Competitive Landscape & Company Benchmarking
- 6.1 Recycled Plastic Granules Market Concentration & Structure
- 6.1.1 Herfindahl-Hirschman Index (HHI) – vs. 2024
- 6.1.2 Tier 1, Tier 2 & Tier 3 Market Structure
- 6.1.3 Global, Regional & Local Player Dynamics
- 6.2 Recycled Plastic Granules Market Share Analysis – 2024
- 6.2.1 Global Revenue Share by Company
- 6.2.2 Global Volume Share by Company
- 6.2.3 Regional Revenue Share
- 6.2.4 Market Share Evolution ( vs. 2024)
- 6.2.5 OEM Segment Share by Company
- 6.2.6 Replacement Segment Share by Company
- 6.3 Production/Delivery Capacity & Facility Analysis
- 6.3.1 Global Installed Capacity
- 6.3.2 Capacity Utilization Rates
- 6.3.3 Production/Output Volume
- 6.3.4 Facility Locations & Capacity Map
- 6.3.5 Planned Capacity Additions
- 6.4 Recycled Plastic Granules Competitive Benchmarking Matrix
- 6.4.1 Revenue, Volume, CAGR & Profitability Comparison
- 6.4.2 Channel Revenue Mix
- 6.4.3 Geographic Revenue Exposure
- 6.4.4 R&D Intensity
- 6.4.5 Sustainability Maturity
- 6.5 Strategic Developments in Recycled Plastic Granules (Last 24 Months)
- 6.5.1 Mergers, Acquisitions & Divestments
- 6.5.2 New Recycled Plastic Granules Launches
- 6.5.3 Facility Expansions
- 6.5.4 Strategic Alliances, Joint Ventures & Partnerships
- 6.5.5 Distribution Expansion & Market Entry
- 6.5.6 Sustainability & ESG Initiatives
- 6.6 Competitive Strategy Mapping
- 6.6.1 Leader, Challenger, Follower & Niche Classification
- 6.6.2 Pricing Strategy Comparison
- 6.6.3 Channel Strategy Matrix
Note: Strategic developments are included based on their materiality and the availability of reliable information.
Chapter 7. Global Recycled Plastic Granules Market – By Distribution Channel
- 7.1 Segment Overview
- 7.1.1 Volume & Revenue Split by Channel (2024 & 2032)
- 7.1.2 Channel Mix Evolution (2024-2032)
Chapter 8. Regional Market Analysis – Global Overview
- 8.1 Global Regional Overview
- 8.1.1 Regional Volume Share
- 8.1.2 Regional Revenue Share
- 8.1.3 Regional Volume by Region
- 8.1.4 Regional Revenue by Region
- 8.1.5 Regional Forecast Through 2032
- 8.2 Cross-Regional Segment Analysis
- 8.2.1 By Distribution Channel
- 8.2.2 By Brand/Price Tier
Chapter 9. North America Recycled Plastic Granules Market
- 9.1 United States
- 9.2 Canada
- 9.3 Mexico
Chapter 10. Europe Recycled Plastic Granules Market
- 10.1 Germany
- 10.2 France
- 10.3 Italy
- 10.4 United Kingdom
- 10.5 Spain
- 10.6 Poland
- 10.7 Russia
- 10.8 Netherlands
- 10.9 Belgium
- 10.10 Sweden
- 10.11 Denmark
- 10.12 Norway
- 10.13 Rest of Europe
Chapter 11. Asia Pacific Recycled Plastic Granules Market
- 11.1 China
- 11.2 India
- 11.3 Japan
- 11.4 South Korea
- 11.5 Thailand
- 11.6 Indonesia
- 11.7 Vietnam
- 11.8 Malaysia
- 11.9 Australia
- 11.10 Rest of Asia Pacific
Chapter 12. Latin America Recycled Plastic Granules Market
- 12.1 Brazil
- 12.2 Argentina
- 12.3 Colombia
- 12.4 Chile
- 12.5 Rest of Latin America
Chapter 13. Middle East Recycled Plastic Granules Market
- 13.1 Saudi Arabia
- 13.2 United Arab Emirates
- 13.3 Turkey
- 13.4 Israel
- 13.5 Iran
- 13.6 Rest of the Middle East
Chapter 14. Africa Recycled Plastic Granules Market
- 14.1 South Africa
- 14.2 Egypt
- 14.3 Nigeria
- 14.4 Morocco
- 14.5 Rest of Africa
Chapter 15. Recycled Plastic Granules Company Profiles
- 15.1 [Company 01]
- 15.1.1 Company Overview
- 15.1.2 Key Management Personnel
- 15.1.3 Products & Services Portfolio
- 15.1.4 Financial Performance
- 15.1.5 Key Market Focus & Geographic Presence
- 15.1.6 Recent Developments & Strategic Initiatives
Note: The company profile list is preliminary and may change based on research findings, market developments, data availability, and client requirements.
Chapter 16. Appendices
- Appendix A – List of Abbreviations & Acronyms
- Appendix B – Industry Classification Code Reference – Full Series
- Appendix C – Production & Capacity Data Tables
- Appendix D – End-Use & Demand Base Tables
- Appendix E – Consumption & Replacement Rate Assumptions
- Appendix F – ASP Reference Tables
- Appendix G – Manufacturing & Facility Database
- Appendix H – Import-Export Data Tables
- Appendix I – Regulatory Summary Tables
- Appendix J – Primary Research Participant List (Anonymized)
- Appendix K – Primary Research Questionnaire Framework
- Appendix L – Data Sources & Bibliography
- Appendix M – Market Size Divergence & Source Comparison
Chapter 17. Research Methodology
- 17.1 Research Framework & Philosophy
- 17.2 Secondary Research – Sources, Hierarchy & Data Extraction
- 17.3 Data Modeling – Bottom-Up & Top-Down Market Sizing
- 17.4 Primary Research – Stakeholder Framework, LOI & Sample Sizes
- 17.5 Forecast Methodology – Regression, Scenario & Sensitivity Analysis
- 17.6 Quality Control – Four-Layer Validation Framework
- 17.7 Limitations & Standard Assumptions
- 17.8 Disclaimer
