Styrene Acrylonitrile Market Overview:
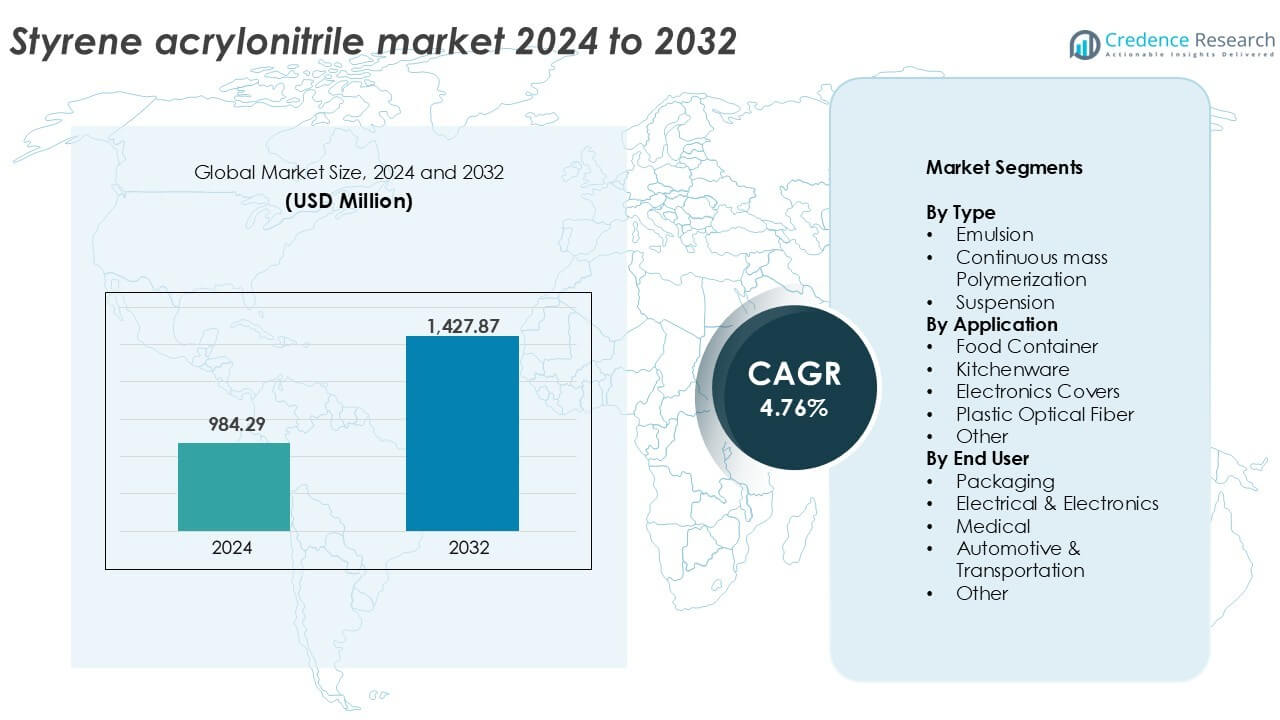
The Styrene Acrylonitrile market size was valued at USD 984.29 million in 2024 and is anticipated to reach USD 1,427.87 million by 2032, at a CAGR of 4.76% during the forecast period.
| REPORT ATTRIBUTE |
DETAILS |
| Historical Period |
2020-2023 |
| Base Year |
2024 |
| Forecast Period |
2025-2032 |
| Styrene Acrylonitrile Market Size 2024 |
USD 984.29 million |
| Styrene Acrylonitrile Market, CAGR |
4.76% |
| Styrene Acrylonitrile Market Size 2032 |
USD 1,427.87 million |
Styrene Acrylonitrile Market Insights
- Rising demand from electronics and appliances industries drives market growth, supported by SAN’s thermal resistance, clarity, and strength.
- Growing preference for BPA-free materials and high-performance plastic blends boosts product usage in food containers, kitchenware, and medical devices.
- Key players such as BASF SE, SABIC, INEOS Styrolution, and LG Chem dominate through global production networks, while Chinese manufacturers gain ground with cost-efficient supply.
- Asia Pacific leads with 38% market share, followed by North America at 28% and Europe at 23%; electronics covers hold the largest segment share among applications due to high demand for durable, precision-molded plastic components.
Styrene Acrylonitrile Market Segmentation Analysis:
By Type
The continuous mass polymerization segment holds the dominant share in the styrene acrylonitrile market, accounting for over 45% in 2024. This method ensures better product clarity and thermal resistance, making it ideal for high-performance applications. Its cost efficiency, lower residual monomer levels, and ability to produce uniform polymers drive preference across large-scale production lines. Emulsion polymerization, while versatile, is more common in lower-grade applications due to lower clarity. Suspension polymerization sees limited adoption due to challenges in controlling particle size and heat management. Overall, the shift toward high-clarity SAN products sustains demand for the continuous mass method.
- For instance, INEOS Styrolution operates continuous mass polymerization lines for SAN with production capacities exceeding 400,000 metric tons per year across Europe and Asia.
Access crucial information at unmatched prices!
Request your sample report today & start making informed decisions powered by Credence Research Inc.!
Download Sample
By Application
Electronics covers dominate the application segment with more than 38% market share in 2024. SAN’s excellent dimensional stability, chemical resistance, and high-gloss finish make it ideal for protecting electronics components. The segment benefits from rising consumer electronics demand and miniaturization trends. Food containers and kitchenware follow, supported by SAN’s safety and dishwasher compatibility. Plastic optical fibers see niche demand, especially in short-distance data transmission applications. The others category includes cosmetic packaging and transparent housings. However, the electronics sector continues to drive steady growth due to the material’s balance of aesthetics, heat resistance, and strength.
- For instance, LG Chem supplies SAN grades used in television and appliance housings with heat distortion temperatures above 95 °C under standard testing.
By End User
Electrical and electronics end use leads with a 40%+ share in the styrene acrylonitrile market in 2024. The demand stems from SAN’s insulating properties, flame resistance, and moldability, which suit housings and structural parts. The packaging sector follows, boosted by clear rigid packaging for food and consumer goods. Medical applications gain traction due to SAN’s biocompatibility and sterilization stability, especially for diagnostic devices. Automotive and transportation use the polymer for interior trims and control knobs, though growth remains moderate. Overall, electronics and packaging sectors remain key growth drivers due to reliability, visual appeal, and regulatory compliance.
Key Growth Drivers
Expanding Demand in Consumer Electronics and Appliance Manufacturing
The styrene acrylonitrile market gains strong momentum from its expanding role in electronics and appliance manufacturing. SAN offers excellent electrical insulation, dimensional stability, and surface gloss, making it ideal for device casings, switches, control panels, and internal components. As consumer electronics and home appliances see wider global penetration, manufacturers turn to SAN for cost-effective and aesthetically pleasing solutions. The growing use of lightweight plastics in appliances like air conditioners, mixers, blenders, and washing machines enhances its value. Rapid industrialization and rising disposable incomes in emerging economies are pushing appliance production upward. SAN’s compatibility with precision molding also aligns with current trends toward sleek, compact designs. Key OEMs increasingly rely on SAN for both functionality and appearance.
- For instance, LG Chem supplies SAN grades used in appliance housings with heat distortion temperatures above 95 °C under ISO 75 testing.
Increased Application in Transparent and Durable Packaging Solutions
Styrene acrylonitrile serves growing needs in packaging, especially where clarity, strength, and chemical resistance are critical. SAN is widely used in rigid food containers, cosmetic jars, and household product packaging, thanks to its glass-like transparency and durability. Unlike traditional polystyrene, SAN resists fats, oils, and alcohols, making it suitable for reusable packaging formats. Global trends toward sustainability and consumer preference for clear packaging drive further interest. SAN also maintains its form under refrigeration and sterilization, supporting both food-grade and medical packaging. The rising e-commerce and retail sector promotes demand for robust, attractive, and hygienic packaging, where SAN performs reliably. Growth in refillable and long-use packaging models further supports market expansion. Leading FMCG brands increasingly explore SAN-based solutions to enhance visual appeal and extend product shelf life.
- For instance, SABIC manufactures SAN resins certified for repeated food contact under EU Regulation No. 10/2011.
Growing Automotive and Transportation Integration for Interior Components
The automotive industry adopts SAN for interior applications due to its thermal resistance, colorability, and surface finish. It is increasingly used in control panels, air vents, gear knobs, and decorative trims, replacing heavier or costlier materials. SAN’s dimensional stability and ease of molding allow for consistent part production and detailed surface textures. As automakers prioritize weight reduction and material efficiency, SAN emerges as a viable substitute for less efficient plastics or metals. The rise of electric vehicles (EVs) has further increased interest in flame-retardant and low-emission plastics. With growing vehicle production across Asia and Latin America, tier-1 and tier-2 suppliers are integrating SAN into multi-component assemblies. Its recyclability and cost competitiveness support sustainability goals in transportation design.
Key Trends & Opportunities
Surging Preference for BPA-Free and Food-Contact-Safe Materials
Health concerns and regulatory shifts drive manufacturers to adopt safer alternatives to traditional plastic compounds. SAN, being inherently free of bisphenol-A (BPA), is increasingly preferred for applications involving direct food and beverage contact. Consumers now demand products that meet high safety and hygiene standards, especially in reusable containers, baby bottles, and kitchen appliances. SAN’s compliance with FDA and EU food safety regulations positions it as a viable replacement for PC and other controversial materials. Companies that offer certified BPA-free SAN solutions are seeing competitive advantages, particularly in North America and Europe. This shift opens up new avenues in premium food storage, tableware, and health-conscious household product segments. Emerging markets also witness similar transitions as awareness of product safety rises.
- For instance, Chi Mei Corporation supplies SAN grades certified for repeated food contact, including dishwasher and hot-fill conditions up to 100 °C.
Innovation in Lightweight, High-Performance Plastic Blends and Alloys
Blending SAN with other polymers such as ABS and PMMA expands its range of industrial uses. These alloys enhance impact resistance, thermal stability, and aesthetic appeal. Markets like consumer electronics, healthcare, and automotive seek multifunctional materials that balance strength with appearance. New SAN-based blends also improve processability in injection molding, helping manufacturers reduce cycle times and improve production efficiency. The growing miniaturization trend in electronics further supports SAN use due to its dimensional precision and low warpage. Specialty SAN composites now target lighting equipment, instrumentation housings, and diagnostic tools. The demand for durable, scratch-resistant, and visually appealing plastic parts creates a promising innovation pipeline. Strategic collaborations between resin producers and end-user industries accelerate product development.
Key Challenges
Volatile Raw Material Prices and Feedstock Availability
The styrene acrylonitrile market faces pressure from fluctuating prices of its key raw materials—styrene and acrylonitrile. These chemicals are petroleum-derived and highly sensitive to global crude oil prices, supply disruptions, and geopolitical tensions. Any instability in feedstock supply chains impacts resin production costs and margins for manufacturers. SAN producers also face competition for acrylonitrile from other high-demand applications like ABS and nitrile rubber. Trade restrictions and import-export barriers further constrain availability, especially in regions reliant on imports. Inconsistent pricing deters long-term planning for end users, affecting SAN adoption in price-sensitive segments like packaging. To counteract this, manufacturers must invest in backward integration, diversify sourcing, or explore bio-based alternatives.
Recyclability Concerns and Growing Sustainability Pressures
Despite its mechanical benefits, SAN poses challenges related to recycling and environmental compliance. The material’s complex chemical structure makes mechanical recycling less efficient than that of more common plastics like PET or HDPE. Lack of dedicated recycling infrastructure and limited collection mechanisms further reduce circularity. Environmental regulations in Europe and North America increasingly restrict the use of hard-to-recycle plastics, putting pressure on SAN producers. Brands and packaging companies are prioritizing polymers that align with circular economy goals and offer higher recycling rates. SAN’s relatively low biodegradability and combustion byproducts also invite scrutiny from green advocates and regulatory bodies.
Regional Analysis
North America
North America accounted for over 28% of the global styrene acrylonitrile market share in 2024, driven by robust demand from the electrical and electronics, healthcare, and food packaging sectors. The United States leads regional consumption due to its advanced manufacturing infrastructure and high per-capita use of consumer appliances. Regulatory focus on BPA-free and FDA-compliant materials further boosts SAN adoption in kitchenware and medical applications. Key players maintain strong production capacities, ensuring stable supply. Technological innovation in SAN compounding and blending supports high-end electronics applications. The region’s mature recycling ecosystem also influences sustainable SAN packaging developments.
Europe
Europe held around 23% market share in 2024, supported by strong automotive, consumer goods, and packaging industries. Germany, France, and Italy are major contributors, with well-established polymer processing industries and a shift toward recyclable, durable plastics. The EU’s regulatory push for safer, BPA-free materials boosts SAN’s relevance in food-grade and healthcare applications. European automakers increasingly integrate SAN into dashboards, trims, and control panels to reduce weight and enhance interior aesthetics. Rising demand for clear, impact-resistant containers further propels the packaging segment. Technological advancements and circular economy policies continue shaping SAN market opportunities in the region.
Asia Pacific
Asia Pacific dominates the global styrene acrylonitrile market with over 38% share in 2024, fueled by large-scale electronics and appliance manufacturing hubs in China, Japan, South Korea, and India. Rapid urbanization, rising disposable incomes, and growing automotive production increase demand across SAN applications. China leads in both production and consumption, supported by cost-effective manufacturing and strong domestic demand. The region also benefits from favorable trade policies and expanding plastic processing industries. High population density drives demand for durable and hygienic consumer goods. Regional players invest in capacity expansion and product innovation to cater to fast-evolving end-use markets.
Latin America
Latin America captured approximately 6% of the global styrene acrylonitrile market share in 2024. Brazil and Mexico lead regional consumption, driven by moderate growth in automotive components, consumer appliances, and rigid packaging. Rising urbanization and middle-class expansion support broader plastic adoption in daily-use products. However, market growth faces challenges from limited local SAN production and reliance on imports. Regulatory focus on safer materials and efforts to expand recycling infrastructure are gaining traction. The region holds potential for growth through strategic partnerships and localized manufacturing. Demand is expected to rise gradually with increased industrialization and modernization in key countries.
Middle East & Africa
The Middle East & Africa accounted for nearly 5% of the global styrene acrylonitrile market share in 2024. Market expansion is driven by increasing infrastructure development, demand for consumer electronics, and growth in food-grade packaging. GCC countries, especially the UAE and Saudi Arabia, lead SAN adoption due to high consumption of consumer goods and medical plastics. Limited regional manufacturing capacity leads to heavy dependence on imports from Asia and Europe. Government efforts to diversify industrial bases and invest in downstream petrochemical products are expected to support future SAN demand. Healthcare modernization further expands opportunities across the region.
Styrene Acrylonitrile Market Segmentations:
By Type
- Emulsion
- Continuous mass Polymerization
- Suspension
By Application
- Food Container
- Kitchenware
- Electronics Covers
- Plastic Optical Fiber
- Other
By End User
- Packaging
- Electrical & Electronics
- Medical
- Automotive & Transportation
- Other
By Geography
- North America
- Europe
- Germany
- France
- U.K.
- Italy
- Spain
- Rest of Europe
- Asia Pacific
- China
- Japan
- India
- South Korea
- South-east Asia
- Rest of Asia Pacific
- Latin America
- Brazil
- Argentina
- Rest of Latin America
- Middle East & Africa
- GCC Countries
- South Africa
- Rest of the Middle East and Africa
Competitive Landscape
The styrene acrylonitrile market features a moderately consolidated landscape, with global and regional players competing across product quality, application focus, and pricing strategies. Leading companies such as BASF SE, SABIC, LG Chem, INEOS Styrolution, and Chi Mei Corporation account for a significant market share through extensive product portfolios and strong global distribution networks. These firms focus on high-performance SAN grades tailored for electronics, automotive, and packaging end users. Companies like Trinseo, Asahi Kasei, and JSR Corporation are expanding regional footprints by investing in R&D and capacity upgrades. Joint ventures, feedstock integration, and technology partnerships remain key strategies to enhance competitiveness and reduce dependency on volatile raw material prices. Additionally, firms such as Chevron Phillips Chemical and Versalis S.p.A. target niche opportunities in sustainable and recyclable SAN solutions. Emerging players from Asia, particularly China, are gaining ground by offering cost-competitive alternatives. Overall, innovation, sustainability, and regional expansion define the current competitive dynamics.
Shape Your Report to Specific Countries or Regions & Enjoy 30% Off!
Key Player Analysis
- BASF SE
- SABIC
- LG Chem
- INEOS Styrolution
- Trinseo
- Chi Mei Corporation
- Asahi Kasei Corporation
- Versalis S.p.A.
- JSR Corporation
- Ravago Group
- Chevron Phillips Chemical Company LLC
- INEOS Group
- Styron LLC
- ENI
- CNPC (China National Petroleum Corporation)
Recent Developments
- In Sept 2025, Supreme Petrochem Ltd commissioned its first ABS (acrylonitrile-butadiene-styrene) production line at its Amdoshi plant in Nagothane, Maharashtra, with 70,000 tpa capacity.
- In April 2024, Trinseo introduced new flame-retardant polycarbonate (PC) and PC/acrylonitrile-butadiene-styrene (ABS) materials at Chinaplas 2024 in Shanghai. These materials were manufactured without using per- and polyfluoroalkyl substances (PFAS) or halogenated additives and offered options with recycled content.
- In Jan 2024, S&P Global Commodity Insights’s Platts announced it will launch daily recycled-ABS (R-ABS) spot assessments for Northwest Europe starting 1 March 2024.
Report Coverage
The research report offers an in-depth analysis based on Type, Application, End-User and Geography. It details leading market players, providing an overview of their business, product offerings, investments, revenue streams, and key applications. Additionally, the report includes insights into the competitive environment, SWOT analysis, current market trends, as well as the primary drivers and constraints. Furthermore, it discusses various factors that have driven market expansion in recent years. The report also explores market dynamics, regulatory scenarios, and technological advancements that are shaping the industry. It assesses the impact of external factors and global economic changes on market growth. Lastly, it provides strategic recommendations for new entrants and established companies to navigate the complexities of the market.
Future Outlook
- The market will see steady demand growth from electronics and consumer appliance manufacturing.
- Packaging applications will expand with increased use of clear, durable, and food-safe containers.
- SAN usage in automotive interiors will rise due to lightweight and aesthetic component needs.
- Innovation in SAN blends will support adoption in medical devices and diagnostic equipment.
- Regulatory push for BPA-free materials will boost SAN’s presence in kitchenware and food storage.
- Asia Pacific will remain the largest regional market due to industrial output and domestic consumption.
- Companies will invest in recyclability and sustainable SAN grades to meet circular economy goals.
- Demand for transparent polymers in optical fibers and lighting applications will create niche growth.
- Global players will strengthen capacity and distribution through regional partnerships and expansions.
- Volatility in raw material prices may influence pricing strategies and sourcing decisions.


