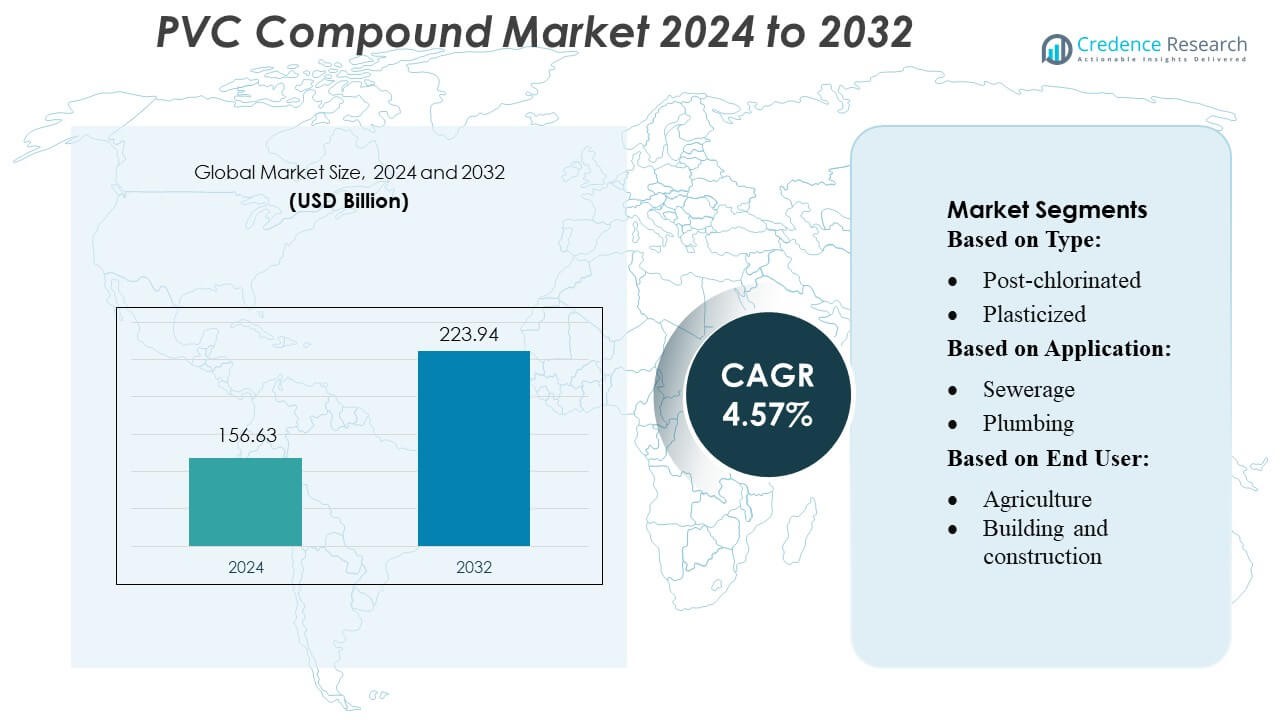
Home » Chemicals » PVC Compound Market

PVC Compound Market By Product Types (Rigid PVC, Flexible PVC) By Manufacturing Process (Injection Molding, Extrusion,Others) By Application (Film and Sheet, Wire and Cabling, Pipe and Fitting, Flooring, Profiles and Tubes, Others) By End-Use Industry (Electrical and Electronics, Building and Construction, Packaging, Automotive, Others) – Growth, Future Prospects, And Competitive Analysis, 2016 -2028

Price: $4999

Published: | Report ID: 8464 | Report Format : PDF

About this report

The global PVC compound market report explores the critical analysis of the PVC compound industry using key parameters. The report consists of investment strategies, the need for investments in the PVC compound industry, and the multiple benefits for the investors. Importantly, this report sets out major changes in the global technical regulations for the PVC compound industry and how economic and non-economic barriers are assisting in growing the market. Moreover, the report analyzes the global, regional, and country-level historic and forecasted market size. The report also provides a comprehensive analysis of key investment propositions, demand and supply gap, competitors positioning, STAR analysis, SRC analysis, and Tornado analysis.Key technological developments and other analyses such as porter’s five forces analysis, PESTEL analysis, value chain analysis, etc.

Chemicals

Key Highlights of the report

How are the major segments performing in the PVC compound market?

  • In 2021, the injection molding segment was expected to dominate the global PVC compound market as many products are manufactured using injection molding, which differs greatly in size, complexity and application.
  • In 2021, the film and sheet segment was expected to dominate the market as PVC films and sheets can be customized and save costs, increasing consumer appeal.
  • In 2021, the electrical and electronics segment was expected to dominate the global PVC compound market as it is widely used to increase its electrical conductivity.
  • In 2021, the flexible PVCsegment was anticipated to hold a prominent share in the global PVC compound market as it has great strength and softness.
Design Element 2

Access crucial information at unmatched prices!

Request your free sample report today & start making informed decisions powered by Credence Research!

Download Free Sample
CTA Design Element 3

Which region dominated the PVC compound market?

In 2021, the Asia-Pacific dominated the market owing to the recycling capabilities of plasticized PVC medical instruments and increasing building and construction activities in evolving countries. Due to the recovery initiative in plasticized PVC compounds in the region and the PVC compound, manufacturers are engaged in developing new PVC compound products, propelling the region’s demand for PVC compounds.

What is the competitive environment of the PVC compound market?

Companies in the market contend established on the product grade delivered. Major players in this market emphasize developing their manufacturing skills, R&D investments, infrastructural expansion, and leveraging integration possibilities around the value chain. With these techniques, global PVC Compound companies cater to growing demand, secure competitive effectiveness, create innovative products & technologies, decrease production expenses, and enhance their customer base. For instance, in January 2022, Westlake established GreenVin Polyvinyl Chloride (PVC), a lower-carbon alternative PVC. It is established by one of its subsidiaries, the Vinnolit subsidiary in Germany. It is primarily utilized in the construction, automotive and medical sectors. This will oblige the company to extend its product portfolio. Furthermore, In July 2020, KEM ONE partnered with Polyloop to develop PVC recycling. This partnership will combine their skills and expertise to develop new PVC recycling solutions at the Balan site.

Executive Summary

What was the impact of the COVID-19 pandemic on the PVC compound market?

COVID-19 impacted several manufacturing industries in the year 2020-2021 as it led to the closure of workplaces, disturbance of supply chains, and regulations on transportation. However, no significant impact was detected on PVC compound global operations and supply chain, as the import and export of vaccines and essential goods led to the growing demand for PVC compound. This increasing awareness and governmental push for the research, development, and introduction of new PVC compounds boost the global market growth.

Which are the key investments by the players in the PVC compound industry market?

These players are immersed in platform expansion and strategic collaborations to extend their portfolios and acquire a robust footing in the global PVC compound market. For instance, in April 2019, Mitsubishi Chemical Corporation (MCC) completed its acquisition of the PVC compound business of WelsetPlast Extrusions Private Limited in India. Plans now call for a new facility to manufacture thermoplastic elastomer for automotive interior components and other applications at MCPP India Private Limited subsidiary. Furthermore, In February 2020, INEOS and UPM Biofuels declared a long-term agreement to provide a renewable raw material for unique and creative bio-attributed polymers produced at INEOS Köln, Germany. The world’s first commercially obtainable bio-attributed PVC utilizes the residue from wood pulp manufacturing.

Some major players in the PVC compound market are Aurora Plastics, Benvic Europe, Ercros, Formosa Plastics Corporation, INEOS Compounds, Mexichem, PKN Orlen S. A., Roscom, Inc., Teknor Apex, and Westlake.

What are the Major Driving Factors for the PVC compound Market?

The growing utilization of PVC compounds across the various end-user industries is estimated to carve a way for market growth. The demand for food packaging in creating nations will probably drive the growth of the PVC compound market during the forecast period. In addition, the expanded usage of PVC compounds in residential and commercial structures is anticipated to expand the market’s growth. Furthermore, the increase in business development will further drive the growth rate of the PVC compound market. Additionally, the growing disposable income in the advancing countries will drive market value growth. The expansion of the end-use is also projected to bolster the market’s growth. Furthermore, as PVC blood bags are understood for their comprehensive shelf life and durability, the growing number of crisis division visits and the resulting expansion in blood donation requirements are anticipated to impact material adoption.

What are the Major Risks for the PVC compound Market?

With the growing number of restrictions around the globe due to the pandemic, there has been a hit in demand and supply. This factor will challenge the market growth of the PVC compound. Furthermore, Changes or volatility in the costs of raw materials and machinery equipment pose a significant threat to the market’s growth. Further, inconsistent availability of raw materials at one distinct location is demeaning the market’s growth. The availability of alternatives at an affordable range will further derail the market growth rate.

Which is the key application in the PVC compound market?

The building and constructionsegment is anticipated to hold a prominent share in the global PVC compound market. PVC compound is a cost-effective compounding product with water resistance, freeing the walls from corrosion with changing environmental conditions. It is used in windows, roofing, fencing, wallcoverings, and flooring. Plasticized PVC compound is used in building walls to withstand tough weather conditions; PVC protects outer walls by resisting heat. The plasticized PVC compound acts as a trusted and relevant material in cables and electrical wirings. And with that, plasticized PVC compound doesn’t lead to fire due to short circuits or any other kind of problem and protects the wires from corrosion, which happens due to time.

How is the PVC compoundmarket performing in regions?

The Asia Pacific region is anticipated to hold a prominent share in the global PVC compound market due to the manufacture of plastic products. Owing to features corresponding to quick industrial development, increasing manufacturing segments, and high funds for organizational growth, India and China are observing a prominent growth for Polyvinyl chloride. Moreover, the Government of India is implementing various measures to encourage the country’s domestic electronics manufacturing industry and exports. For instance, India’s electronic goods exports were esteemed at USD 11.7 billion in 2021. In May 2021, exports of electronic goods were valued at USD 950.17 million. This development in electronic products in the country will probably drive the demand for PVC in the electronic industry over the forecast period.

North America will score the highest growth rate owing to the major players’ increased focus on this region. Moreover, the prevalence of advanced infrastructure in the region will further create lucrative growth opportunities. Furthermore, the US has one of the world’s largest construction industries. In 2021, as per the US Census Bureau, the total value of residential housing during FY was USD 217,30 million, up by 21.8%, corresponding to USD 178,362 million for FY 2019-2020.

What is the regulatory landscape for the PVC compound market?

The improper disposal of legacy plastic waste and the recycling and reuse of such can guide the constant circulation of toxic additives into the environment, endangering plant and animal life and human health. The environmental hazards posed by dangerous additives have been managed by international regulations like the Registration, Evaluation, and Authorization of Chemicals (REACH) ordinance and the Stockholm Convention. They set entries for dangerous chemicals, including some legacy additives, which control trading and waste management, and desire a fast phase-out of dangerous combinations. At the same time, non-governmental, governmental, and industrial players reinforce a circular economy of goods, including plastics, which will further improve recycling allocations for waste plastics.

What is the Market Size of PVC compound regarding value?

The global PVC compound market is anticipated to grow at a substantial CAGR of 5.00% in the upcoming years. The global PVC compound industry was estimated to be worth USD 11.2 billion in 2021 and was expected to be worth USD 15.01 billion by 2028.

Shape Your Report to Specific Countries or Regions & Enjoy 30% Off!

What are the major players planning for the future of the PVC compound market?

Growing regional existence and investment in downstream applications are anticipated to deliver a competitive edge in the market. For instance, in January 2021, Shintech declared a capital investment of USD 1.25 billion to support its integrated PVC business, Shin-Etsu Chemical Co. Ltd, which will also increase the production capacity of Shintech Inc., its US subsidiary. Shintech’s PVC production capacity is anticipated to reach 3.62 million metric tons annually.

Segmentation of Global PVC Compound Market-

Global PVC Compound Market – By Product Types

  • Rigid PVC
  • Flexible PVC

Global PVC Compound Market – By Manufacturing Process

  • Injection Molding
  • Extrusion
  • Others

Global PVC Compound Market – By Application

  • Film and Sheet
  • Wire and Cabling
  • Pipe and Fitting
  • Flooring
  • Profiles and Tubes
  • Others

Global PVC Compound Market – By End-Use Industry

  • Electrical and Electronics
  • Building and Construction
  • Packaging
  • Automotive
  • Others

Global PVC Compound Market – By Region

  • North America
    • US.
    • Canada
  • Europe
    • Germany
    • France
    • U.K.
    • Italy
    • Spain
    • Rest of Europe
  • Asia Pacific
    • China
    • Japan
    • India
    • South Korea
    • South-east Asia
    • Rest of Asia Pacific
  • Latin America
    • Brazil
    • Mexico
    • Rest of Latin America
  • Middle East & Africa
    • GCC Countries
    • South Africa
    • Rest of Middle East and Africa

1. Preface
1.1. Report Description
1.1.1. Purpose of the Report
1.1.2. Target Audience
1.1.3. USP and Key Offerings
1.2. Research Scope
1.3. Research Methodology
1.3.1. Phase I – Secondary Research
1.3.2. Phase II – Primary Research
1.3.3. Phase III – Expert Panel Review
1.3.4. Approach Adopted
1.3.4.1. Top-Down Approach
1.3.4.2. Bottom-Up Approach
1.3.5. Assumptions
1.4. Market Segmentation

2. Executive Summary
2.1. Market Snapshot: Global PVC Compound Market
2.2. Global PVC Compound Market, By Product Type
2.3. Global PVC Compound Market, By Application
2.4. Global PVC Compound Market, By Manufacturing Process
2.5. Global PVC Compound Market, By End-User
2.6. Global PVC Compound Market, By Region

3. Market Dynamics & Factors Analysis
3.1. Introduction
3.1.1. Global PVC Compound Market Value, 2016-2028, (US$ Bn)
3.2. Market Dynamics
3.2.1. Key Growth Trends
3.2.2. Market Drivers
3.2.3. Market Restraints
3.2.4. Market Opportunities
3.2.5. Major Industry Challenges
3.3. Attractive Investment Proposition,2021
3.3.1. Product Type
3.3.2. Application
3.3.3. Manufacturing Process
3.3.4. End-User
3.3.5. Geography

4. Premium Insights
4.1. STAR (Situation, Task, Action, Results) Analysis
4.2. Porter’s Five Forces Analysis
4.2.1. Threat of New Entrants
4.2.2. Bargaining Power of Buyers/Consumers
4.2.3. Bargaining Power of Suppliers
4.2.4. Threat of Substitute Product
4.2.5. Intensity of Competitive Rivalry
4.3. Value Chain Analysis
4.4. Technology Analysis
4.5. Marketing Strategy Analysis
4.5.1. Direct Marketing
4.5.2. Indirect Marketing
4.5.3. Marketing Channel Development Trend

5. Market Positioning of Key Players, 2021
5.1. Company market share of key players, 2021
5.2. Competitive Benchmarking
5.3. Market Positioning of Key Vendors
5.4. Geographical Presence Analysis
5.5. Major Strategies Adopted by Key Players
5.5.1. Key Strategies Analysis
5.5.2. Mergers and Acquisitions
5.5.3. Partnerships
5.5.4. Product Type Launch
5.5.5. Geographical Expansion
5.5.6. Others

6. COVID 19 Impact Analysis
6.1. Global PVC Compound Market Pre Vs Post COVID 19, 2019 – 2028
6.2. Impact on Import & Export
6.3. Impact on Demand & Supply

7. Global PVC Compound Market
7.1. Global PVC Compound Market, by Product Type, 2016-2028(US$ Bn)
7.1.1. Overview
7.1.2. Global PVC Compound Market, By Product Type, 2021 vs 2028 (in %)
7.1.3. Global PVC Compound Market, By Rigid PVC, 2016-2028 (US$ Bn)
7.1.4. Global PVC Compound Market, By Flexible PVC, 2016-2028 (US$ Bn)
7.2. Global PVC Compound Market, by Manufacturing Process, 2016-2028(US$ Bn)
7.2.1. Global PVC Compound Market, By Injection Molding, 2016-2028 (US$ Bn)
7.2.2. Global PVC Compound Market, By Extrusion, 2016-2028 (US$ Bn)
7.2.3. Global PVC Compound Market, By Others, 2016-2028 (US$ Bn)
7.3. Global PVC Compound Market, by Application, 2016-2028(US$ Bn)
7.3.1. Overview
7.3.2. Global PVC Compound Market, By Application, 2021 vs 2028 (in %)
7.3.3. Global PVC Compound Market, By Film & Sheet, 2016-2028 (US$ Bn)
7.3.4. Global PVC Compound Market, By Wire & Cabling, 2016-2028 (US$ Bn)
7.3.5. Global PVC Compound Market, By Pipe & Fitting, 2016-2028 (US$ Bn)
7.3.6. Global PVC Compound Market, By Flooring, 2016-2028 (US$ Bn)
7.3.7. Global PVC Compound Market, By Profiles & Tubes, 2016-2028 (US$ Bn)
7.3.8. Global PVC Compound Market, By Others, 2016-2028 (US$ Bn)
7.4. Global PVC Compound Market, by End-User, 2016-2028(US$ Bn)
7.4.1. Overview
7.4.2. Global PVC Compound Market, By End-User, 2021 vs 2028 (in%)
7.4.3. Global PVC Compound Market, By Electrical and Electronics, 2016-2028 (US$ Bn)
7.4.4. Global PVC Compound Market, By Building and Construction, 2016-2028 (US$ Bn)
7.4.5. Global PVC Compound Market, By Packaging, 2016-2028 (US$ Bn)
7.4.6. Global PVC Compound Market, By Automotive, 2016-2028 (US$ Bn)
7.4.7. Global PVC Compound Market, By Others, 2016-2028 (US$ Bn)

8. North America PVC Compound Market Analysis
8.1. North America PVC Compound Market, by Product Type, 2016-2028(US$ Bn)
8.1.1. Overview
8.1.2. SRC Analysis
8.2. North America PVC Compound Market, by Application, 2016-2028(US$ Bn)
8.2.1. Overview
8.2.2. SRC Analysis
8.3. North America PVC Compound Market, by Manufacturing Process, 2016-2028(US$ Bn)
8.3.1. Overview
8.3.2. SRC Analysis
8.4. North America PVC Compound Market, by End-User, 2016-2028(US$ Bn)
8.4.1. Overview
8.4.2. SRC Analysis
8.5. North America PVC Compound Market, by Country, 2016-2028(US$ Bn)
8.5.1. U.S.
8.5.1.1. U.S. PVC Compound Market Estimates and Forecast, 2016-2028 (US$ Bn)
8.5.1.2. U.S. PVC Compound, By Product Type, 2016-2028 (US$ Bn)
8.5.1.3. U.S. PVC Compound, By Application, 2016-2028 (US$ Bn)
8.5.1.4. U.S. PVC Compound, By Manufacturing Process, 2016-2028 (US$ Bn)
8.5.1.5. U.S. PVC Compound, By End-User, 2016-2028 (US$ Bn)
8.5.2. Canada
8.5.2.1. Canada PVC Compound Market Estimates and Forecast, 2016-2028 (US$ Bn)
8.5.2.2. Canada PVC Compound, By Product Type, 2016-2028 (US$ Bn)
8.5.2.3. Canada PVC Compound, By Application, 2016-2028 (US$ Bn)
8.5.2.4. Canada PVC Compound, By Manufacturing Process, 2016-2028 (US$ Bn)
8.5.2.5. Canada PVC Compound, By End-User, 2016-2028 (US$ Bn)

9. Europe PVC Compound Market Analysis
9.1. Europe PVC Compound Market, by Product Type, 2016-2028(US$ Bn)
9.1.1. Overview
9.1.2. SRC Analysis
9.2. Europe PVC Compound Market, by Application, 2016-2028(US$ Bn)
9.2.1. Overview
9.2.2. SRC Analysis
9.3. Europe PVC Compound Market, by Manufacturing Process, 2016-2028(US$ Bn)
9.3.1. Overview
9.3.2. SRC Analysis
9.4. Europe PVC Compound Market, by End-User, 2016-2028(US$ Bn)
9.4.1. Overview
9.4.2. SRC Analysis
9.5. Europe PVC Compound Market, by Country, 2016-2028 (US$ Bn)
9.5.1. Germany
9.5.1.1. Germany PVC Compound Market Estimates and Forecast, 2016-2028 (US$ Bn)
9.5.1.2. Germany PVC Compound, By Product Type, 2016-2028 (US$ Bn)
9.5.1.3. Germany PVC Compound, By Application, 2016-2028 (US$ Bn)
9.5.1.4. Germany PVC Compound, By Manufacturing Process, 2016-2028 (US$ Bn)
9.5.1.5. Germany PVC Compound, By End-User, 2016-2028 (US$ Bn)
9.5.2. France
9.5.2.1. France PVC Compound Market Estimates and Forecast, 2016-2028 (US$ Bn)
9.5.2.2. France PVC Compound, By Product Type, 2016-2028 (US$ Bn)
9.5.2.3. France PVC Compound, By Application, 2016-2028 (US$ Bn)
9.5.2.4. France PVC Compound, By Manufacturing Process, 2016-2028 (US$ Bn)
9.5.2.5. France PVC Compound, By End-User, 2016-2028 (US$ Bn)
9.5.3. UK
9.5.3.1. UK PVC Compound Market Estimates and Forecast, 2016-2028 (US$ Bn)
9.5.3.2. UK PVC Compound, By Product Type, 2016-2028 (US$ Bn)
9.5.3.3. UK PVC Compound, By Application, 2016-2028 (US$ Bn)
9.5.3.4. UK PVC Compound, By Manufacturing Process, 2016-2028 (US$ Bn)
9.5.3.5. UK PVC Compound, By End-User, 2016-2028 (US$ Bn)
9.5.4. Italy
9.5.4.1. Italy PVC Compound Market Estimates and Forecast, 2016-2028 (US$ Bn)
9.5.4.2. Italy PVC Compound, By Product Type, 2016-2028 (US$ Bn)
9.5.4.3. Italy PVC Compound, By Application, 2016-2028 (US$ Bn)
9.5.4.4. Italy PVC Compound, By Manufacturing Process, 2016-2028 (US$ Bn)
9.5.4.5. Italy PVC Compound, By End-User, 2016-2028 (US$ Bn)
9.5.5. Spain
9.5.5.1. Spain PVC Compound Market Estimates and Forecast, 2016-2028 (US$ Bn)
9.5.5.2. Spain PVC Compound, By Product Type, 2016-2028 (US$ Bn)
9.5.5.3. Spain PVC Compound, By Application, 2016-2028 (US$ Bn)
9.5.5.4. Spain PVC Compound, By Manufacturing Process, 2016-2028 (US$ Bn)
9.5.5.5. Spain PVC Compound, By End-User, 2016-2028 (US$ Bn)
9.5.6. Rest of Europe
9.5.6.1. Rest of Europe PVC Compound Market Estimates and Forecast, 2016-2028 (US$ Bn)
9.5.6.2. Rest of Europe PVC Compound, By Product Type, 2016-2028 (US$ Bn)
9.5.6.3. Rest of Europe PVC Compound, By Application, 2016-2028 (US$ Bn)
9.5.6.4. Rest of Europe PVC Compound, By Manufacturing Process, 2016-2028 (US$ Bn)
9.5.6.5. Rest of Europe PVC Compound, By End-User, 2016-2028 (US$ Bn)

10. Asia Pacific PVC Compound Market Analysis
10.1. Asia Pacific PVC Compound Market, by Product Type, 2016-2028(US$ Bn)
10.1.1. Overview
10.1.2. SRC Analysis
10.2. Asia Pacific PVC Compound Market, by Application, 2016-2028(US$ Bn)
10.2.1. Overview
10.2.2. SRC Analysis
10.3. Asia Pacific PVC Compound Market, by Manufacturing Process, 2016-2028(US$ Bn)
10.3.1. Overview
10.3.2. SRC Analysis
10.4. Asia Pacific PVC Compound Market, by End-User, 2016-2028(US$ Bn)
10.4.1. Overview
10.4.2. SRC Analysis
10.5. Asia Pacific PVC Compound Market, by Country, 2016-2028 (US$ Bn)
10.5.1. China
10.5.1.1. China PVC Compound Market Estimates and Forecast, 2016-2028 (US$ Bn)
10.5.1.2. China PVC Compound, By Product Type, 2016-2028 (US$ Bn)
10.5.1.3. China PVC Compound, By Application, 2016-2028 (US$ Bn)
10.5.1.4. China PVC Compound, By Manufacturing Process, 2016-2028 (US$ Bn)
10.5.1.5. China PVC Compound, By End-User, 2016-2028 (US$ Bn)
10.5.2. Japan
10.5.2.1. Japan PVC Compound Market Estimates and Forecast, 2016-2028 (US$ Bn)
10.5.2.2. Japan PVC Compound, By Product Type, 2016-2028 (US$ Bn)
10.5.2.3. Japan PVC Compound, By Application, 2016-2028 (US$ Bn)
10.5.2.4. Japan PVC Compound, By Manufacturing Process, 2016-2028 (US$ Bn)
10.5.2.5. Japan PVC Compound, By End-User, 2016-2028 (US$ Bn)
10.5.3. India
10.5.3.1. India PVC Compound Market Estimates and Forecast, 2016-2028 (US$ Bn)
10.5.3.2. India PVC Compound, By Product Type, 2016-2028 (US$ Bn)
10.5.3.3. India PVC Compound, By Application, 2016-2028 (US$ Bn)
10.5.3.4. India PVC Compound, By Manufacturing Process, 2016-2028 (US$ Bn)
10.5.3.5. India PVC Compound, By End-User, 2016-2028 (US$ Bn)
10.5.4. South Korea
10.5.4.1. South Korea PVC Compound Market Estimates and Forecast, 2016-2028 (US$ Bn)
10.5.4.2. South Korea PVC Compound, By Product Type, 2016-2028 (US$ Bn)
10.5.4.3. South Korea PVC Compound, By Manufacturing Process, 2016-2028 (US$ Bn)
10.5.4.4. South Korea PVC Compound, By Application, 2016-2028 (US$ Bn)
10.5.4.5. South Korea PVC Compound, By End-User, 2016-2028 (US$ Bn)
10.5.5. South-East Asia
10.5.5.1. South-East Asia PVC Compound Market Estimates and Forecast, 2016-2028 (US$ Bn)
10.5.5.2. South-East Asia PVC Compound, By Product Type, 2016-2028 (US$ Bn)
10.5.5.3. South-East Asia PVC Compound, By Application, 2016-2028 (US$ Bn)
10.5.5.4. South-East Asia PVC Compound, By Manufacturing Process, 2016-2028 (US$ Bn)
10.5.5.5. South-East Asia PVC Compound, By End-User, 2016-2028 (US$ Bn)
10.5.6. Rest of Asia Pacific
10.5.6.1. Rest of Asia Pacific PVC Compound Market Estimates and Forecast, 2016-2028 (US$ Bn)
10.5.6.2. Rest of Asia Pacific PVC Compound, By Product Type, 2016-2028 (US$ Bn)
10.5.6.3. Rest of Asia Pacific PVC Compound, By Application, 2016-2028 (US$ Bn)
10.5.6.4. Rest of Asia Pacific PVC Compound, By Manufacturing Process, 2016-2028 (US$ Bn)
10.5.6.5. Rest of Asia Pacific PVC Compound, By End-User, 2016-2028 (US$ Bn)

11. Latin America PVC Compound Market Analysis
11.1. Latin America PVC Compound Market, by Product Type, 2016-2028(US$ Bn)
11.1.1. Overview
11.1.2. SRC Analysis
11.2. Latin America PVC Compound Market, by Application, 2016-2028(US$ Bn)
11.2.1. Overview
11.2.2. SRC Analysis
11.3. Latin America PVC Compound Market, by Manufacturing Process, 2016-2028(US$ Bn)
11.3.1. Overview
11.3.2. SRC Analysis
11.4. Latin America PVC Compound Market, by End-User, 2016-2028(US$ Bn)
11.4.1. Overview
11.4.2. SRC Analysis
11.5. Latin America PVC Compound Market, by Country, 2016-2028 (US$ Bn)
11.5.1. Brazil
11.5.1.1. Brazil PVC Compound Market Estimates and Forecast, 2016-2028 (US$ Bn)
11.5.1.2. Brazil PVC Compound, By Product Type, 2016-2028 (US$ Bn)
11.5.1.3. Brazil PVC Compound, By Application, 2016-2028 (US$ Bn)
11.5.1.4. Brazil PVC Compound, By Manufacturing Process, 2016-2028 (US$ Bn)
11.5.1.5. Brazil PVC Compound, By End-User, 2016-2028 (US$ Bn)
11.5.2. Mexico
11.5.2.1. Mexico PVC Compound Market Estimates and Forecast, 2016-2028 (US$ Bn)
11.5.2.2. Mexico PVC Compound, By Product Type, 2016-2028 (US$ Bn)
11.5.2.3. Mexico PVC Compound, By Application, 2016-2028 (US$ Bn)
11.5.2.4. Mexico PVC Compound, By Manufacturing Process, 2016-2028 (US$ Bn)
11.5.2.5. Mexico PVC Compound, By End-User, 2016-2028 (US$ Bn)
11.5.3. Rest of Latin America
11.5.3.1. Rest of Latin America PVC Compound Market Estimates and Forecast, 2016-2028 (US$ Bn)
11.5.3.2. Rest of Latin America PVC Compound, By Product Type, 2016-2028 (US$ Bn)
11.5.3.3. Rest of Latin America PVC Compound, By Application, 2016-2028 (US$ Bn)
11.5.3.4. Rest of Latin America PVC Compound, By Manufacturing Process, 2016-2028 (US$ Bn)
11.5.3.5. Rest of Latin America PVC Compound, By End-User, 2016-2028 (US$ Bn)

12. Middle East and Africa PVC Compound Market Analysis
12.1. Middle East and Africa PVC Compound Market, by Product Type, 2016-2028(US$ Bn)
12.1.1. Overview
12.1.2. SRC Analysis
12.2. Middle East and Africa PVC Compound Market, by Application, 2016-2028(US$ Bn)
12.2.1. Overview
12.2.2. SRC Analysis
12.3. Middle East and Africa PVC Compound Market, by Manufacturing Process, 2016-2028(US$ Bn)
12.3.1. Overview
12.3.2. SRC Analysis
12.4. Middle East and Africa PVC Compound Market, by End-User, 2016-2028(US$ Bn)
12.4.1. Overview
12.4.2. SRC Analysis
12.5. Middle East and Africa PVC Compound Market, by Country, 2016-2028 (US$ Bn)
12.5.1. GCC Countries
12.5.1.1. GCC Countries il PVC Compound Market Estimates and Forecast, 2016-2028 (US$ Bn)
12.5.1.2. GCC Countries PVC Compound, By Product Type, 2016-2028 (US$ Bn)
12.5.1.3. GCC Countries PVC Compound, By Application, 2016-2028 (US$ Bn)
12.5.1.4. GCC Countries PVC Compound, By Manufacturing Process, 2016-2028 (US$ Bn)
12.5.1.5. GCC Countries PVC Compound, By End-User, 2016-2028 (US$ Bn)
12.5.2. South Africa
12.5.2.1. South Africa PVC Compound Market Estimates and Forecast, 2016-2028 (US$ Bn)
12.5.2.2. South Africa PVC Compound, By Product Type, 2016-2028 (US$ Bn)
12.5.2.3. South Africa PVC Compound, By Manufacturing Process, 2016-2028 (US$ Bn)
12.5.2.4. South Africa PVC Compound, By Application, 2016-2028 (US$ Bn)
12.5.2.5. South Africa PVC Compound, By End-User, 2016-2028 (US$ Bn)
12.5.3. Rest of Middle East and Africa
12.5.3.1. Rest of Middle East and Africa PVC Compound Market Estimates and Forecast, 2016-2028 (US$ Bn)
12.5.3.2. Rest of Middle East and Africa PVC Compound, By Product Type, 2016-2028 (US$ Bn)
12.5.3.3. Rest of Middle East and Africa PVC Compound, By Application, 2016-2028 (US$ Bn)
12.5.3.4. Rest of Middle East and Africa PVC Compound, By Manufacturing Process, 2016-2028 (US$ Bn)
12.5.3.5. Rest of Middle East and Africa PVC Compound, By End-User, 2016-2028 (US$ Bn)

13. Company Profiles
13.1. Aurora Plastics
13.1.1. Company Overview
13.1.2. Product Types/Services Portfolio
13.1.3. Geographical Presence
13.1.4. Financial Summary
13.1.4.1. Market Revenue and Net Profit (2019-2021)
13.1.4.2. Business Segment Revenue Analysis
13.1.4.3. Geographical Revenue Analysis
13.2. Benvic Europe
13.3. Ercros
13.4. Formosa Plastics Corporation
13.5. INEOS Compounds
13.6. Mexichem
13.7. PKN Orlen S. A.
13.8. Roscom, Inc.
13.9. Teknor Apex
13.10. Westlake

List of Figures

FIG. 1 Global PVC Compound Market: Research Methodology
FIG. 2 Market Size Estimation – Top Down & Bottom up Approach
FIG. 3 Global PVC Compound Market Segmentation
FIG. 4 Global PVC Compound Market, by Product Type, 2021 (US$ Bn)
FIG. 5 Global PVC Compound Market, by Application, 2021 (US$ Bn)
FIG. 6 Global PVC Compound Market, by Manufacturing Process, 2021 (US$ Bn)
FIG. 7 Global PVC Compound Market, by End-User, 2021 (US$ Bn)
FIG. 8 Global PVC Compound Market, by Geography, 2021(US$ Bn)
FIG. 9 Attractive Investment Proposition, by Product Type, 2021
FIG. 10 Attractive Investment Proposition, by Application, 2021
FIG. 11 Attractive Investment Proposition, by Manufacturing Process, 2021
FIG. 12 Attractive Investment Proposition, by End-User, 2021
FIG. 13 Attractive Investment Proposition, by Geography, 2021
FIG. 14 Global Market Share Analysis of Key PVC Compound Market Manufacturers, 2021
FIG. 15 Global Market Positioning of Key PVC Compound Market Manufacturers, 2021
FIG. 16 Global PVC Compound Market Value Contribution, By Product Type, 2021 & 2028 (Value %)
FIG. 17 Global PVC Compound Market, by Rigid PVC, Value, 2016-2028(US$ Bn)
FIG. 18 Global PVC Compound Market, by Flexible PVC, Value, 2016-2028 (US$ Bn)
FIG. 19 Global PVC Compound Market Value Contribution, By Manufacturing Process, 2021 & 2028 (Value %)
FIG. 20 Global PVC Compound Market, by Injection Molding, Value, 2016-2028(US$ Bn)
FIG. 21 Global PVC Compound Market, by Extrusion, Value, 2016-2028 (US$ Bn)
FIG. 22 Global PVC Compound Market, by Others, Value, 2016-2028 (US$ Bn)
FIG. 23 Global PVC Compound Market Value Contribution, By Application, 2021 & 2028 (Value %)
FIG. 24 Global PVC Compound Market, by Film & Sheet, Value, 2016-2028(US$ Bn)
FIG. 25 Global PVC Compound Market, By Wire & Cabling, Value, 2016-2028 (US$ Bn)
FIG. 26 Global PVC Compound Market, By Pipe & Fitting, Value, 2016-2028(US$ Bn)
FIG. 27 Global PVC Compound Market, By Flooring, Value, 2016-2028(US$ Bn)
FIG. 28 Global PVC Compound Market, By Profiles & Tubes, Value, 2016-2028(US$ Bn)
FIG. 29 Global PVC Compound Market, By Others, Value, 2016-2028(US$ Bn)
FIG. 30 Global PVC Compound Market Value Contribution, By End-User, 2021 & 2028 (Value %)
FIG. 31 Global PVC Compound Market, by Electrical and Electronics, Value, 2016-2028(US$ Bn)
FIG. 32 Global PVC Compound Market, by Building and Construction, Value, 2016-2028 (US$ Bn)
FIG. 33 Global PVC Compound Market, by Packaging, Value, 2016-2028 (US$ Bn)
FIG. 34 Global PVC Compound Market, by Automotive, Value, 2016-2028 (US$ Bn)
FIG. 35 Global PVC Compound Market, by Others, Value, 2016-2028(US$ Bn)
FIG. 36 U.S. PVC Compound Market, 2016-2028(US$ Bn)
FIG. 37 Canada PVC Compound Market, 2016-2028(US$ Bn)
FIG. 38 Germany PVC Compound Market, 2016-2028(US$ Bn)
FIG. 39 France PVC Compound Market, 2016-2028(US$ Bn)
FIG. 40 U.K. PVC Compound Market, 2016-2028(US$ Bn)
FIG. 41 Italy PVC Compound Market, 2016-2028(US$ Bn)
FIG. 42 Spain PVC Compound Market, 2016-2028(US$ Bn)
FIG. 43 Rest of Europe PVC Compound Market, 2016-2028(US$ Bn)
FIG. 44 China PVC Compound Market, 2016-2028(US$ Bn)
FIG. 45 Japan PVC Compound Market, 2016-2028(US$ Bn)
FIG. 46 India PVC Compound Market, 2016-2028(US$ Bn)
FIG. 47 South Korea PVC Compound Market, 2016-2028(US$ Bn)
FIG. 48 Southeast Asia PVC Compound Market, 2016-2028(US$ Bn)
FIG. 49 Rest of Asia Pacific PVC Compound Market, 2016-2028(US$ Bn)
FIG. 50 Latin America PVC Compound Market, 2016-2028(US$ Bn)
FIG. 51 Brazil PVC Compound Market, 2016-2028(US$ Bn)
FIG. 52 Mexico PVC Compound Market, 2016-2028(US$ Bn)
FIG. 53 Rest of Latin America PVC Compound Market, 2016-2028(US$ Bn)
FIG. 54 Middle East & Africa PVC Compound Market, 2016-2028(US$ Bn)
FIG. 55 GCC Countries PVC Compound Market, 2016-2028(US$ Bn)
FIG. 56 South Africa PVC Compound Market, 2016-2028(US$ Bn)
FIG. 57 Rest of Middle East and Africa PVC Compound Market, 2016-2028(US$ Bn)

List of Tables

TABLE 1 Market Snapshot: Global PVC Compound Market
TABLE 2 Global PVC Compound Market, by Competitive Benchmarking, 2021
TABLE 3 Global PVC Compound Market, by Geographical Presence Analysis, 2021
TABLE 4 Global PVC Compound Market, by Key Strategies Analysis, 2021
TABLE 5 Global PVC Compound Market, by Product Type, 2016-2028(US$ Bn)
TABLE 6 Global PVC Compound Market, by Application, 2016-2028(US$ Bn)
TABLE 7 Global PVC Compound Market, by Manufacturing Process, 2016-2028(US$ Bn)
TABLE 8 Global PVC Compound Market, by End-User, 2016-2028(US$ Bn)
TABLE 9 Global PVC Compound Market, by Geography, 2016-2028(US$ Bn)
TABLE 10 North America PVC Compound Market, by Product Type, 2016-2028(US$ Bn)
TABLE 11 North America PVC Compound Market, by Application, 2016-2028(US$ Bn)
TABLE 12 North America PVC Compound Market, by Manufacturing Process, 2016-2028(US$ Bn)
TABLE 13 North America PVC Compound Market, by End-User, 2016-2028(US$ Bn)
TABLE 14 North America PVC Compound Market, by Country, 2016-2028(US$ Bn)
TABLE 15 US PVC Compound Market, by Product Type, 2016-2028(US$ Bn)
TABLE 16 US PVC Compound Market, by Application, 2016-2028(US$ Bn)
TABLE 17 US PVC Compound Market, by Manufacturing Process, 2016-2028(US$ Bn)
TABLE 18 US PVC Compound Market, by End-User, 2016-2028(US$ Bn)
TABLE 19 Canada PVC Compound Market, by Product Type, 2016-2028(US$ Bn)
TABLE 20 Canada PVC Compound Market, by Application, 2016-2028(US$ Bn)
TABLE 21 Canada PVC Compound Market, by Manufacturing Process, 2016-2028(US$ Bn)
TABLE 22 Canada PVC Compound Market, by End-User, 2016-2028(US$ Bn)
TABLE 23 Europe PVC Compound Market, by Product Type, 2016-2028(US$ Bn)
TABLE 24 Europe PVC Compound Market, by Application, 2016-2028(US$ Bn)
TABLE 25 Europe PVC Compound Market, by Manufacturing Process, 2016-2028(US$ Bn)
TABLE 26 Europe PVC Compound Market, by End-User, 2016-2028(US$ Bn)
TABLE 27 Europe PVC Compound Market, by Country, 2016-2028(US$ Bn)
TABLE 28 Germany PVC Compound Market, by Product Type, 2016-2028(US$ Bn)
TABLE 29 Germany PVC Compound Market, by Application, 2016-2028(US$ Bn)
TABLE 30 Germany PVC Compound Market, by Manufacturing Process, 2016-2028(US$ Bn)
TABLE 31 Germany PVC Compound Market, by End-User, 2016-2028(US$ Bn)
TABLE 32 France PVC Compound Market, by Product Type, 2016-2028(US$ Bn)
TABLE 33 France PVC Compound Market, by Application, 2016-2028(US$ Bn)
TABLE 34 France PVC Compound Market, by Manufacturing Process, 2016-2028(US$ Bn)
TABLE 35 France PVC Compound Market, by End-User, 2016-2028(US$ Bn)
TABLE 36 UK PVC Compound Market, by Product Type, 2016-2028 (US$ Bn)
TABLE 37 UK PVC Compound Market, by Application, 2016-2028 (US$ Bn)
TABLE 38 UK PVC Compound Market, by Manufacturing Process, 2016-2028 (US$ Bn)
TABLE 39 UK PVC Compound Market, by End-User, 2016-2028 (US$ Bn)
TABLE 40 Italy PVC Compound Market, by Product Type, 2016-2028 (US$ Bn)
TABLE 41 Italy PVC Compound Market, by Application, 2016-2028 (US$ Bn)
TABLE 42 Italy PVC Compound Market, by Manufacturing Process, 2016-2028 (US$ Bn)
TABLE 43 Italy PVC Compound Market, by End-User, 2016-2028 (US$ Bn)
TABLE 44 Spain PVC Compound Market, by Product Type, 2016-2028 (US$ Bn)
TABLE 45 Spain PVC Compound Market, by Application, 2016-2028 (US$ Bn)
TABLE 46 Spain PVC Compound Market, by Manufacturing Process, 2016-2028 (US$ Bn)
TABLE 47 Spain PVC Compound Market, by End-User, 2016-2028(US$ Bn)
TABLE 48 Rest of Europe PVC Compound Market, by Product Type, 2016-2028(US$ Bn)
TABLE 49 Rest of Europe PVC Compound Market, by Application, 2016-2028(US$ Bn)
TABLE 50 Rest of Europe PVC Compound Market, by Manufacturing Process, 2016-2028(US$ Bn)
TABLE 51 Rest of Europe PVC Compound Market, by End-User, 2016-2028(US$ Bn)
TABLE 52 Asia Pacific PVC Compound Market, by Product Type, 2016-2028(US$ Bn)
TABLE 53 Asia Pacific PVC Compound Market, by Application, 2016-2028(US$ Bn)
TABLE 54 Asia Pacific PVC Compound Market, by Manufacturing Process, 2016-2028(US$ Bn)
TABLE 55 Asia Pacific PVC Compound Market, by End-User, 2016-2028(US$ Bn)
TABLE 56 Asia Pacific PVC Compound Market, by Country, 2016-2028(US$ Bn)
TABLE 57 China PVC Compound Market, by Product Type, 2016-2028(US$ Bn)
TABLE 58 China PVC Compound Market, by Application, 2016-2028(US$ Bn)
TABLE 59 China PVC Compound Market, by Manufacturing Process, 2016-2028(US$ Bn)
TABLE 60 China PVC Compound Market, by End-User, 2016-2028(US$ Bn)
TABLE 61 Japan PVC Compound Market, by Product Type, 2016-2028(US$ Bn)
TABLE 62 Japan PVC Compound Market, by Application, 2016-2028(US$ Bn)
TABLE 63 Japan PVC Compound Market, by Manufacturing Process, 2016-2028(US$ Bn)
TABLE 64 Japan PVC Compound Market, by End-User, 2016-2028(US$ Bn)
TABLE 65 India PVC Compound Market, by Product Type, 2016-2028(US$ Bn)
TABLE 66 India PVC Compound Market, by Application, 2016-2028(US$ Bn)
TABLE 67 India PVC Compound Market, by Manufacturing Process, 2016-2028(US$ Bn)
TABLE 68 India PVC Compound Market, by End-User, 2016-2028(US$ Bn)
TABLE 69 South Korea PVC Compound Market, by Product Type, 2016-2028(US$ Bn)
TABLE 70 South Korea PVC Compound Market, by Application, 2016-2028(US$ Bn)
TABLE 71 South Korea PVC Compound Market, by Manufacturing Process, 2016-2028(US$ Bn)
TABLE 72 South Korea PVC Compound Market, by End-User, 2016-2028(US$ Bn)
TABLE 73 South East Asia PVC Compound Market, by Product Type, 2016-2028(US$ Bn)
TABLE 74 South East Asia PVC Compound Market, by Application, 2016-2028(US$ Bn)
TABLE 75 South East Asia PVC Compound Market, by Manufacturing Process, 2016-2028(US$ Bn)
TABLE 76 South East Asia PVC Compound Market, by End-User, 2016-2028(US$ Bn)
TABLE 77 Rest of Asia Pacific PVC Compound Market, by Product Type, 2016-2028(US$ Bn)
TABLE 78 Rest of Asia Pacific PVC Compound Market, by Application, 2016-2028(US$ Bn)
TABLE 79 Rest of Asia Pacific PVC Compound Market, by Manufacturing Process, 2016-2028(US$ Bn)
TABLE 80 Rest of Asia Pacific PVC Compound Market, by End-User, 2016-2028(US$ Bn)
TABLE 81 Latin America PVC Compound Market, by Product Type, 2016-2028(US$ Bn)
TABLE 82 Latin America PVC Compound Market, by Application, 2016-2028(US$ Bn)
TABLE 83 Latin America PVC Compound Market, by Manufacturing Process, 2016-2028(US$ Bn)
TABLE 84 Latin America PVC Compound Market, by End-User, 2016-2028(US$ Bn)
TABLE 85 Latin America PVC Compound Market, by Country, 2016-2028(US$ Bn)
TABLE 86 Brazil PVC Compound Market, by Product Type, 2016-2028(US$ Bn)
TABLE 87 Brazil PVC Compound Market, by Application, 2016-2028(US$ Bn)
TABLE 88 Brazil PVC Compound Market, by Manufacturing Process, 2016-2028(US$ Bn)
TABLE 89 Brazil PVC Compound Market, by End-User, 2016-2028(US$ Bn)
TABLE 90 Mexico PVC Compound Market, by Product Type, 2016-2028(US$ Bn)
TABLE 91 Mexico PVC Compound Market, by Application, 2016-2028(US$ Bn)
TABLE 92 Mexico PVC Compound Market, by Manufacturing Process, 2016-2028(US$ Bn)
TABLE 93 Mexico PVC Compound Market, by End-User, 2016-2028(US$ Bn)
TABLE 94 Rest of Latin America PVC Compound Market, by Product Type, 2016-2028(US$ Bn)
TABLE 95 Rest of Latin America PVC Compound Market, by Application, 2016-2028(US$ Bn)
TABLE 96 Rest of Latin America PVC Compound Market, by Manufacturing Process, 2016-2028(US$ Bn)
TABLE 97 Rest of Latin America PVC Compound Market, by End-User, 2016-2028(US$ Bn)
TABLE 98 Middle East and Africa PVC Compound Market, by Product Type, 2016-2028(US$ Bn)
TABLE 99 Middle East and Africa PVC Compound Market, by Application, 2016-2028(US$ Bn)
TABLE 100 Middle East and Africa PVC Compound Market, by Manufacturing Process, 2016-2028(US$ Bn)
TABLE 101 Middle East and Africa PVC Compound Market, by End-User, 2016-2028(US$ Bn)
TABLE 102 Middle East and Africa PVC Compound Market, by Country, 2016-2028(US$ Bn)
TABLE 103 GCC Countries PVC Compound Market, by Product Type, 2016-2028(US$ Bn)
TABLE 104 GCC Countries PVC Compound Market, by Application, 2016-2028(US$ Bn)
TABLE 105 GCC Countries PVC Compound Market, by Manufacturing Process, 2016-2028(US$ Bn)
TABLE 106 GCC Countries PVC Compound Market, by End-User, 2016-2028(US$ Bn)
TABLE 107 South Africa PVC Compound Market, by Product Type, 2016-2028(US$ Bn)
TABLE 108 South Africa PVC Compound Market, by Application, 2016-2028(US$ Bn)
TABLE 109 South Africa PVC Compound Market, by Manufacturing Process, 2016-2028(US$ Bn)
TABLE 110 South Africa PVC Compound Market, by End-User, 2016-2028(US$ Bn)
TABLE 111 Rest of Middle East and Africa PVC Compound Market, by Product Type, 2016-2028(US$ Bn)
TABLE 112 Rest of Middle East and Africa PVC Compound Market, by Application, 2016-2028(US$ Bn)
TABLE 113 Rest of Middle East and Africa PVC Compound Market, by Manufacturing Process, 2016-2028(US$ Bn)
TABLE 114 Rest of Middle East and Africa PVC Compound Market, by End-User, 2016-2028(US$ Bn)

Frequently Asked Questions

How does COVID-19 Impact the global PVC compound market?

COVID-19 has significantly impacted the market due to the rapid adoption of remote working and cloud infrastructure.

Which is the leading region of the market for PVC compound?

Asia Pacific accounted for the most heightened share in the global PVC compound market.

What are the key drivers for the growth of the PVC compound market?

The major drivers for this market are increasing demand for PVC in building and construction activities and growth in consumer electronics.

Which is the major segment in the PVC compound market by product type?

The flexible PVC segment had a major share in the global market in 2021.

Which is the major segment in the PVC compound market by application?

The film and sheetsegment had a major share in the global market in 2021.

Powder Coating Market

Published:
Report ID: 10783

Masterbatch Market

Published:
Report ID: 37059

Polycrystalline CVD Diamond Market

Published:
Report ID: 37009

Middle East and Africa Masterbatch Market

Published:
Report ID: 36966

Ferrous Slag Market

Published:
Report ID: 6261

Surfactants Market

Published:
Report ID: 10221

Graphite Market

Published:
Report ID: 6554

Saudi Arabia Plastic Products Market

Published:
Report ID: 36905

Copper Oxychloride Market

Published:
Report ID: 12415

India Oilfield Services Market

Published:
Report ID: 36781

Collagen Market

Published:
Report ID: 36725

Isostearic Acid Market

Published:
Report ID: 7580

Purchase Options

$2999
Delivery Format: Excel.
$4999
Designed for the individual purchaser.
$6999
Users located at a single corporate site or regional office.
$7999
Allowed for unlimited sharing globally within one company.
Smallform of Sample request

Have a question?

User Profile

Don’t settle for less – trust Mitul to help you find the best solution.

Report delivery within 24 to 48 hours

– Other Info –

What people say?-

User Review

I am very impressed with the information in this report. The author clearly did their research when they came up with this product and it has already given me a lot of ideas.

Jana Schmidt
CEDAR CX Technologies

– Connect with us –

Phone

+91 6232 49 3207


support

24/7 Research Support


sales@credenceresearch.com

– Research Methodology –

Going beyond the basics: advanced techniques in research methodology

– Trusted By –

Pepshi, LG, Nestle
Motorola, Honeywell, Johnson and johnson
LG Chem, SIEMENS, Pfizer
Unilever, Samsonite, QIAGEN