
Quick answer
An integrated cement plant making about 3 million metric tons a year from a 6,000 tons-per-day clinker line needs total CapEx of roughly USD 300–450 million at an emerging-market site, including quarry development, captive power and working capital margin. Gross margin typically runs 25–35% of ex-factory price, and payback falls in a 6–11 year band at 65–80% utilization, which makes limestone access and scale the deciding factors.
Feasible for well-capitalized entrants with owned limestone, cheap fuel and a regional market within trucking or barge range; a poor choice for short-horizon capital or oversupplied markets.
Cement plant: key highlights
| Parameter | Indicative value | Note |
|---|---|---|
| Plant capacity | 3 million tons of cement per year | About 6,000 tons of clinker per day, or 2 million tons of clinker a year |
| Total CapEx | USD 300–450 million | Emerging-market greenfield site; U.S. or EU builds can run two to three times higher (assumed) |
| Raw material share of operating cost | 20–25% | Energy is larger, at about 44% of operating cost before outbound freight |
| Gross margin | 25–35% | On an assumed ex-factory price of USD 60–90 per ton |
| Payback period | 6–11 years | At 65–80% utilization, before financing costs and tax |
| IRR | Available in report | Post-tax, 10-year model |
| Break-even | Available in report | Capacity utilization basis |
Ranges assume an integrated dry-process plant of 3 million tons of cement a year, a 6,000 tons-per-day clinker line, a granted quarry lease and an emerging-market site, 2026 prices, an assumed ex-factory price of USD 60–90 per ton and 65–80% utilization. Rupee figures convert at 82–88 per USD. U.S. or EU sites cost more. The full report can be customized to any country.
What is cement?
Cement is a fine hydraulic binder that sets and gains strength when mixed with water, which is why it holds together nearly all concrete and mortar. Portland cement is made by burning limestone and clay into clinker, then grinding the clinker with gypsum. All tons on this page are metric.
Common grades include ordinary Portland cement, Portland limestone and blended types that replace part of the clinker with fly ash, slag or calcined clay. Specialty products include white, sulfate-resisting and oil well cement. Blends matter commercially because each point of clinker replaced lowers fuel use, carbon exposure and cost per ton.
Gray Portland cement falls under HS code 252329, with white cement under 252321 and traded clinker under 252310. Most output goes to housing, roads, dams and industrial building through bags sold to dealers and bulk tankers sold to ready-mix concrete producers. Low value per ton keeps most sales within a few hundred kilometers of the plant unless water transport is available.
Cement market overview and global demand
Credence Research values the global Portland cement market at USD 394.4 billion in 2024 and forecasts USD 488.1 billion by 2032, a 2.7% CAGR. Carried forward, that implies about USD 405 billion in 2025, based on the 2024 figure and that growth rate. The slow pace reflects a mature industry in which growth has shifted by region, not a shortage of volume.
U.S. Geological Survey estimates put world output near 3.8 billion tons in 2025. China led at about 1.7 billion tons, followed by India at 470 million and Vietnam at 100 million. Turkey, the United States, Iran and Brazil each made roughly 67–89 million tons. World clinker capacity stood at about 3.8 billion tons, so spare capacity is a structural feature of the business.
Demand is moving away from China, where output kept falling in 2025 while India kept adding kilns. International cement Review's year-end survey described global demand as flat in 2025 as emerging-market growth offset North Asian declines. South Asia, Southeast Asia and Africa are the regions where a new kiln most often finds an unserved market.
Trade is small relative to output but sets price ceilings on coasts. The United States imported about 23 million tons in 2025, with Turkey, Canada, Vietnam and Greece as main suppliers. West African buyers increasingly source clinker from China and Vietnam. The EU carbon border mechanism, in its definitive phase since Jan. 1, 2026, adds cost for importers into Europe and shields lower-emission producers there.
Cement manufacturing process
The process is a continuous chain built around one kiln, so downtime at any stage is costly. Each ton of clinker consumes roughly 1.5 tons of limestone (assumed) because carbon dioxide leaves the rock in the kiln, and that chemical release causes most of the sector's emissions.
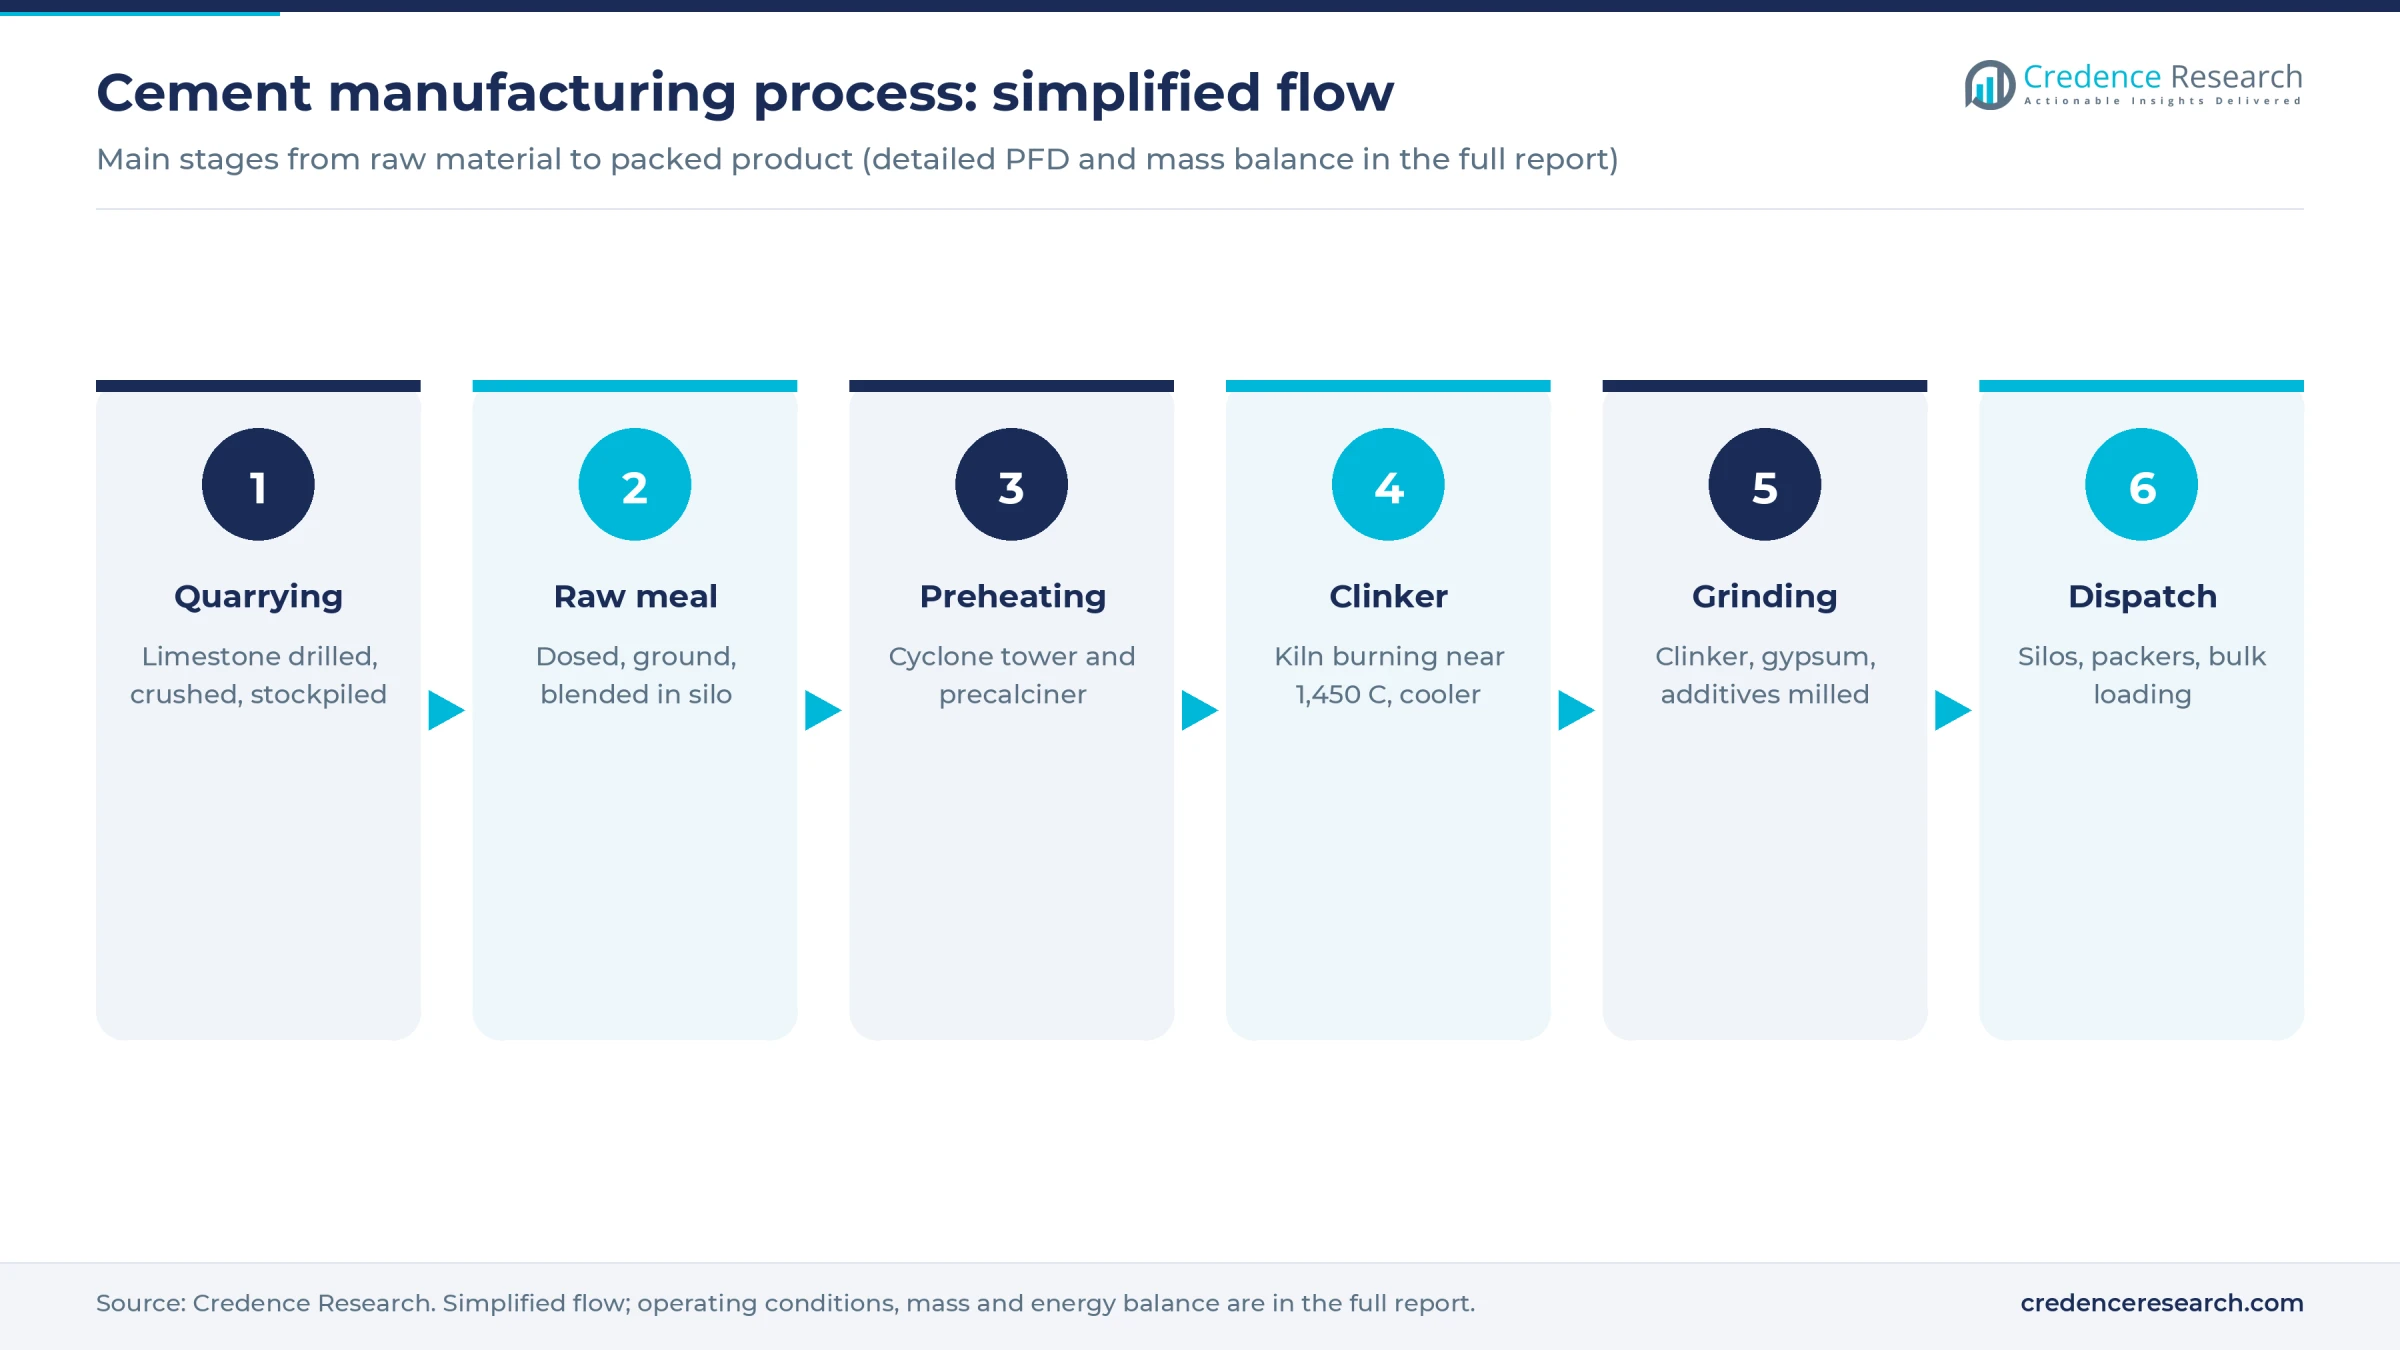
- Quarrying and crushing. Limestone is drilled, blasted, crushed and moved by truck or overland conveyor to a covered stockpile. Long-life reserves near the plant decide the economics of a project before any machine is bought.
- Raw meal preparation. Limestone, clay, iron ore and bauxite or sand are proportioned, then dried and ground in a vertical roller mill and blended in a silo. Consistent chemistry protects both kiln stability and final strength.
- Preheating and calcining. Raw meal falls through a multi-stage cyclone tower and a precalciner, where hot gases drive off most of the carbon dioxide before the material enters the kiln.
- Clinker burning and cooling. The rotary kiln sinters the material near 1,450 degrees Celsius into clinker nodules, and a grate cooler recovers heat for combustion air. Cement Europe, formerly Cembureau, puts best-practice fuel use for such kilns at about 3,300 MJ per ton of clinker, with long dry kilns using about a third more.
- Cement grinding. Clinker is ground with gypsum and any fly ash, slag or limestone in ball or vertical mills. Fineness and mix set the strength grade, and grinding is the largest single electricity user.
- Storage and dispatch. Cement goes to silos, then rotary packers or bulk loaders for truck, rail or ship. Laboratory checks at each stage support the product certification a buyer will ask to see.
Waste heat recovery and alternative fuels such as biomass or refuse-derived fuel are now standard design questions, because both reduce exposure to fuel prices and carbon rules. Large integrated plants also commonly split grinding units closer to customers, a design that lowers freight but adds a second site to fund.
Cement plant setup cost
For an integrated plant making 3 million tons of cement a year, total project cost lands at roughly USD 300–450 million at an emerging-market site, the cost region used for this range. That equals about USD 100–150 per ton of annual capacity. Cement is among the most capital-heavy materials to enter, so this scale is the practical floor for competitive clinker making. The full report can be customized to any country.
Disclosed projects anchor the range. West China cement committed USD 300 million to a Ugandan line designed for about 3 million tons of cement, reported in April 2026, or USD 100 per ton. A January 2026 contract for a 3 million ton line in Sokoto, Nigeria, with a power plant, was USD 240 million, or USD 80 per ton. A USD 250 million contract at Matuga, Kenya, reported in December 2025, lifts cement capacity by 1.6–2.2 million tons, depending on the report, or about USD 114–156 per ton. Owner costs, quarry development and working capital sit on top of contract values, which lifts this page's range above the 3 million ton contract, while the smaller Matuga project shows cost per ton rising at lower scale. U.S. or EU sites can run two to three times higher (assumed) on labor, permitting and emission controls.
Land shows how the build works. A plant, stockpile yard, colony and rail siding could need about 150 hectares, or 1.5 million sq m (assumed). At USD 4–12 per sq m for rural industrial land near a quarry (assumed), land costs about USD 6–18 million. The spread is wide, and any site beside a port or city costs far more.
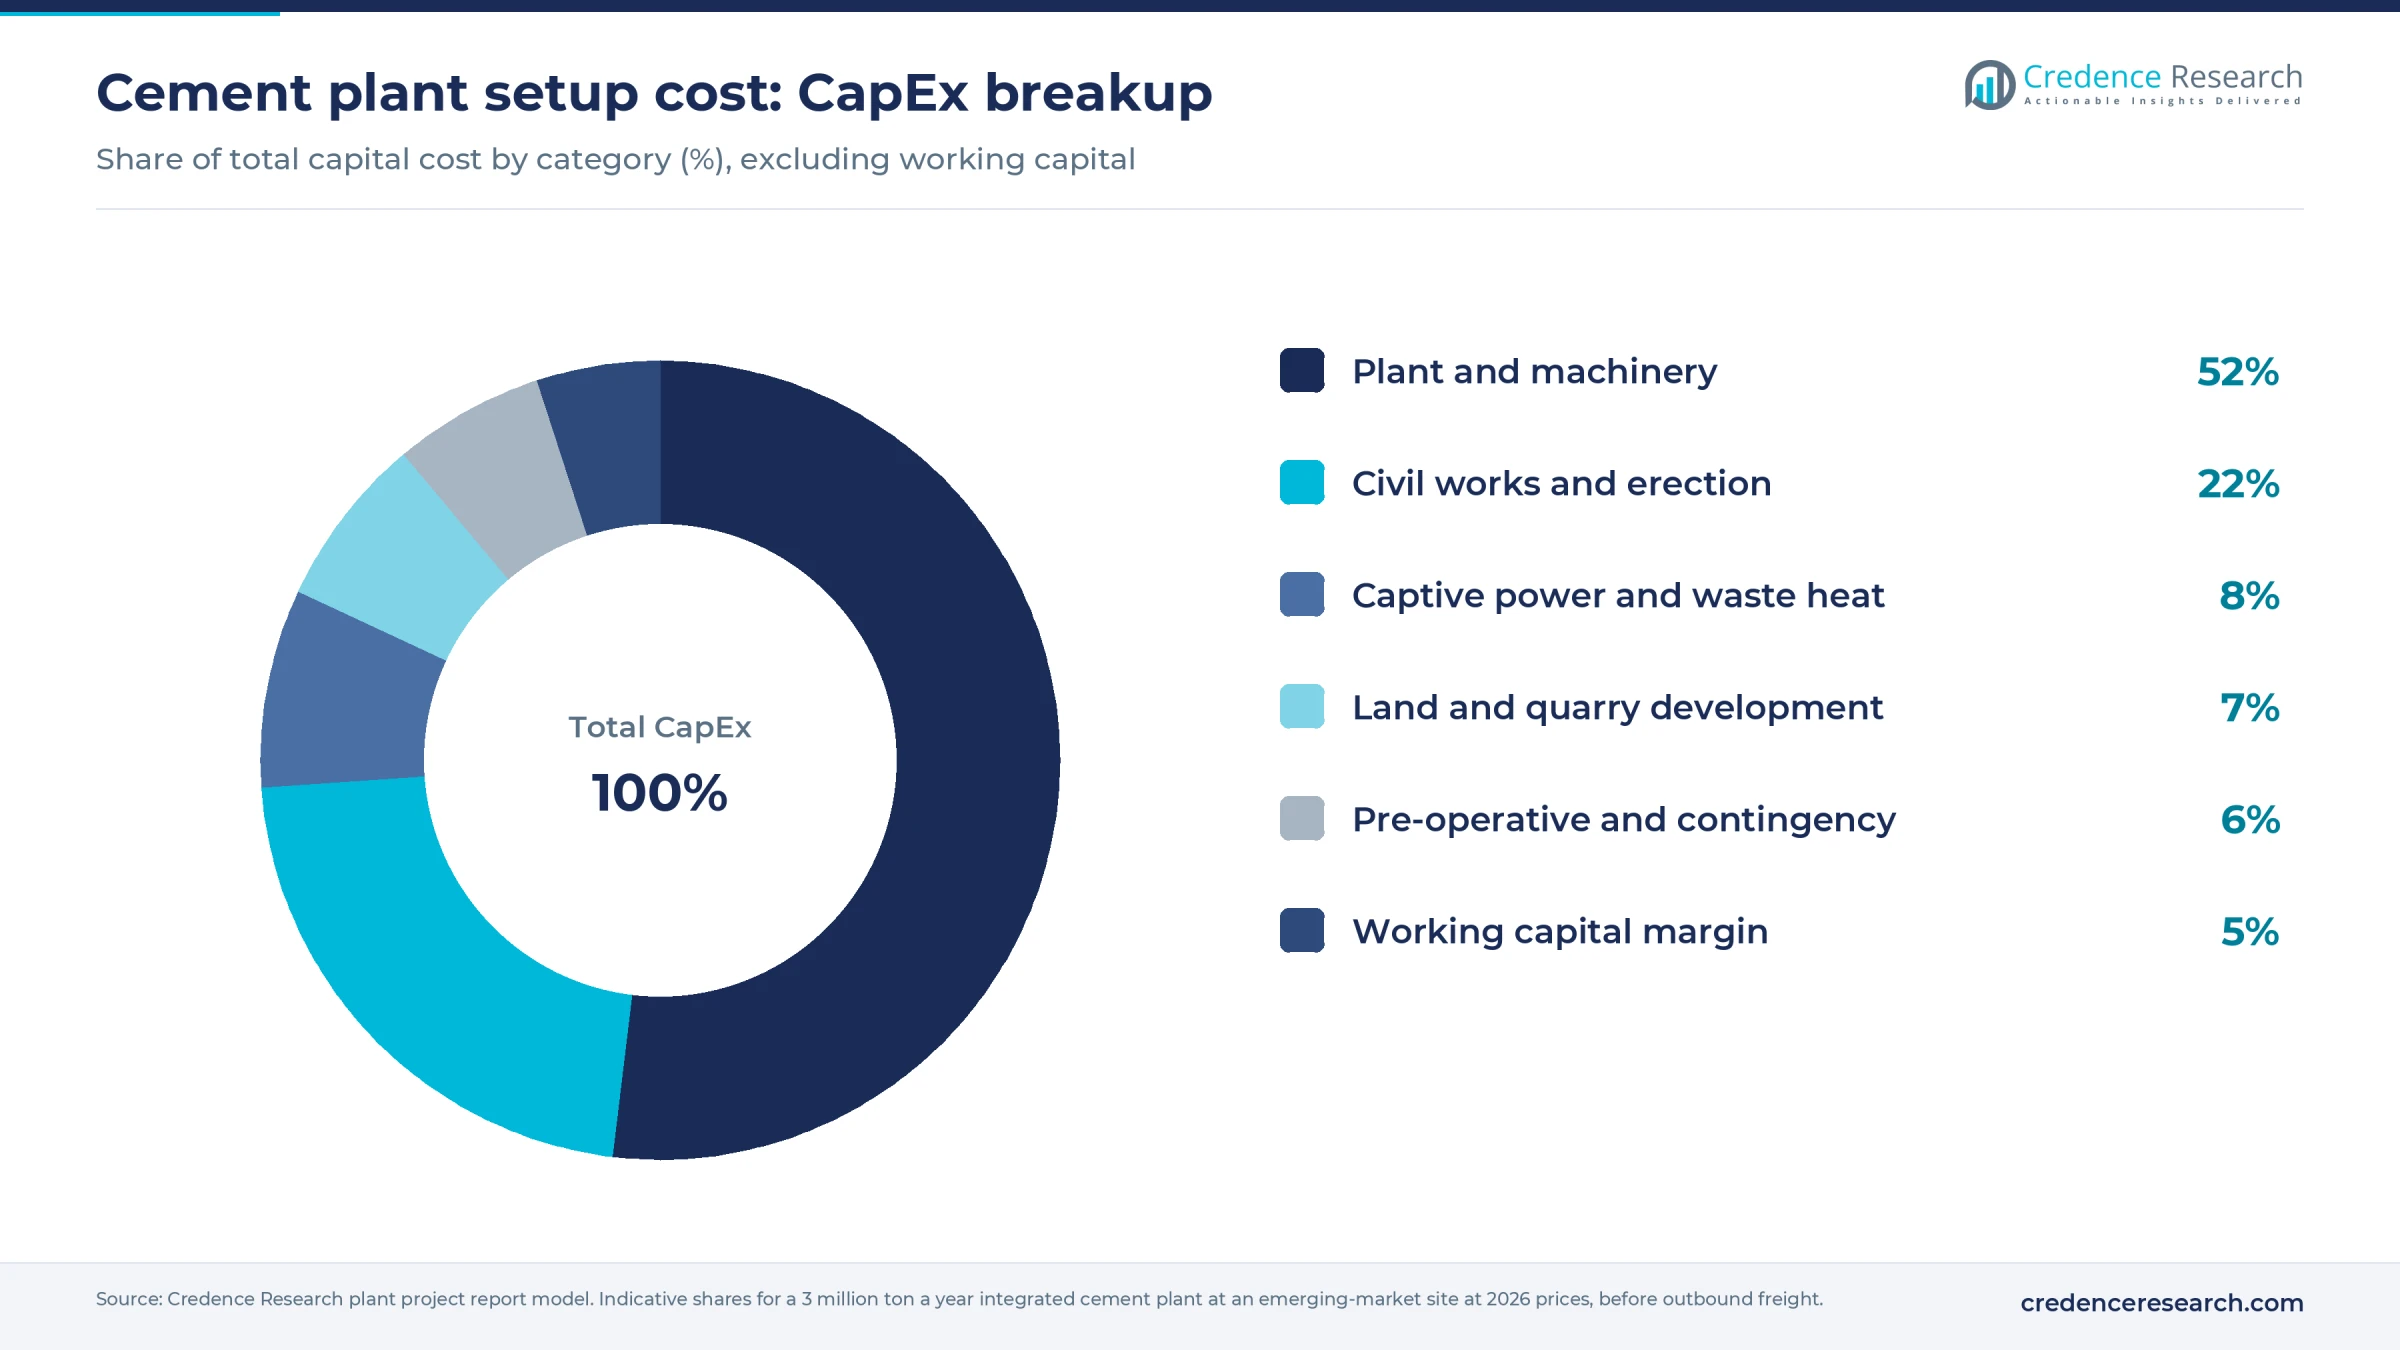
Plant and machinery make up about half of the budget, with civil works and erection next. This range assumes a granted quarry lease. Buying reserves costs extra: JSW cement paid roughly USD 54–58 million in 2022 for a company holding about 106 million tons of limestone, using 82–88 rupees per dollar.
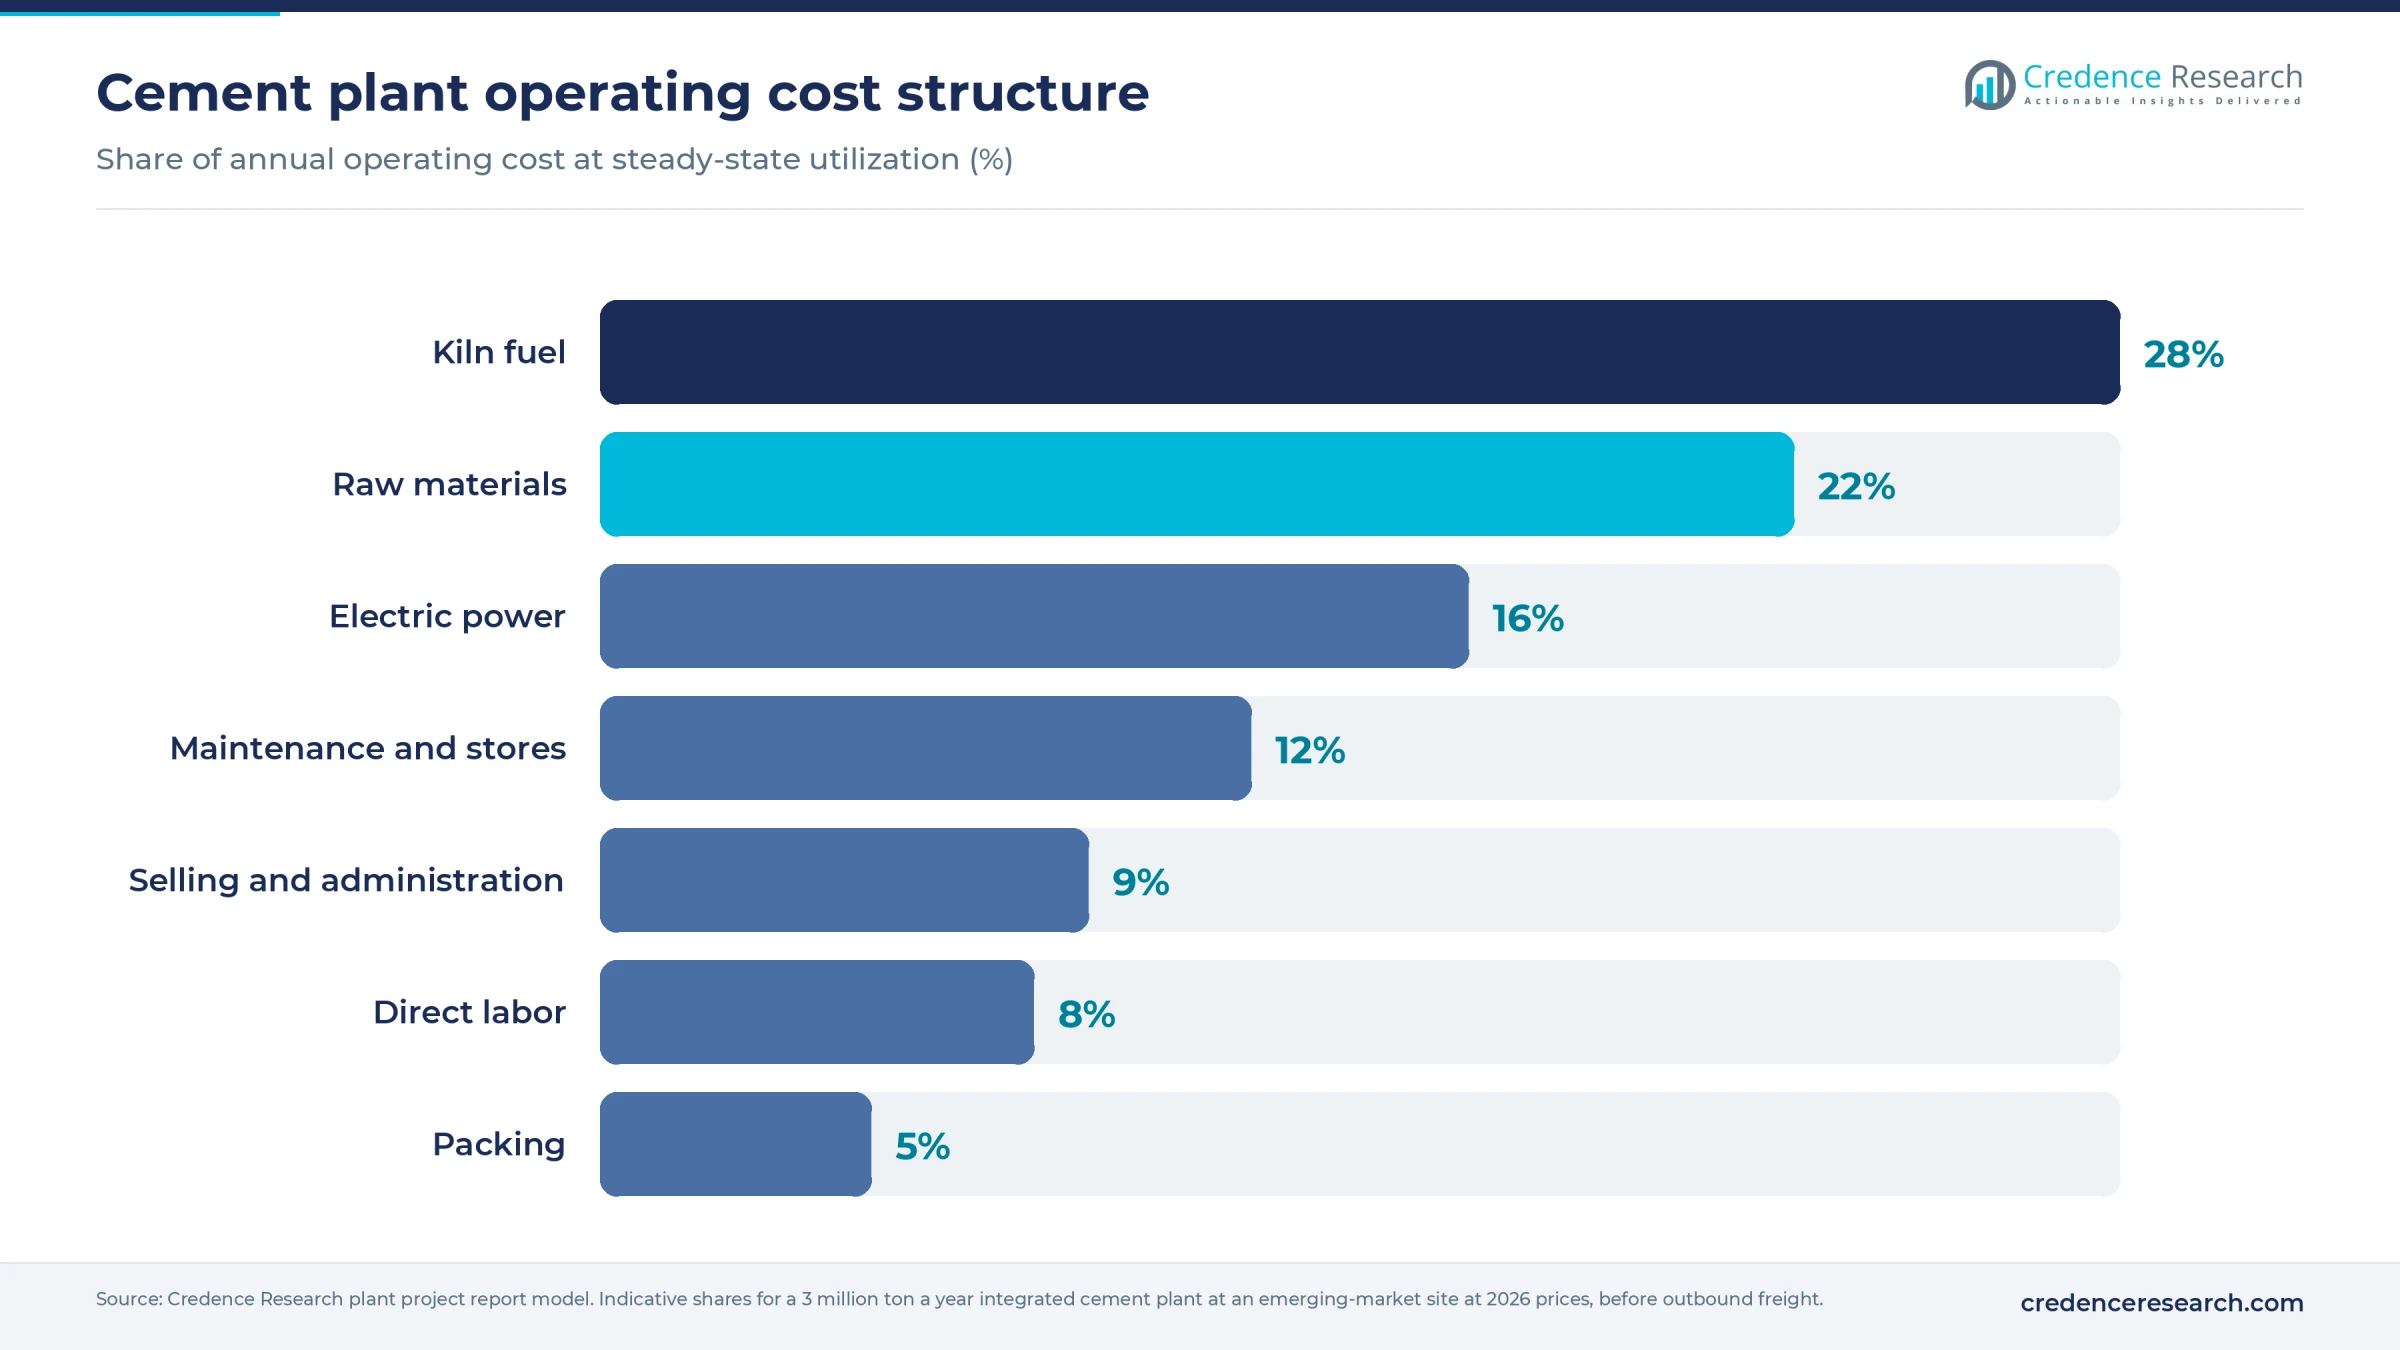
Energy dominates running costs, ahead of raw materials, which is why fuel contracts and captive power carry so much weight in the design stage.
Machinery and raw materials for a cement plant
The core equipment list runs from the quarry to the dispatch bay: drills and dumpers, primary and secondary crushers, stacker-reclaimers, overland conveyors, a vertical raw mill, blending silos, a multi-stage preheater tower with precalciner, rotary kiln, grate cooler, coal or petcoke mill, ball or vertical cement mills, bag filters, rotary packers and truck or rail loaders. A central control room, an online analyzer and a quality laboratory tie these together. Many projects add a waste heat recovery unit, solar or a captive power station where grids are weak or costly.
Limestone is the plant's anchor raw material and is nearly always quarried on or near site, so sourcing it means securing reserves rather than buying a commodity. Clay, shale, iron ore, bauxite and sand come from regional quarries.
Gypsum comes from natural deposits in countries such as Iran, Turkey, Spain, the United States and Thailand, or as a by-product of power plant flue gas treatment. Fly ash is most plentiful around coal power fleets in China and India, while slag comes from steel regions including Japan, China and Europe. Thermal coal from Indonesia, Australia and South Africa and petcoke from U.S. Gulf refiners are the main traded fuels. Shipping turns these into delivered prices that differ sharply by location.
Cement business profit margin and ROI
Margins in cement rest on local supply discipline, fuel cost and clinker factor. A plant selling at an assumed USD 60–90 per ton ex-factory earns, on assumed production costs, a gross margin of 25–35%. U.S. mill values, at about USD 160 per ton in 2025 by the USGS estimate, sit well above this band, reflecting a different cost and permitting base.
Cash profit per ton is far thinner after selling and administrative costs. Indian producers offer a real-world check: reported industry EBITDA of about 932 rupees per ton in the September 2025 quarter equals roughly USD 11 at 88 rupees per dollar, a thin-market case. At 65–80% utilization, or about 2.0–2.4 million tons sold, and assumed mid-band pricing, payback falls in a 6–11 year band on the USD 300–450 million investment. On that thin-market spread it would stretch to about 15 years, so price-war markets deserve caution.
| Metric | Value |
|---|---|
| Gross margin | 25–35% |
| Payback period | 6–11 years |
| IRR (post-tax) | Available in report |
| NPV | Available in report |
| ROI | Available in report |
| DSCR | Available in report |
Sensitivity is strongest to price and fuel: a sustained 10% rise in kiln fuel cost without a price revision trims gross margin by about 2 percentage points at mid-band pricing. A long asset life, often decades, offsets part of the slow payback.
How to start a cement business, licenses and approvals
A new plant needs business and tax registration, land use and building permits, a quarry lease or mining permit, an environmental assessment and air permit, water and waste consents, occupational safety registration, and product certification to the local cement standard. Co-firing waste fuels usually needs a separate authorization. Permitting often sets the project timeline, because kilns are major emission sources and quarries draw public comment.
| Market | Environmental and site approvals | Product and safety |
|---|---|---|
| United States | Clean Air Act construction permit and Title V operating permit through the state agency, plus EPA's NESHAP for Portland cement, 40 CFR Part 63 Subpart LLL; state quarry permits | ASTM C150 or C595 as buyers and transportation departments specify; MSHA for quarries and cement plants |
| European Union | Integrated permit under the Industrial Emissions Directive 2010/75/EU, with cement BAT conclusions; EU Emissions Trading System allowances; national quarry permits | EN 197-1 with CE marking under the Construction Products Regulation; national workplace safety rules |
| India | Environmental clearance under the EIA Notification 2006, central level for plants above 1 million tons a year; state pollution board consent under the Air and Water Acts; state mining lease | BIS license and Standard Mark under the cement Quality Control Order 2003, for standards such as IS 269 and IS 1489; factory registration |
Exporters to the EU also face carbon border reporting and certificate costs, so emissions data becomes a commercial document as well as a compliance one.
Key cement manufacturers and recent developments
The industry is led by Chinese state-linked groups and a few multinationals. Global cement's 2026 ranking lists CNBM at 530 million tons a year of capacity, Anhui Conch at 407 million, Holcim at 203 million, Heidelberg Materials at 187 million, Huaxin cement at 126 million, UltraTech at 98.5 million and Cemex at 86 million. Regional makers such as Dangote and Votorantim hold strong home markets. For new entrants, the practical rival is whichever kiln is nearest, not the global leader.
Recent developments show where capital is going:
- December 2025. Huaxin subsidiary Portland cement Malawi commissioned a 2,000 tons-per-day clinker plant in Balaka, an investment of about USD 100 million.
- March 2026. Holcim signed an agreement to buy Cemex's building materials operations in Colombia.
- July 2026. Dalmia Bharat laid the foundation stone of an integrated unit at Kadapa, Andhra Pradesh, planned by company officials at 6.1 million tons of clinker and 9.6 million tons of cement a year.
What's inside the Cement project report PDF
The report runs to 21 chapters. Open a chapter to see its sections.
1. Preface
2. Scope and Methodology
- 2.1 Objectives of the Study
- 2.2 Stakeholders
- 2.3 Research Methodology
- 2.4 Data Sources and Key Assumptions
3. Executive Summary
- 3.1 Market Snapshot
- 3.2 Project at a Glance (Capacity, CapEx, OpEx)
- 3.3 Key Financial Indicators (IRR, NPV, Payback, Break-even)
- 3.4 Feasibility Verdict
4. Product Overview
- 4.1 Cement Definition and Properties
- 4.2 Grades and Specifications (BIS / ISO / ASTM)
- 4.3 HS Code and Classification
- 4.4 Key Applications
- 4.5 Substitutes
5. Global Cement Market
- 5.1 Market Overview
- 5.2 Historical and Current Market Performance (Volume and Value)
- 5.3 Market Breakup by Grade / Type
- 5.4 Market Breakup by End-Use Industry
- 5.5 Market Breakup by Region
- 5.6 Market Drivers, Restraints and Trends
- 5.7 Value Chain Analysis
- 5.8 Market Forecast
6. Target Country Cement Market Analysis
- 6.1 Demand and Supply Analysis
- 6.2 Installed Capacity vs Demand Gap
- 6.3 Import Dependence
- 6.4 Demand Forecast by End-Use
7. Trade Analysis
- 7.1 Imports by Volume, Value and Country
- 7.2 Exports by Volume, Value and Country
- 7.3 Trade Balance and Opportunities
8. Price Analysis
- 8.1 Historical Cement Price Trends by Region
- 8.2 Raw Material / Feedstock Price Trends and Linkage
- 8.3 Price Forecast
- 8.4 Margins Across the Value Chain
9. Competitive Landscape
- 9.1 Market Structure
- 9.2 Key Players and Installed Capacities
- 9.3 Profiles of Key Players
- 9.4 Recent Developments (Expansions, M&A, New Plants)
10. Manufacturing Process and Technology
- 10.1 Comparison of Technology Routes
- 10.2 Selected Route and Process Flow Diagram
- 10.3 Unit Operations Involved
- 10.4 Chemical Reactions Involved
- 10.5 Mass Balance and Raw Material Requirements
- 10.6 Energy Balance
- 10.7 Quality Assurance Criteria and Technical Tests
- 10.8 By-products and Waste Handling
- 10.9 Technology Licensors / Providers
11. Project Details, Requirements and Costs
- 11.1 Land, Location and Site Development
- 11.1.1 Site Selection Criteria
- 11.1.2 Location Analysis
- 11.1.3 Land Requirement and Costs
- 11.1.4 Site Development Costs
- 11.2 Plant Layout
- 11.2.1 Layout Principles
- 11.2.2 Proposed Layout
- 11.2.3 Factors Influencing Layout
- 11.3 Civil Works and Buildings
- 11.4 Plant Machinery
- 11.4.1 Machinery Requirements and Specifications
- 11.4.2 Machinery Costs
- 11.4.3 Machinery Suppliers
- 11.5 Raw Materials
- 11.5.1 Requirements per Tonne of Output
- 11.5.2 Procurement and Sourcing
- 11.5.3 Costs
- 11.5.4 Suppliers
- 11.6 Packaging
- 11.6.1 Packaging Requirements
- 11.6.2 Packaging Costs
- 11.6.3 Packaging Suppliers
- 11.7 Storage and Material Handling
- 11.8 Transportation Requirements and Costs
- 11.9 Utilities
- 11.9.1 Power Requirements and Costs
- 11.9.2 Water Requirements and Costs
- 11.9.3 Steam, Fuel and Other Utilities
- 11.10 Manpower Requirements and Wages
12. Environment, Health, Safety and Sustainability
- 12.1 Effluent and Emissions Management
- 12.2 Hazard Classification and Safety Measures
- 12.3 Carbon Footprint
- 12.4 Green / Low-Carbon Process Options
13. Regulatory Procedures, Approvals and Certifications
- 13.1 Licences and Registrations
- 13.2 Environmental Clearances
- 13.3 Product Certifications (BIS, REACH, etc.)
- 13.4 Approval Timeline
14. Project Implementation Schedule
15. Project Economics
- 15.1 Capital Cost of the Project
- 15.2 Techno-Economic Parameters
- 15.3 Capacity Utilization and Ramp-up
- 15.4 Product Pricing and Margins
- 15.5 Income Projections
- 15.6 Expenditure Projections
- 15.7 Working Capital Requirement
- 15.8 Taxation
- 15.9 Depreciation
16. Financial Analysis
- 16.1 Projected Profit and Loss Account
- 16.2 Projected Cash Flow Statement
- 16.3 Projected Balance Sheet
- 16.4 Liquidity Analysis
- 16.5 Profitability Analysis (Payback, NPV, IRR, ROI)
- 16.6 Break-even Analysis
- 16.7 Debt Service Coverage Ratio (DSCR)
- 16.8 Sensitivity Analysis
- 16.9 Scenario and Uncertainty Analysis
17. Funding and Incentives
- 17.1 Means of Finance and Debt-Equity Structure
- 17.2 Loans and Financial Assistance
- 17.3 Government Schemes and Subsidies (PLI, State Policies)
18. Risk Assessment
- 18.1 Key Success Factors
- 18.2 Key Risk Factors
- 18.3 Risk Mitigation
19. Strategic Recommendations
20. Case Study of a Successful Venture
21. Appendix
- 21.1 Detailed Assumptions
- 21.2 Abbreviations
- 21.3 List of Tables and Figures
- 21.4 Sources
This page vs. the full report
| Data point | On this page (free) | In the full report |
|---|---|---|
| Total CapEx | One rounded range at one capacity | Exact figure at three capacities with a line-item breakup |
| CapEx breakup | Category shares (%) only | Cost, quantity and supplier for every machine |
| Operating cost | Share of raw materials, utilities and labor | Per-unit cost sheet with each input price and consumption |
| Profitability | Gross margin range and payback band | Exact IRR, NPV, ROI, break-even and DSCR |
| Financial statements | List of what is included | 10-year P&L, cash flow, balance sheet and Excel model |
| Sensitivity | One directional line | Full sensitivity and scenario tables |
| Process | Simplified flow diagram | Detailed process flow, mass and energy balance, operating conditions |
| Machinery | Names of the main machines | Specifications, capacity, cost and supplier list |
| Market | Headline size, growth and India demand trend | Segment, region, trade and price forecast tables |
| Suppliers and buyers | Supplier types and sourcing hubs | Named suppliers and buyers |
Cement project report: FAQs
How much does it cost to set up a cement plant?
What is the profit margin in cement manufacturing?
What is the payback period for a cement plant?
What raw materials are needed to make cement?
What is the HS code for cement?
What licenses does a cement plant need?
Is a grinding unit cheaper than an integrated cement plant?

About the analyst
Nisha Gupta, Senior Research Analyst
Nisha Gupta is a Senior Research Analyst at Credence Research Inc. who works across industry domains, including packaging, automotive parts and machinery. Her focus is the modelling engine behind each study: she builds quantitative market databases and econometric forecasting frameworks, and developed automated Excel-based market modelling templates that cut client turnaround time by 30%.
Related market research
- Portland Cement Market Size, Share, Growth and Forecast 2032
- Ready Mix Concrete Market Size, Trends and Forecast 2032
- Concrete Batch Plants Market Size, Share. Growth and Forecast 2032
- Asia-Pacific Precast Concrete Market Size, Share, Growth and Forecast, 2025-2035
- Self-Compacting Concrete Market Size, Growth and Forecast 2032
- Rapid Strength Concrete Market Size, Share and Growth Report 2032
More plant project reports
- Shrimp Processing Plant Project Report (DPR) 2026
- Instant Coffee Manufacturing Plant Project Report (DPR) 2026
- LED Light Manufacturing Plant Project Report (DPR) 2026
- Rare Earth Magnet Manufacturing Plant Project Report (DPR) 2026
- PET Bottle Manufacturing Plant Project Report (DPR) 2026
- Pectin Manufacturing Plant Project Report (DPR) 2026