
Therapy doses lift radioisotope value through 2035
The radioisotope market was valued at USD 6.15 billion in 2025 and is projected to increase from USD 6.67 billion in 2026 to USD 13.78 billion by 2035, registering a CAGR of 8.40% during 2025–2035. Demand rests on three forces, as radioligand cancer therapies need several high-value lutetium-177 doses per patient, SPECT and PET imaging grows steadily, and governments fund new molybdenum-99 supply after repeated reactor outages, including the 2024 shutdown of the HFR reactor in the Netherlands. North America held the largest regional share, 41.2% in 2025, led by U.S. adoption of lutetium-177 therapy and PSMA PET, while Asia Pacific is the fastest-growing region at 10.56% a year. The main commercial change is consolidation from target to patient. Curium signed an agreement in August 2026 to acquire Lantheus, after SHINE Technologies bought the Lantheus SPECT business in January 2026.
How do isotopes move from reactor to patient?
Supply runs through three steps, in which research reactors, power reactors, cyclotrons and accelerators irradiate targets; processors extract isotopes such as molybdenum-99 and lutetium-177; and radiopharmaceutical companies and nuclear pharmacies turn them into generators, tracers and unit doses delivered to hospitals each morning. Short half-lives mean most products cannot be stockpiled, so supply must match daily demand. Sealed sources such as cobalt-60 and iridium-192 follow a separate industrial route for sterilization, radiography and gauging.
The market includes molybdenum-99/technetium-99m generators and kits, cyclotron-made fluorine-18 and generator-made gallium-68, therapy isotopes including lutetium-177, iodine-131 and actinium-225, and industrial sealed sources, sold by radiopharmaceutical suppliers and isotope producers. It excludes stable isotopes and enriched targets sold before irradiation, scanners, cyclotrons and hot cells, nuclear power fuel and isotopes used only for weapons work.
Radioisotope Market Insights
- The radioisotope market is projected to grow from USD 6.67 billion in 2026 to USD 13.78 billion by 2035, an 8.40% CAGR, as therapy isotopes add value faster than imaging volumes.
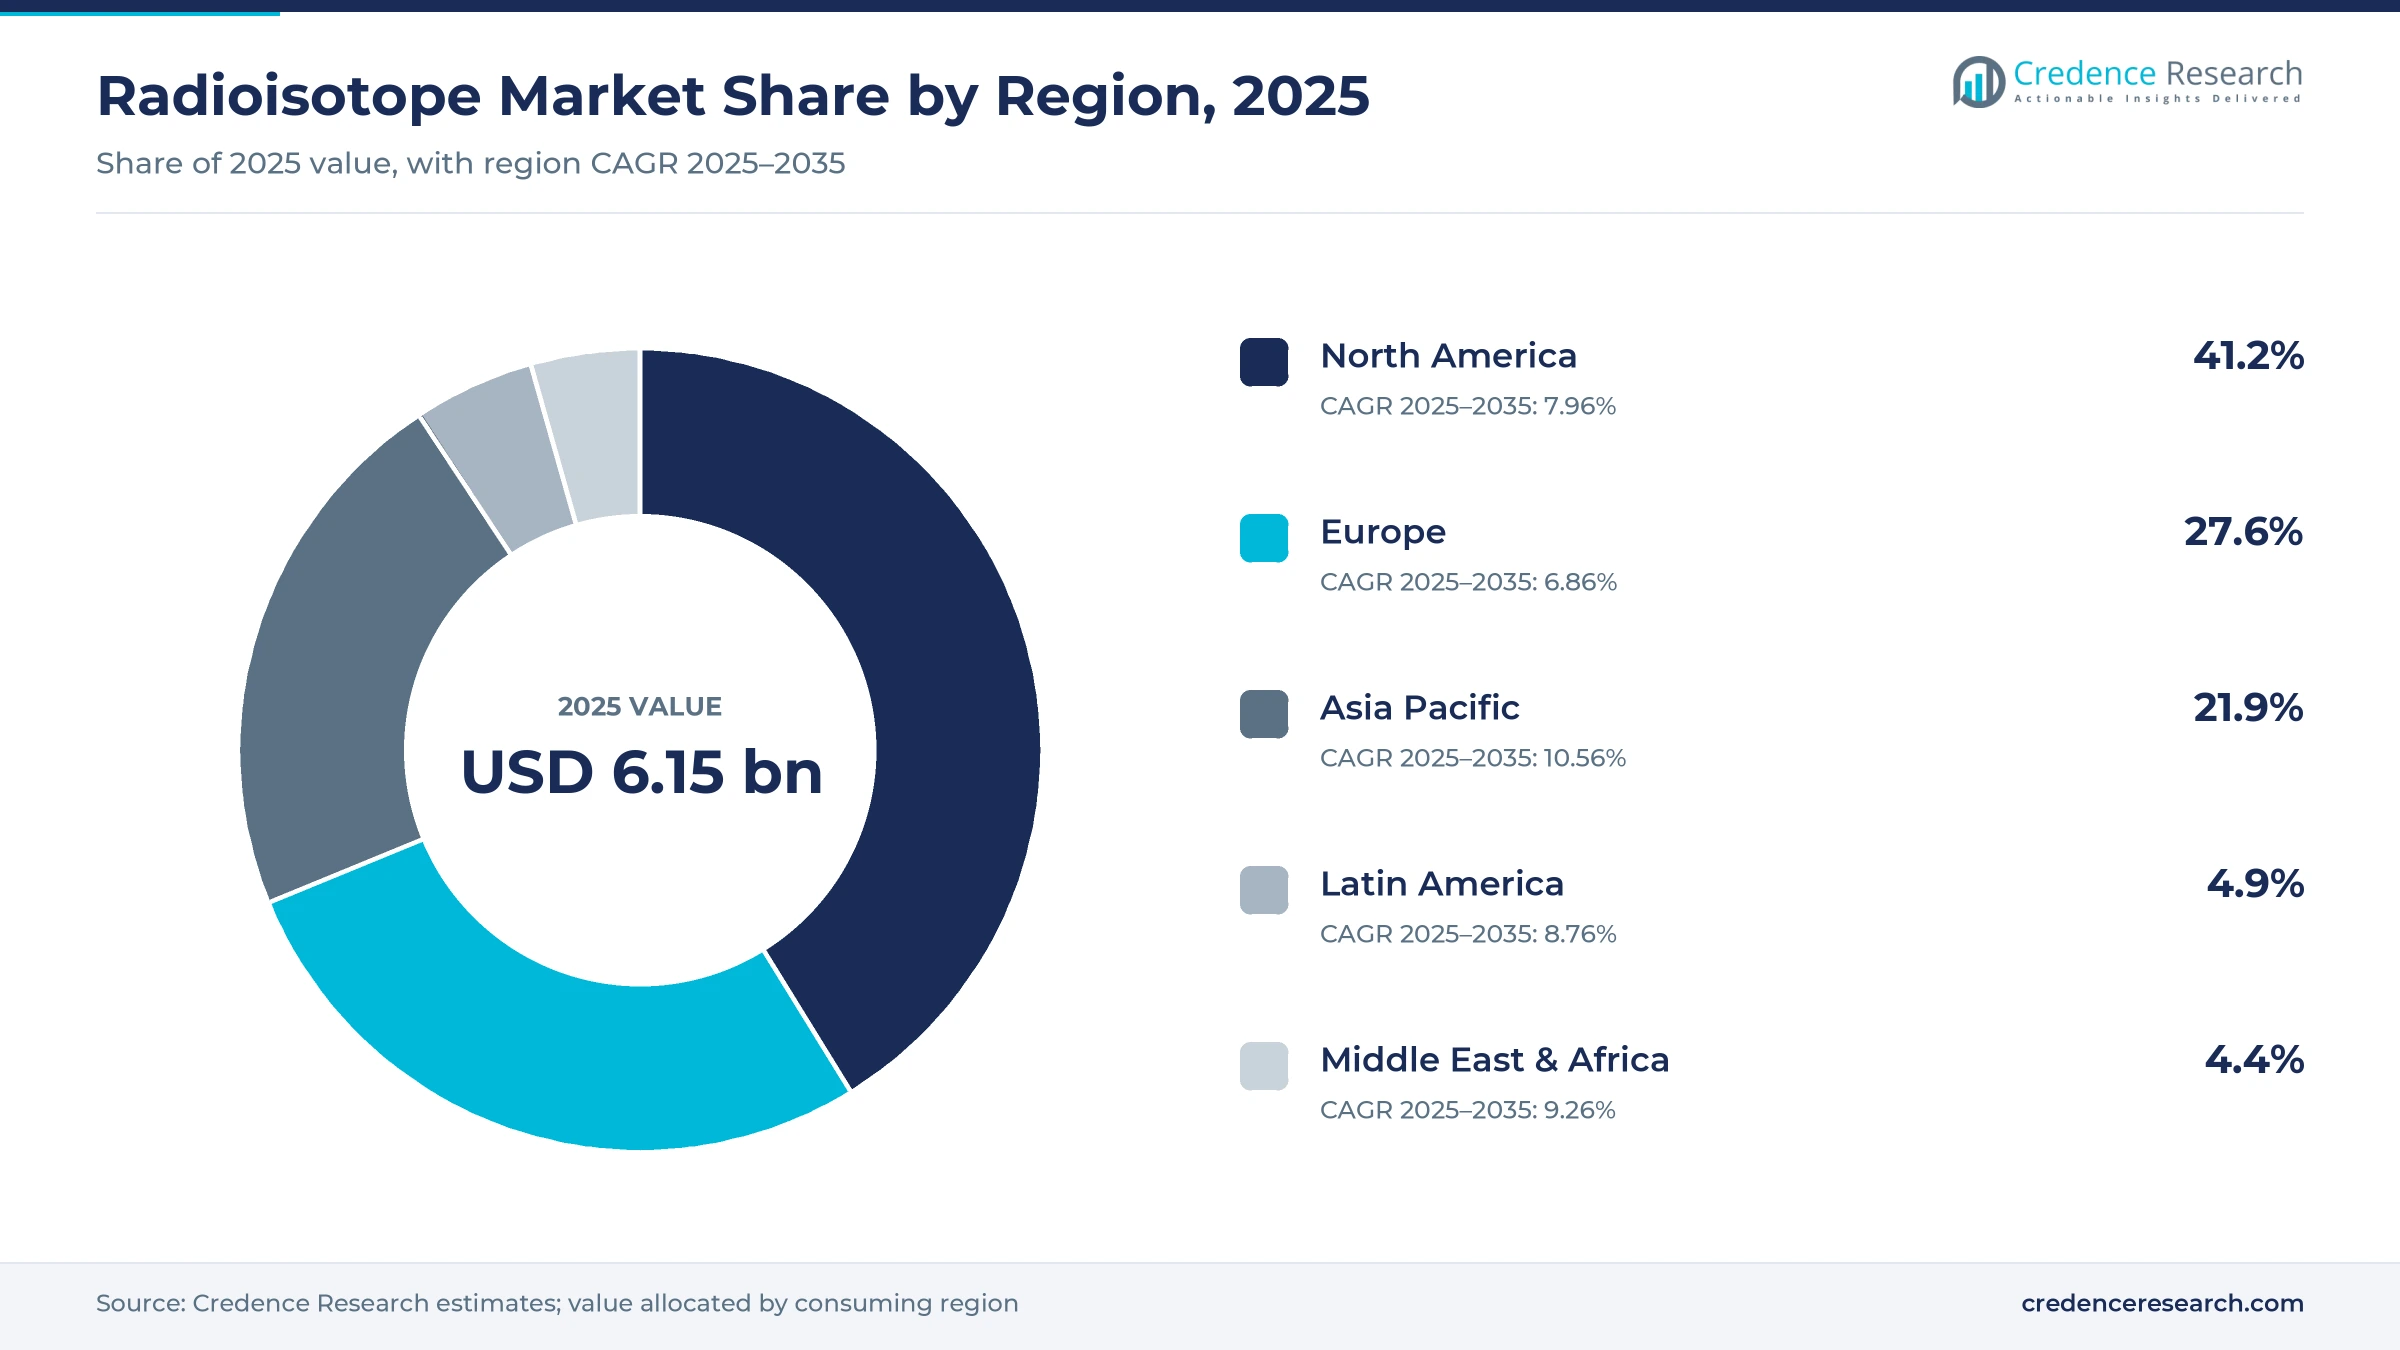
- North America held 41.2% of 2025 value, the largest regional share, because the U.S. leads adoption of lutetium-177 therapy and PSMA PET imaging.
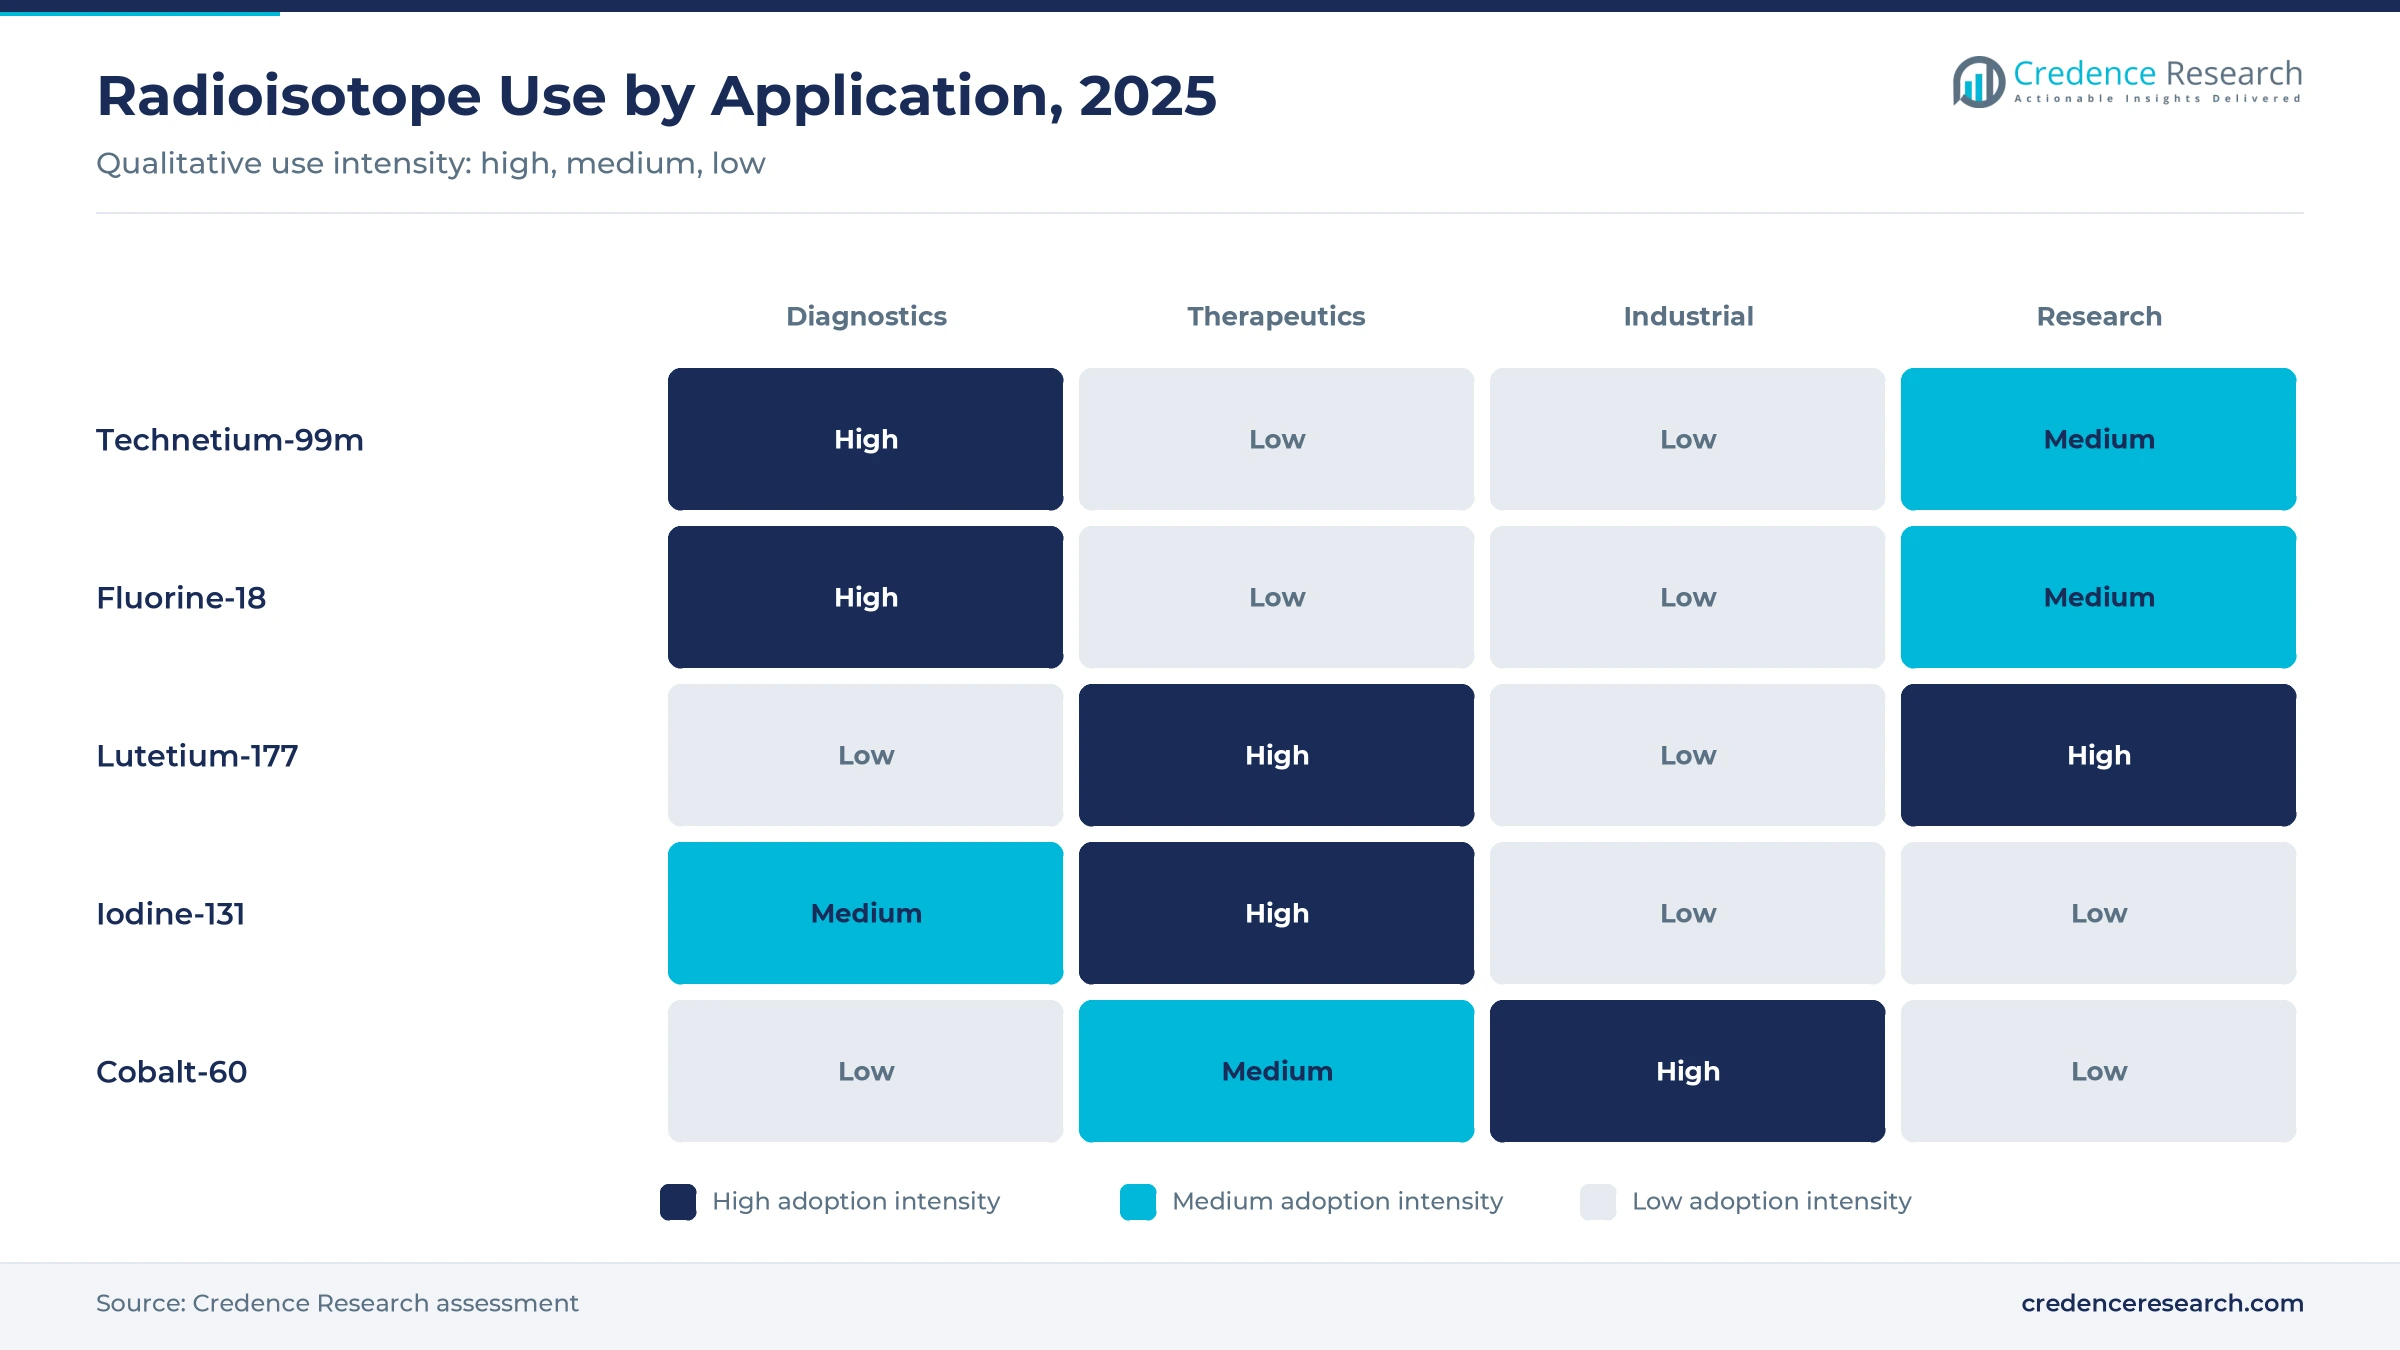
- Technetium-99m accounted for 31.6% of 2025 value, the largest isotope, because it is used in 80% to 85% of nuclear medicine procedures.
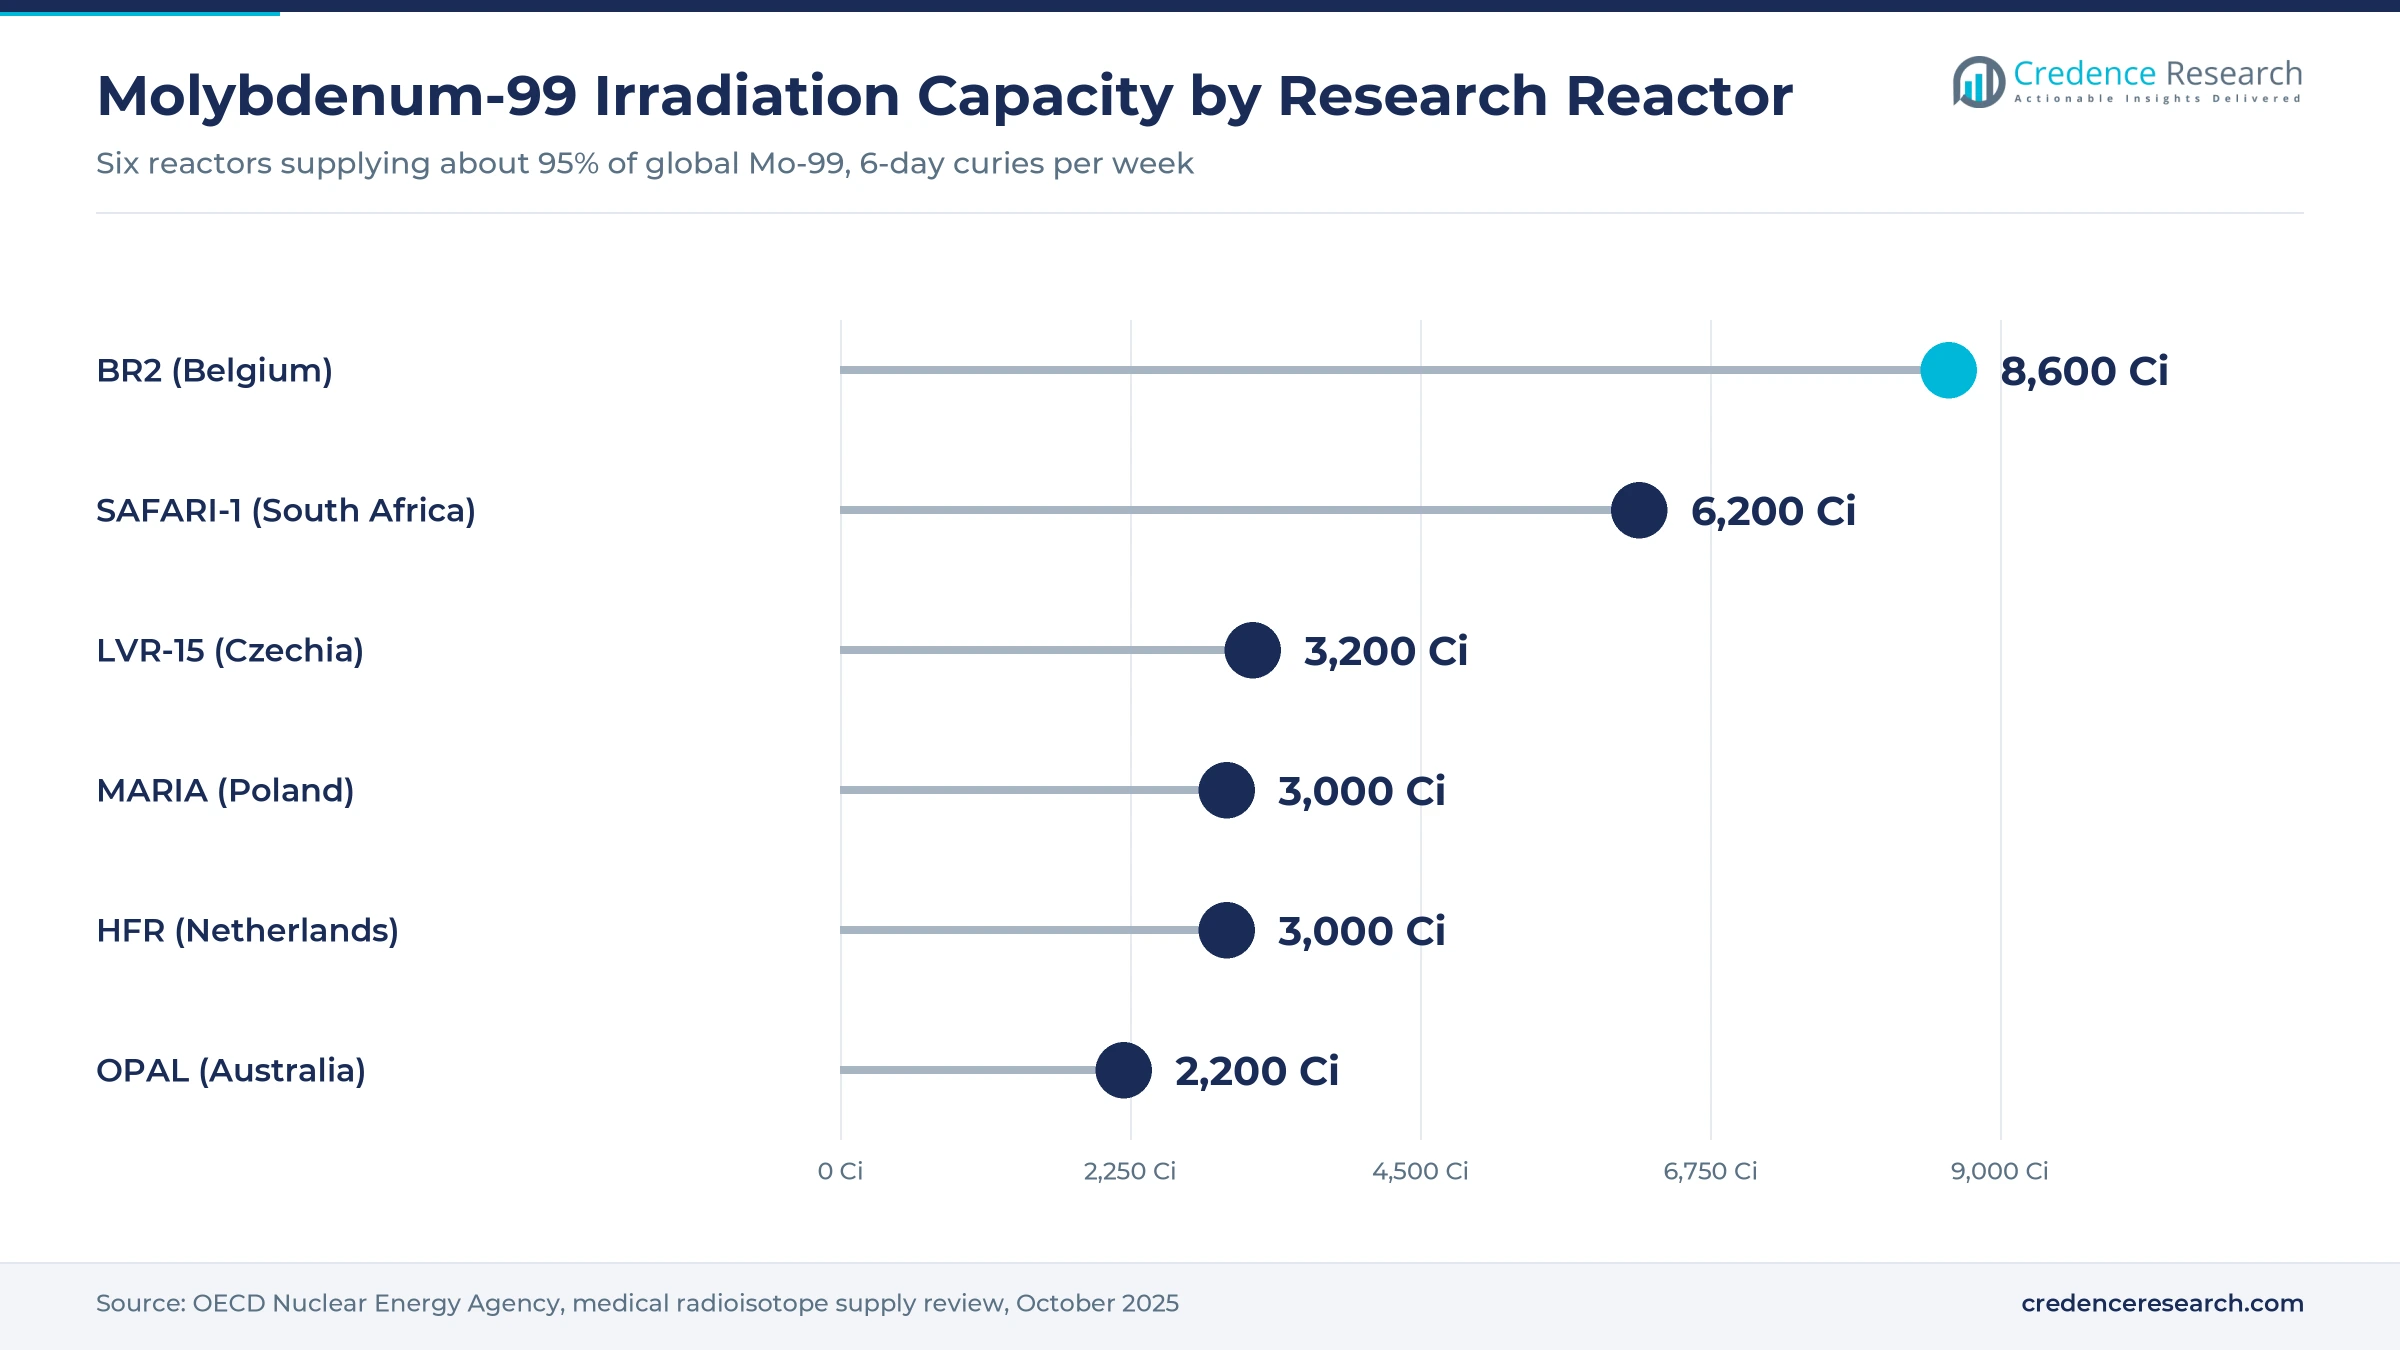
- Six research reactors supplied about 95% of the world's molybdenum-99 in 2025, so governments now fund accelerator and reactor projects to secure domestic supply.
- Curium's August 2026 agreement to acquire Lantheus and SHINE's January 2026 purchase of the Lantheus SPECT business concentrate supply from target to patient.
Technetium-99m holds volume while lutetium-177 adds growth
Technetium-99m leads by isotope type while lutetium-177 grows fastest
Based on type of isotope, the market is categorized into technetium-99m, fluorine-18, lutetium-177, iodine-131 and other isotopes. Technetium-99m led with 31.6% of 2025 value, because hospitals elute it daily from molybdenum-99 generators for heart, bone, kidney and thyroid scans. Lutetium-177 grows fastest at 17.15% a year, as approved prostate and neuroendocrine cancer therapies need several cycles per patient and new indications keep adding treated patients.
Diagnostics lead applications while therapeutics grow fastest
Based on application, the market is categorized into diagnostics, therapeutics, industrial applications and research. Diagnostics led with 57.9% of 2025 value, because SPECT and PET scans run at high volume in every nuclear medicine department. Therapeutics grows fastest at 15.00% a year, as radioligand therapies turn the isotope into the active part of a cancer drug, which favors producers with qualified therapy-grade supply.
Hospitals lead end users while research institutions grow fastest
Based on end user, the market is categorized into hospitals and clinics, research institutions and industrial sectors. Hospitals and clinics led with 77.6% of 2025 value, buying generators, tracers and unit doses directly or through central radiopharmacies. Research institutions grow fastest at 9.14% a year, as alpha-emitter and new-target trials scale up and sponsors secure qualified actinium-225 and lutetium-177 for clinical studies.
| Segment Group | Leading Sub-segment | Share, 2025 | Fastest-growing Sub-segment | CAGR, 2025–2035 |
|---|---|---|---|---|
| By Type of Isotope | Technetium-99m (Tc-99m) | 31.6% | Lutetium-177 | 17.15% |
| By Application | Diagnostics | 57.9% | Therapeutics | 15.00% |
| By End-User | Hospitals and Clinics | 77.6% | Research Institutions | 9.14% |
Request a Free Sample
Fill in your details and we'll send you a free sample report.
- Sample data tables & charts
- Research methodology
Radioligand approvals and supply funding lift isotope demand
Radioligand therapy approvals widen the paying patient pool
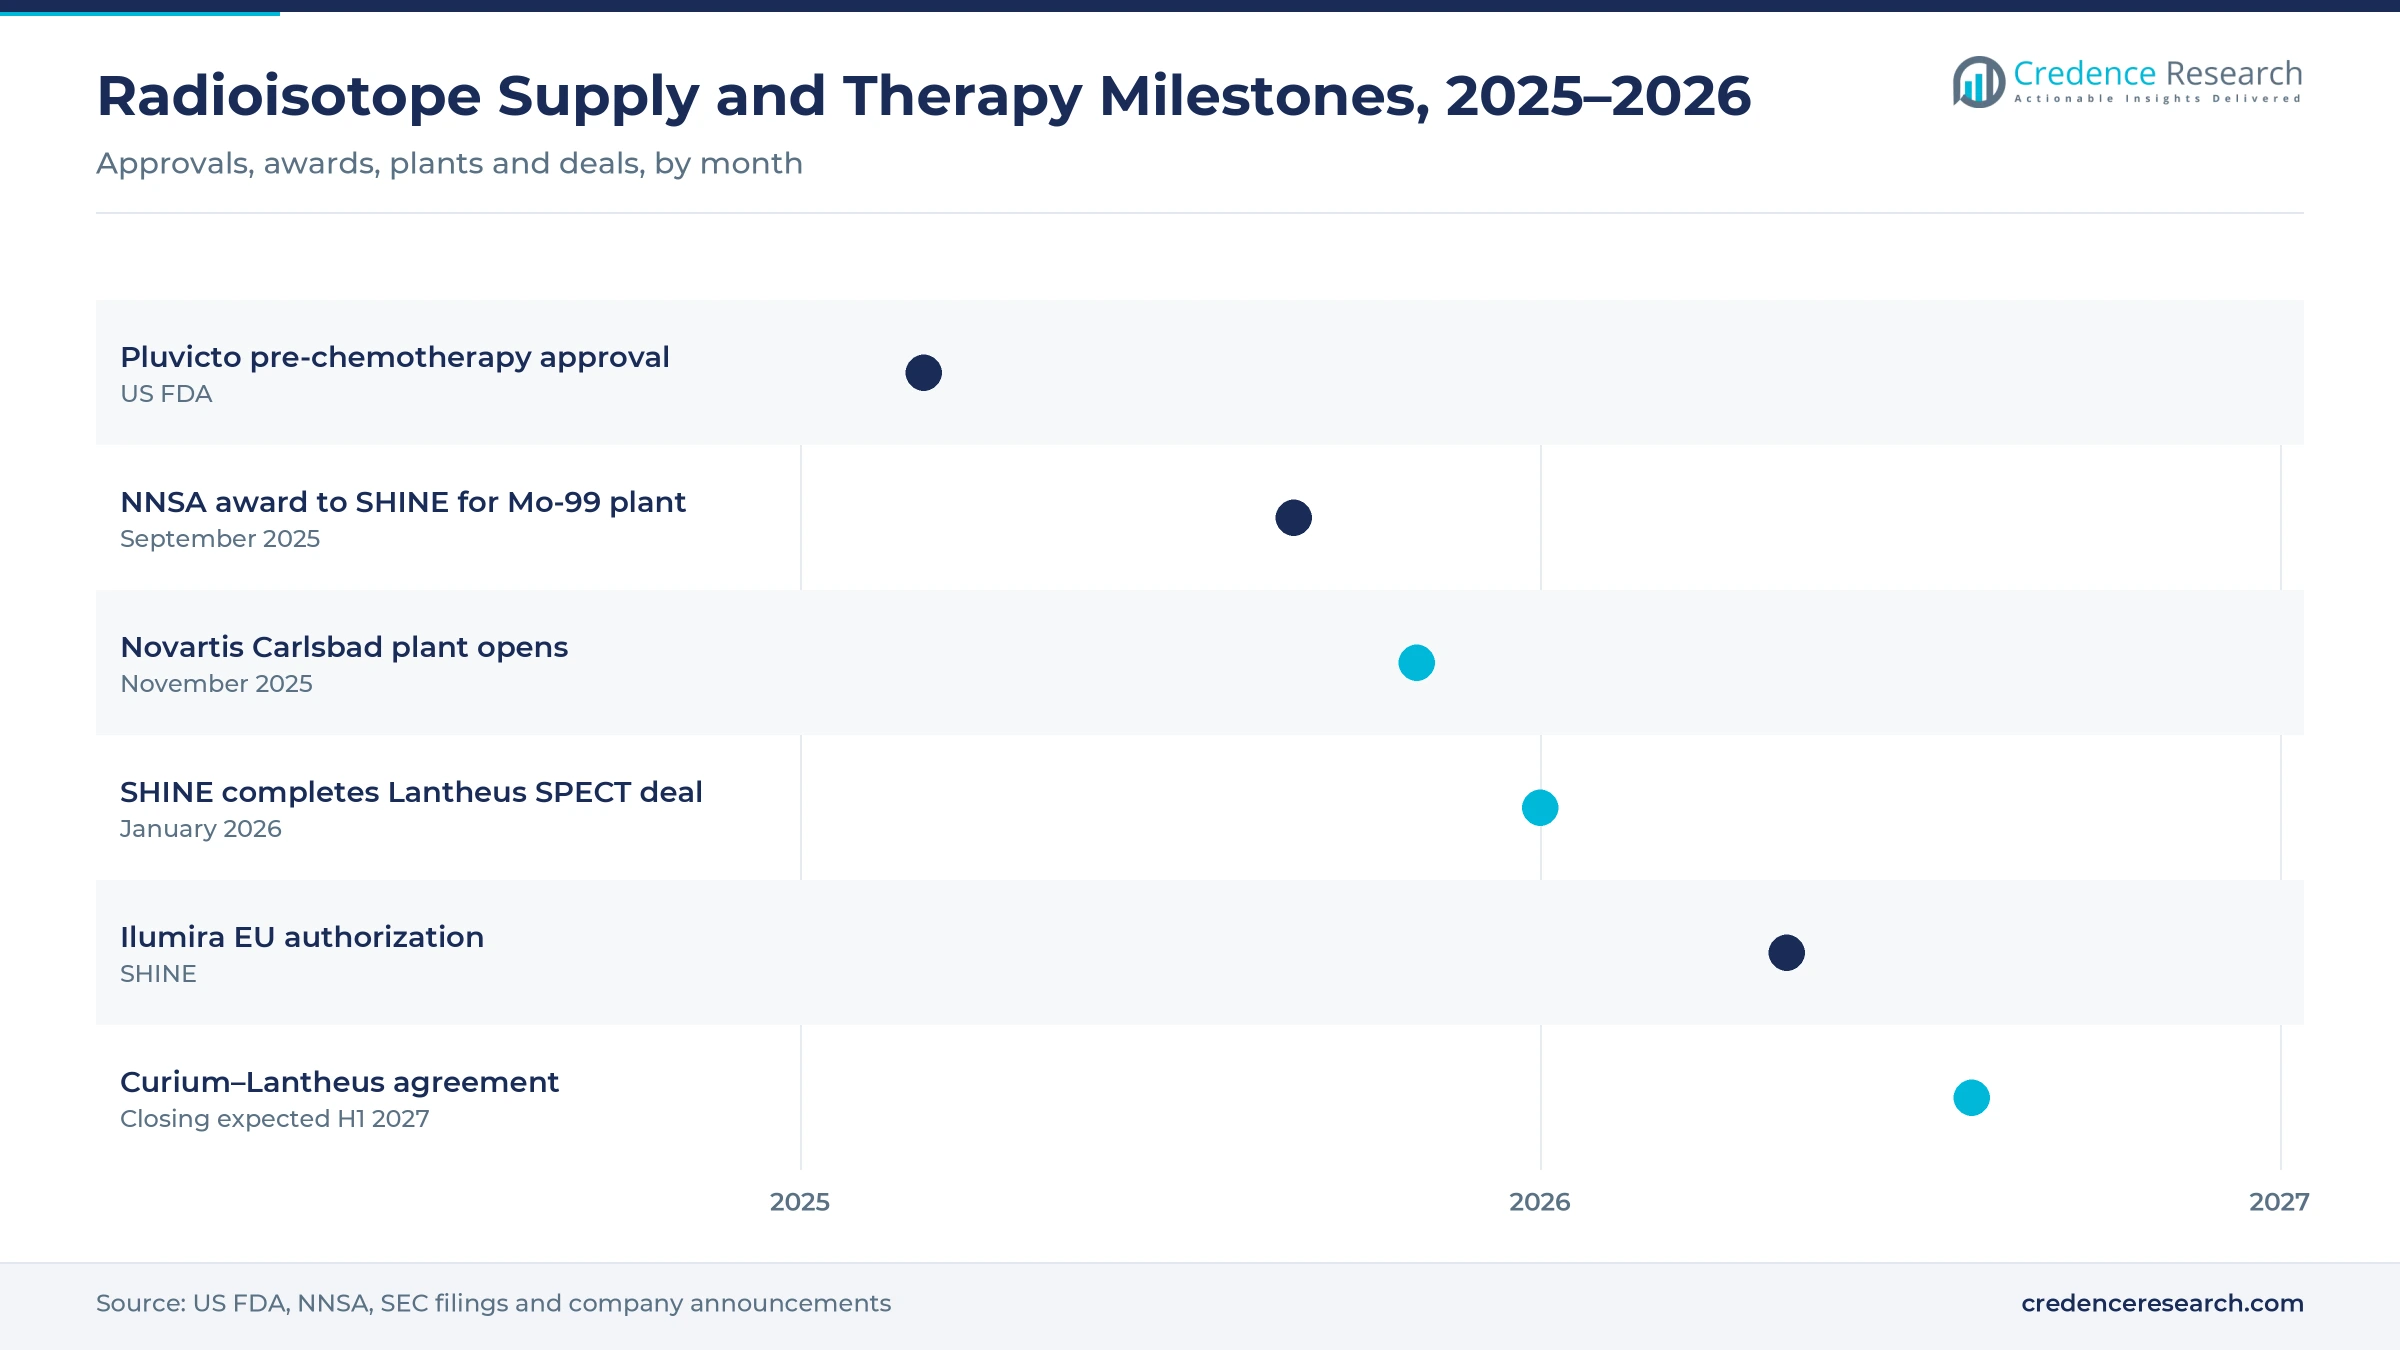
Lutetium-177 compounds bind to tumor cells that carry a target receptor and deliver radiation from inside, and each of several cycles per patient needs a fresh, short-lived batch. In March 2025, the FDA cleared Pluvicto for PSMA-positive metastatic castration-resistant prostate cancer before chemotherapy, which Novartis said roughly triples the eligible population. Oncology centers in the U.S. and Europe drive this demand through 2035, as approved prostate and neuroendocrine cancer therapies win new indications that keep adding treated patients.
Imaging volumes keep a large technetium-99m and PET base
Technetium-99m is used in 80% to 85% of nuclear medicine procedures, according to the OECD Nuclear Energy Agency. The U.S. alone performs tens of thousands of technetium-99m procedures every day and has relied entirely on imports of molybdenum-99 for decades, according to the National Nuclear Security Administration. Aging populations add heart, bone and cancer scans each year, and every therapy patient needs a PSMA or somatostatin-receptor PET scan first, lifting fluorine-18 and gallium-68 demand alongside PET scanner access.
Governments fund molybdenum-99 supply after repeated outages
Six research reactors supply about 95% of the world's molybdenum-99, and 5 of them first operated between 1957 and 1974. When the HFR reactor in the Netherlands shut down in October 2024, shortages followed across several continents. In September 2025, the NNSA selected SHINE Technologies to finish its plant in Janesville, Wisconsin and since January 2026, Medicare has paid a per-dose add-on for technetium-99m made from domestic, non-HEU molybdenum-99. Beyond the U.S., Argentina, Brazil, China and Japan are building capacity too, which should reduce the risk of the shortages that followed the HFR shutdown.
Accelerators and power reactors open new production routes
New production routes now reduce dependence on old research reactors. NorthStar makes actinium-225 by electron accelerator in Beloit, Wisconsin, SHINE makes non-carrier-added lutetium-177 at its Cassiopeia plant, and Bruce Power in Canada has doubled its lutetium-177 output capacity since 2022, according to the NEA. More qualified sources let drug developers sign multiyear contracts with two suppliers, which supports research institutions and lowers supply risk for therapy launches.
Producer takeovers and alpha emitters reshape isotope supply
Isotope producers shift into finished drugs
Producers that once sold bulk isotope now want the margin on the final dose. Curium signed a definitive agreement on 3 August 2026 to acquire Lantheus, according to a filing with the U.S. Securities and Exchange Commission, with closing expected in the first half of 2027. SHINE completed its purchase of the Lantheus SPECT business on 2 January 2026, taking over the TechneLite generator, and BWXT agreed to sell its medical isotope unit to Nordic Capital. As a result, fewer, larger groups will control more of the chain.
Imaging and therapy are planned and sold as pairs
A PET scan selects the patient and a therapy isotope treats them. Fluorine-18 or gallium-68 tracers confirm that a tumor carries the target, and lutetium-177 or actinium-225 agents follow. Hospitals now add shielded therapy rooms next to PET suites, and Novartis opened its third U.S. radioligand therapy plant, in Carlsbad, California, in November 2025, with sites planned in Florida and Texas. Regional medical cyclotron sites put more value within a few hours of the patient.
Alpha emitters and second-source therapy isotopes open an opportunity
Drug developers are moving toward alpha emitters such as actinium-225, which deposit more energy over a shorter path. NorthStar reported routine commercial-scale actinium-225 production in January 2026, and the FDA accepted its drug master file in April 2026. SHINE received EU authorization for its Ilumira lutetium-177 precursor in May 2026, and Eckert & Ziegler is expanding actinium output in Germany and the Czech Republic. That matters because trial sponsors want 2 independent sources before they file.
Domestic molybdenum-99 and underserved therapy networks offer an opportunity
Japan aims to cover about 30% of its molybdenum-99 demand from domestic production by the end of fiscal 2027. Argentina's RA-10 reactor is about 96% complete and is designed to meet about 20% of global demand, and Brazil's RMB reactor targets self-sufficiency from 2031. Gulf states, India and parts of Latin America are opening cancer centers without local dose production, where suppliers that partner early gain a position.
Aging reactors and manufacturing scrutiny cap supply growth
Aging research reactors leave no buffer against outages
Molybdenum-99 has a 66-hour half-life and loses about 1% of its activity every hour, so no stockpile can bridge an outage. Most reactors that irradiate it are more than 50 years old, and the European Commission's SAMIRA action plan says research reactors will need major refurbishment or replacement by 2030. PALLAS in Petten started construction in September 2025 but is not due to run commercially until 2032. Hospitals face cancelled scans; accelerator routes and new reactors are the mitigation.
Manufacturing quality now decides therapy approvals
ITM received an FDA complete response letter in August 2026 for its lutetium-177 edotreotide candidate in neuroendocrine tumors. The agency cited chemistry, manufacturing and controls items and findings at a third-party site, and raised no clinical concerns. The delay holds back a second lutetium-177 option for patients and revenue for its supplier. Developers respond by building their own dose plants, qualifying backup suppliers and investing in good manufacturing practice before filing.
High entry costs and fragile logistics deter new suppliers
Every step needs shielded hot cells, licensed staff and special transport, and each change of supplier triggers fresh drug and radiation-safety qualification. Some airlines refuse radioactive cargo, forcing longer routes for products that decay by the hour. Diagnostic reimbursement has often lagged the full cost of supply, leaving producers little incentive to fund spare capacity. Full-cost-recovery pricing and payments such as the U.S. domestic molybdenum-99 add-on help close that gap.
Specialist staff and therapy room shortages limit treated patients
Radioligand therapy needs nuclear medicine physicians, physicists, radiopharmacists and shielded rooms that many hospitals lack, and patients outside large cities often have no center within reach. Hospitals hesitate to build therapy rooms before payers commit, and payers wait for local outcome data. The result caps treated patients even where isotope supply exists. Training programs, regional dose manufacturing and reimbursement support from drug makers are the main ways to raise that ceiling.
North America pays most while Asia Pacific builds fastest
| Region | Share, 2025 | CAGR, 2025–2035 |
|---|---|---|
| North America | 41.2% | 7.96% |
| Europe | 27.6% | 6.86% |
| Asia Pacific | 21.9% | 10.56% |
| Latin America | 4.9% | 8.76% |
| Middle East & Africa | 4.4% | 9.26% |
North America grows on therapy adoption and domestic supply policy
North America held 41.2% of 2025 value and grows at 7.96% a year. The U.S. leads adoption of lutetium-177 therapy and PSMA PET, and federal policy now rewards domestic molybdenum-99 through the NNSA award to SHINE and the Medicare add-on. Canada remains a key supplier through Nordion, BWXT Medical and the CANDU reactors that produce about 50% of the world's cobalt-60. Cardinal Health's nuclear pharmacies deliver unit doses across the U.S.
Europe hosts dense imaging networks and the main molybdenum-99 reactors
Europe held 27.6% of 2025 value and grows at 6.86% a year. Germany, France and the United Kingdom have dense nuclear medicine networks, while Belgium, the Netherlands, Czechia and Poland host reactors that irradiate molybdenum-99 for export. Uneven reimbursement keeps therapy uptake in Southern and Eastern Europe behind the west. In March 2026, the European Commission published a feasibility and basic design study for the European Radioisotope Valley Initiative to strengthen regional supply.
Asia Pacific grows fastest on national isotope plans
Asia Pacific held 21.9% of 2025 value and is the fastest-growing region at 10.56% a year. China has a medical isotope plan running to 2035, and CNNC began commercial lutetium-177 production at Qinshan in 2025. Japan imports nearly all its molybdenum-99 but aims for about 30% domestic supply by fiscal 2027, while India, South Korea and Australia combine domestic reactors, including Australia's OPAL, with growing PET networks that support therapy selection.
Latin America and Middle East & Africa add new reactors and cancer centers
Latin America held 4.9% of 2025 value and grows at 8.76% a year. Argentina's RA-10 and Brazil's RMB aim to cut import dependence, and Brazil signed its RMB memorandum with INVAP in September 2025. The Middle East & Africa held 4.4% and grows at 9.26% a year. South Africa's SAFARI-1 is one of the six main molybdenum-99 reactors, and Gulf states are adding cyclotrons and therapy centers.
A Lantheus takeover and a new Novartis plant mark 2025–2026
| Development | Status and market relevance |
|---|---|
| In August 2026, Curium signed a definitive agreement to acquire Lantheus, with closing expected in the first half of 2027. | Signed, not yet closed. Joins reactor isotope supply with a leading PSMA PET franchise. |
| In May 2026, SHINE Technologies received EU marketing authorization for its Ilumira lutetium-177 precursor. | Authorized. Gives European drug makers a U.S. source of lutetium-177. |
| In April 2026, the FDA accepted NorthStar Medical Radioisotopes' drug master file for non-carrier-added actinium-225, after the company announced routine commercial-scale production in January 2026. | Accepted. Lets alpha therapy developers reference a commercial supply. |
| In January 2026, SHINE Technologies completed its acquisition of the Lantheus SPECT business, including the TechneLite generator. | Completed. Moves the main U.S. technetium-99m generator to a domestic molybdenum-99 builder. |
| In November 2025, Novartis opened a radioligand therapy plant in Carlsbad, California, its third U.S. site. | Operating. Shortens delivery times for short-lived lutetium-177 therapy. |
Accelerators and alpha emitters define isotope technology
- Accelerator production uses electron accelerators and cyclotrons to make actinium-225, molybdenum-99 and PET isotopes without highly enriched uranium targets.
- Non-carrier-added lutetium-177 of higher purity from dedicated plants and power reactors supports therapy scale-up and dual sourcing.
- Alpha emitters such as actinium-225 deposit more energy over a shorter path than beta emitters, and supply is now moving from trial to commercial scale.
- Theranostic pairing of matched PET tracers and therapy agents lets hospitals select patients and plan doses with one target.
- Industrial alternatives such as electron-beam and X-ray sterilization and digital radiography compete with cobalt-60 and iridium-192 sealed sources.
Need a Custom Version of This Report?
Tailor the scope, geography, or segments to your exact requirements.
- Custom geography or segment scope
- Direct access to our analyst team
Producers, drug makers and nuclear pharmacies compete
Competition runs across three layers, starting with isotope producers that irradiate and process targets. Curium supplies molybdenum-99, iodine-131 and lutetium-177, NTP Radioisotopes processes molybdenum-99 from SAFARI-1, Eckert & Ziegler supplies isotopes and sealed sources and Nordion supplies cobalt-60, while SHINE Technologies and NorthStar Medical Radioisotopes lead non-reactor routes. In the second layer, radiopharmaceutical companies turn isotopes into drugs, as Novartis owns Pluvicto and Lutathera, Bayer sells radium-223, and Lantheus, GE HealthCare and Bracco Imaging lead in PET and SPECT diagnostics. In the third, Cardinal Health runs one of the largest U.S. nuclear pharmacy networks. Entry barriers are high because licensed facilities, reactor access and drug master files take years to secure. Credence Research estimates the 10 largest suppliers hold well over half of global value, while fluorine-18 stays spread across hundreds of local cyclotron sites.
Producers, drug makers and distributors in the radioisotope supply chain
| Company | Type | Role in the market |
|---|---|---|
| Curium | Isotope producer | Molybdenum-99, iodine-131 and lutetium-177; agreed in August 2026 to acquire Lantheus |
| Novartis | Radiopharmaceutical maker | Pluvicto and Lutathera lutetium-177 therapies; three U.S. radioligand plants |
| Cardinal Health | Nuclear pharmacy network | Unit-dose preparation and delivery to U.S. hospitals |
| GE HealthCare | Diagnostics maker | PET and SPECT radiopharmaceuticals |
| Bracco Imaging | Diagnostics maker | PET and SPECT radiopharmaceuticals |
| Bayer | Radiopharmaceutical maker | Radium-223 therapy and a targeted alpha pipeline |
| Lantheus | Radiopharmaceutical maker | PSMA PET franchise; to be acquired by Curium, closing expected first half of 2027 |
| Eckert & Ziegler | Isotope producer | Isotopes and sealed sources; expanding actinium-225 in Germany and the Czech Republic |
| Nordion | Isotope producer | Cobalt-60 from Canadian power reactors for sterilization |
| NTP Radioisotopes | Isotope processor | Molybdenum-99 from the SAFARI-1 reactor |
| SHINE Technologies | New-route producer | Lutetium-177, molybdenum-99 plant in Wisconsin and the TechneLite generator |
| NorthStar Medical Radioisotopes | New-route producer | Accelerator-made actinium-225 in Beloit, Wisconsin |
Isotope value is moving from scan volume to therapy doses
Credence Research's view is that radioisotope value is shifting from the volume of diagnostic scans to the number of therapy doses. A technetium-99m dose is cheap, while each lutetium-177 or actinium-225 patient needs several high-value doses plus PET scans. The largest new revenue lies in therapy isotopes, alpha emitters and paired PET tracers. Suppliers with qualified, non-reactor or dual-sourced production are best positioned. The main risk is a reactor outage or a manufacturing finding that delays approvals. Investors should watch the Curium-Lantheus closing and new reactor start dates.
How Credence Research built the radioisotope estimates
The report uses 2025 as the base year and forecasts to 2035, with CAGR calculated over 2025–2035. Market values come from Credence Research's market model, built from imaging procedure counts, treated therapy patients and cycles per patient, and sealed-source demand, and checked against reactor and cyclotron capacity reported by the NEA and national programs; segment and regional splits are Credence Research estimates. Supporting evidence comes from agency reports, regulatory notices and company filings.
Therapy isotopes and domestic molybdenum-99 set the pace
Through 2035, radioisotope value will tilt from diagnostic volume toward therapy doses. Lutetium-177 and actinium-225 demand will rise with new indications, while technetium-99m remains the volume base. Accelerator plants, power-reactor routes and new research reactors in Argentina, Brazil and Europe will reduce dependence on aging reactors, though PALLAS is not due until 2032. Asia Pacific will gain share as China and Japan build domestic supply. The pace will depend on manufacturing quality, specialist staff training and payer support for therapy rooms and dosimetry.
Frequently Asked Questions
What was the size of the radioisotope market in 2025?
What is the forecast value and CAGR of the radioisotope market?
Which isotope type holds the largest share?
Which region leads the radioisotope market?
Why is therapy growing faster than diagnostics?
Who are the main radioisotope suppliers?
What is the biggest risk to isotope supply?
How is radioisotope supply changing?
Table of Content
Chapter 1 Market Segmentation
- 1.1 Segmentation Framework
- 1.1.1 Product and Service Classification
- 1.1.2 Application and End-Use Classification
- 1.1.3 Technology and Solution Classification
- 1.1.4 Customer and Distribution Channel Classification
- 1.1.5 Geographic Segmentation
- 1.1.6 Market Segment Definitions and Boundaries
- 1.2 By Type of Isotope
- 1.2.1 Technetium-99m (Tc-99m)
- 1.2.2 Other Isotopes
- 1.2.3 Fluorine-18
- 1.2.4 Lutetium-177
- 1.2.5 Iodine-131
- 1.3 By Application
- 1.3.1 Diagnostics
- 1.3.2 Therapeutics
- 1.3.3 Industrial Applications
- 1.3.4 Research
- 1.4 By End-User
- 1.4.1 Hospitals and Clinics
- 1.4.2 Research Institutions
- 1.4.3 Industrial Sectors
Chapter 2 Introduction
- 2.1 Report Objectives and Scope
- 2.2 Product Definition and Industry Terminology
- 2.3 Market Inclusions and Exclusions
- 2.4 Research Process
- 2.4.1 Primary Research and Expert Interviews
- 2.4.2 Secondary Research and Source Review
- 2.4.3 Top-Down and Bottom-Up Estimation
- 2.4.4 Data Triangulation and Verification
- 2.5 Market Size Measurement Basis
- 2.5.1 2025: USD 6.15 billion → 2035: USD 13.78 billion
- 2.6 Historical and Forecast Reference Periods
- 2.6.1 Historical Period: 2018-2025
- 2.6.2 Base Year: 2025
- 2.6.3 Forecast Period: 2025-2035
- 2.7 Research Assumptions and Limitations
Chapter 3 Executive Summary
- 3.1 Market Snapshot and Key Findings
- 3.2 Base-Year Market Size, 2025
- 3.3 Forecast Market Size, 2035
- 3.4 Revenue and Volume Growth Outlook
- 3.5 Key Demand and Supply Indicators
- 3.6 Leading Market Segments
- 3.7 Fastest-Growing Market Opportunities
- 3.8 Regional Performance Highlights
- 3.9 Technology and Industry Transformation
- 3.10 Competitive Landscape Summary
- 3.11 Analyst View and Strategic Implications
Chapter 4 Global Radioisotope Market Trends and Developments
- 4.1 Historical Industry Development, 2018-2025
- 4.2 Recent Market Trends and Developments
- 4.3 Demand and Customer Behavior Trends
- 4.4 Technology and Product Innovation
- 4.5 Artificial Intelligence, Automation and Digitalization
- 4.6 Local Manufacturing and Supply Chain Realignment
- 4.7 Industry Partnerships, Mergers and Acquisitions
- 4.8 Sustainability and Circular Economy Developments
- 4.9 Government and Private Sector Investment Trends
- 4.10 Emerging Business Models and Commercialization
- 4.11 Industry Developments and Announcements
Chapter 5 Global Radioisotope Market Production, Supply and Demand Analysis
- 5.1 Demand Trend and Consumption Analysis, 2018-2025
- 5.2 Demand Forecast, 2025-2035
- 5.3 Production and Output Trend, 2018-2025
- 5.4 Production and Output Forecast, 2025-2035
- 5.5 Installed Capacity and Capacity Utilization
- 5.6 Company-Wise Production Plants and Statistics
- 5.6.1 Installed Production Capacity
- 5.6.2 Actual Production
- 5.6.3 Planned Capacity and Expansion Targets
- 5.7 Supply Chain Structure and Procurement Trends
- 5.8 Supply-Demand Gap and Bottlenecks
- 5.9 Import Dependence and Sourcing Structure
- 5.10 Contract Manufacturing and Outsourcing
- 5.11 Regional Supply and Demand Concentration
Chapter 6 Global Radioisotope Market Pricing Analysis
- 6.1 Pricing Structure and Measurement
- 6.2 Historical Pricing Trends, 2018-2025
- 6.3 Pricing Outlook, 2025-2035
- 6.4 Average Selling Price and Unit Economics
- 6.5 Pricing by Product and Market Segment
- 6.6 Geographic Pricing Differences
- 6.7 Key Input, Energy, Labor and Logistics Costs
- 6.8 Contract Pricing and Purchasing Models
- 6.9 Pricing Sensitivity and Competitive Positioning
- 6.10 Price, Margin and Profitability Implications
Chapter 7 Global Radioisotope Market Dynamics
- 7.1 Market Growth Drivers
- 7.1.1 Demand-Side Drivers
- 7.1.2 Technology and Innovation Drivers
- 7.1.3 Infrastructure and Investment Drivers
- 7.1.4 Regulatory and Policy Drivers
- 7.2 Market Restraints
- 7.2.1 Cost and Affordability Constraints
- 7.2.2 Technology and Adoption Barriers
- 7.2.3 Supply Chain and Operational Constraints
- 7.3 Market Challenges
- 7.3.1 Competitive Pressure and Margin Erosion
- 7.3.2 Skills, Infrastructure and Implementation Gaps
- 7.4 Emerging Market Opportunities
- 7.5 Market Dynamics Impact and Time-Horizon Assessment
Chapter 8 Global Radioisotope Value Chain Analysis
- 8.1 Industry Value Chain Overview
- 8.2 Upstream Suppliers and Critical Inputs
- 8.3 Technology and Component Providers
- 8.4 Manufacturing or Service Delivery
- 8.5 Distribution, Channel Partners and Integrators
- 8.6 Downstream Applications and End Users
- 8.7 Value Addition and Profit Pools
- 8.8 Vertical Integration and Outsourcing
- 8.9 Supplier Concentration and Risk
- 8.10 Supply Chain Localization and Resilience
Chapter 9 Global Radioisotope Market Regulations and Policies
- 9.1 Relevant Laws, Standards and Compliance Frameworks
- 9.2 Product, Service, Safety and Quality Requirements
- 9.3 Government Policies, Incentives and Subsidies
- 9.4 Imports, Exports and Trade Barriers
- 9.5 Public Procurement and Local Content Requirements
- 9.6 Environmental and Sustainability Compliance
- 9.7 Upcoming Policy Changes and Market Implications
Chapter 10 Global Radioisotope Market Hotspots and Opportunities
- 10.1 Market Opportunity Mapping and Growth Hotspots
- 10.2 High-Growth Applications and Customer Groups
- 10.3 Underserved Markets and White-Space Opportunities
- 10.4 Emerging Technology and Product Opportunities
- 10.5 New Capacity and Investment Hotspots
- 10.6 Market Entry and Expansion Opportunities
- 10.7 Distribution and Partnership Opportunities
- 10.8 Near-Term and Long-Term Commercial Potential
- 10.9 Opportunity Attractiveness and Execution Risks
Chapter 11 Global Radioisotope Market Outlook, 2025-2035
- 11.1 Market Size and Analysis
- 11.1.1 Revenue (Market Measurement: 2025: USD 6.15 billion → 2035: USD 13.78 billion)
- 11.1.2 Market Volume and Quantity Sold
- 11.1.3 Historical Market Size, 2018-2025
- 11.1.4 Base-Year Market Size, 2025
- 11.2 Market Forecast, 2025-2035
- 11.2.1 Revenue Forecast to 2035
- 11.2.2 Volume Forecast to 2035
- 11.2.3 CAGR and Year-on-Year Growth
- 11.2.4 Incremental Revenue Opportunity
- 11.3 Forecast Assumptions and Scenario Analysis
- 11.3.1 Base-Case Forecast
- 11.3.2 Optimistic and Conservative Scenarios
- 11.3.3 Technology, Pricing and Policy Sensitivities
- 11.4 Market Attractiveness and Growth Outlook
Chapter 12 Global Radioisotope Market Segmentation and Outlook
- 12.1 Segmentation Summary and Market Shares, 2025
- 12.2 Largest and Fastest-Growing Segments
- 12.3 By Type of Isotope - Market Size and Forecast, 2025-2035
- 12.3.1 Segment Definition and Scope
- 12.3.2 Historical Market Size, 2018-2025
- 12.3.3 Revenue Forecast, 2025-2035
- 12.3.4 Volume Forecast, 2025-2035
- 12.3.5 Base-Year Market Share, 2025
- 12.3.6 Segment CAGR and Growth Drivers
- 12.3.7 Subsegment Market Size and Forecast
- 12.3.7.1 Technetium-99m (Tc-99m)
- 12.3.7.2 Other Isotopes
- 12.3.7.3 Fluorine-18
- 12.3.7.4 Lutetium-177
- 12.3.7.5 Iodine-131
- 12.3.8 Subsegment Pricing and Adoption Trends
- 12.3.9 Leading Suppliers and Competition
- 12.3.10 Regional Demand and Opportunities
- 12.4 By Application - Market Size and Forecast, 2025-2035
- 12.4.1 Segment Definition and Scope
- 12.4.2 Historical Market Size, 2018-2025
- 12.4.3 Revenue Forecast, 2025-2035
- 12.4.4 Volume Forecast, 2025-2035
- 12.4.5 Base-Year Market Share, 2025
- 12.4.6 Segment CAGR and Growth Drivers
- 12.4.7 Subsegment Market Size and Forecast
- 12.4.7.1 Diagnostics
- 12.4.7.2 Therapeutics
- 12.4.7.3 Industrial Applications
- 12.4.7.4 Research
- 12.4.8 Subsegment Pricing and Adoption Trends
- 12.4.9 Leading Suppliers and Competition
- 12.4.10 Regional Demand and Opportunities
- 12.5 By End-User - Market Size and Forecast, 2025-2035
- 12.5.1 Segment Definition and Scope
- 12.5.2 Historical Market Size, 2018-2025
- 12.5.3 Revenue Forecast, 2025-2035
- 12.5.4 Volume Forecast, 2025-2035
- 12.5.5 Base-Year Market Share, 2025
- 12.5.6 Segment CAGR and Growth Drivers
- 12.5.7 Subsegment Market Size and Forecast
- 12.5.7.1 Hospitals and Clinics
- 12.5.7.2 Research Institutions
- 12.5.7.3 Industrial Sectors
- 12.5.8 Subsegment Pricing and Adoption Trends
- 12.5.9 Leading Suppliers and Competition
- 12.5.10 Regional Demand and Opportunities
- 12.6 Segment Growth Comparison
- 12.7 Segment Attractiveness and Priority Matrix
Chapter 13 Global Radioisotope End-Use and Application Market Outlook
- 13.1 End-Use Industry and Customer Demand Structure
- 13.2 Leading Applications and Customer Groups
- 13.3 End-Use Market Size, Share and Forecast
- 13.4 Major End-Use Industry Deep Dives
- 13.4.1 Customer Requirements and Use Cases
- 13.4.2 Demand and Replacement Cycles
- 13.4.3 Technical and Regulatory Considerations
- 13.4.4 Purchasing and Procurement Models
- 13.4.5 Leading Vendors and Distribution Channels
- 13.4.6 Forecast and Commercial Opportunities
- 13.5 Emerging Applications and Cross-Segment Demand
- 13.6 End-Use Industry Investment Priorities
Chapter 14 Global Radioisotope Geographic Market Outlook, 2025-2035
- 14.1 Regional Market Size and Share, 2025
- 14.2 Regional Market Forecast, 2025-2035
- 14.3 Regional Pricing, Production and Demand Differences
- 14.4 North America
- 14.4.1 United States
- 14.4.2 Canada
- 14.4.3 Mexico
- 14.5 Europe
- 14.5.1 Germany
- 14.5.2 France
- 14.5.3 Italy
- 14.5.4 United Kingdom
- 14.5.5 Spain
- 14.5.6 Poland
- 14.5.7 Russia
- 14.5.8 Netherlands
- 14.5.9 Belgium
- 14.5.10 Sweden
- 14.5.11 Denmark
- 14.5.12 Norway
- 14.5.13 Rest of Europe
- 14.6 Asia Pacific
- 14.6.1 China
- 14.6.2 India
- 14.6.3 Japan
- 14.6.4 South Korea
- 14.6.5 Thailand
- 14.6.6 Indonesia
- 14.6.7 Vietnam
- 14.6.8 Malaysia
- 14.6.9 Australia
- 14.6.10 Rest of Asia Pacific
- 14.7 Latin America
- 14.7.1 Brazil
- 14.7.2 Argentina
- 14.7.3 Colombia
- 14.7.4 Chile
- 14.7.5 Rest of Latin America
- 14.8 Middle East
- 14.8.1 Saudi Arabia
- 14.8.2 United Arab Emirates
- 14.8.3 Turkey
- 14.8.4 Israel
- 14.8.5 Iran
- 14.8.6 Rest of the Middle East
- 14.9 Africa
- 14.9.1 South Africa
- 14.9.2 Egypt
- 14.9.3 Nigeria
- 14.9.4 Morocco
- 14.9.5 Rest of Africa
- 14.10 Regional Investment, Policy and Supply Chain Differences
- 14.11 Regional Competitive Landscape
- 14.12 Geographic Growth Hotspots
Chapter 15 Global Radioisotope Technology, Innovation and Sustainability Outlook
- 15.1 Technology Landscape and Maturity
- 15.2 Product, Process and Service Innovation
- 15.3 AI, Automation and Digital Tools in the Industry
- 15.4 Technology Adoption and Performance Benchmarking
- 15.5 Innovation Pipeline and R&D Investment
- 15.6 Patent and Intellectual Property Trends
- 15.7 Energy Efficiency and Resource Management
- 15.8 Sustainability, Recycling and Circularity
- 15.9 Technology Roadmap, 2025-2035
- 15.10 Risks of Obsolescence and Technology Substitution
Chapter 16 Global Radioisotope Market Key Strategic Imperatives
- 16.1 Growth and Market Entry Priorities
- 16.2 High-Return Products and Segments
- 16.3 Pricing, Profitability and Cost Optimization
- 16.4 Technology Investment and Product Differentiation
- 16.5 Supply Chain Localization and Resilience
- 16.6 Distribution and Customer Acquisition
- 16.7 Partnership, Acquisition and Capacity Strategy
- 16.8 Regional Expansion Priorities
- 16.9 Short-, Medium- and Long-Term Actions
Chapter 17 Competition Outlook
- 17.1 Industry Competition Characteristics
- 17.2 Market Structure and Concentration
- 17.3 Market Share and Competitive Positioning, 2025
- 17.4 Company-Wise Revenue and Product Benchmarking
- 17.5 Production and Service Capacity Benchmarking
- 17.6 Technology, Pricing and Differentiation
- 17.7 Regional Footprint and Distribution Strength
- 17.8 Mergers, Acquisitions and Strategic Alliances
- 17.9 New Entrants and Competitive Threats
- 17.10 Porter's Five Forces and Industry Attractiveness
- 17.11 Competitive Outlook, 2025-2035
Chapter 18 Company Profiles
- 18.1 Company Coverage and Selection Criteria
- 18.2 Curium
- 18.2.1 Business Description
- 18.2.2 Company Ownership and Geographic Presence
- 18.2.3 Product and Service Portfolio
- 18.2.4 Manufacturing and Operating Footprint
- 18.2.5 Production Capacity and Expansion Plans
- 18.2.6 Financial Performance and Investment
- 18.2.7 Market Share and Competitive Position
- 18.2.8 Technology and Innovation Capabilities
- 18.2.9 Strategic Alliances or Partnerships
- 18.2.10 Recent Developments
- 18.2.11 Growth Strategy and Outlook
- 18.3 Novartis
- 18.4 Cardinal Health
- 18.5 GE HealthCare
- 18.6 Bracco Imaging
- 18.7 Bayer
- 18.8 Lantheus
- 18.9 Eckert & Ziegler
- 18.10 Nordion
- 18.11 NTP Radioisotopes
- 18.12 SHINE Technologies
- 18.13 NorthStar Medical Radioisotopes
- 18.14 Other Relevant Market Participants
Note: Every listed company is profiled on the structure shown under the first company. The company list is preliminary and may change based on research findings, market developments, data availability and client requirements.
Chapter 19 Disclaimer
- 19.1 Research and Forecast Disclaimer
- 19.2 Data Source and Estimation Limitations
Note: The depth of individual sections depends on data availability for this market. Volume, capacity, trade and other unit-based metrics are included where applicable.

