
Aging patients and fusion volumes anchor bone graft demand
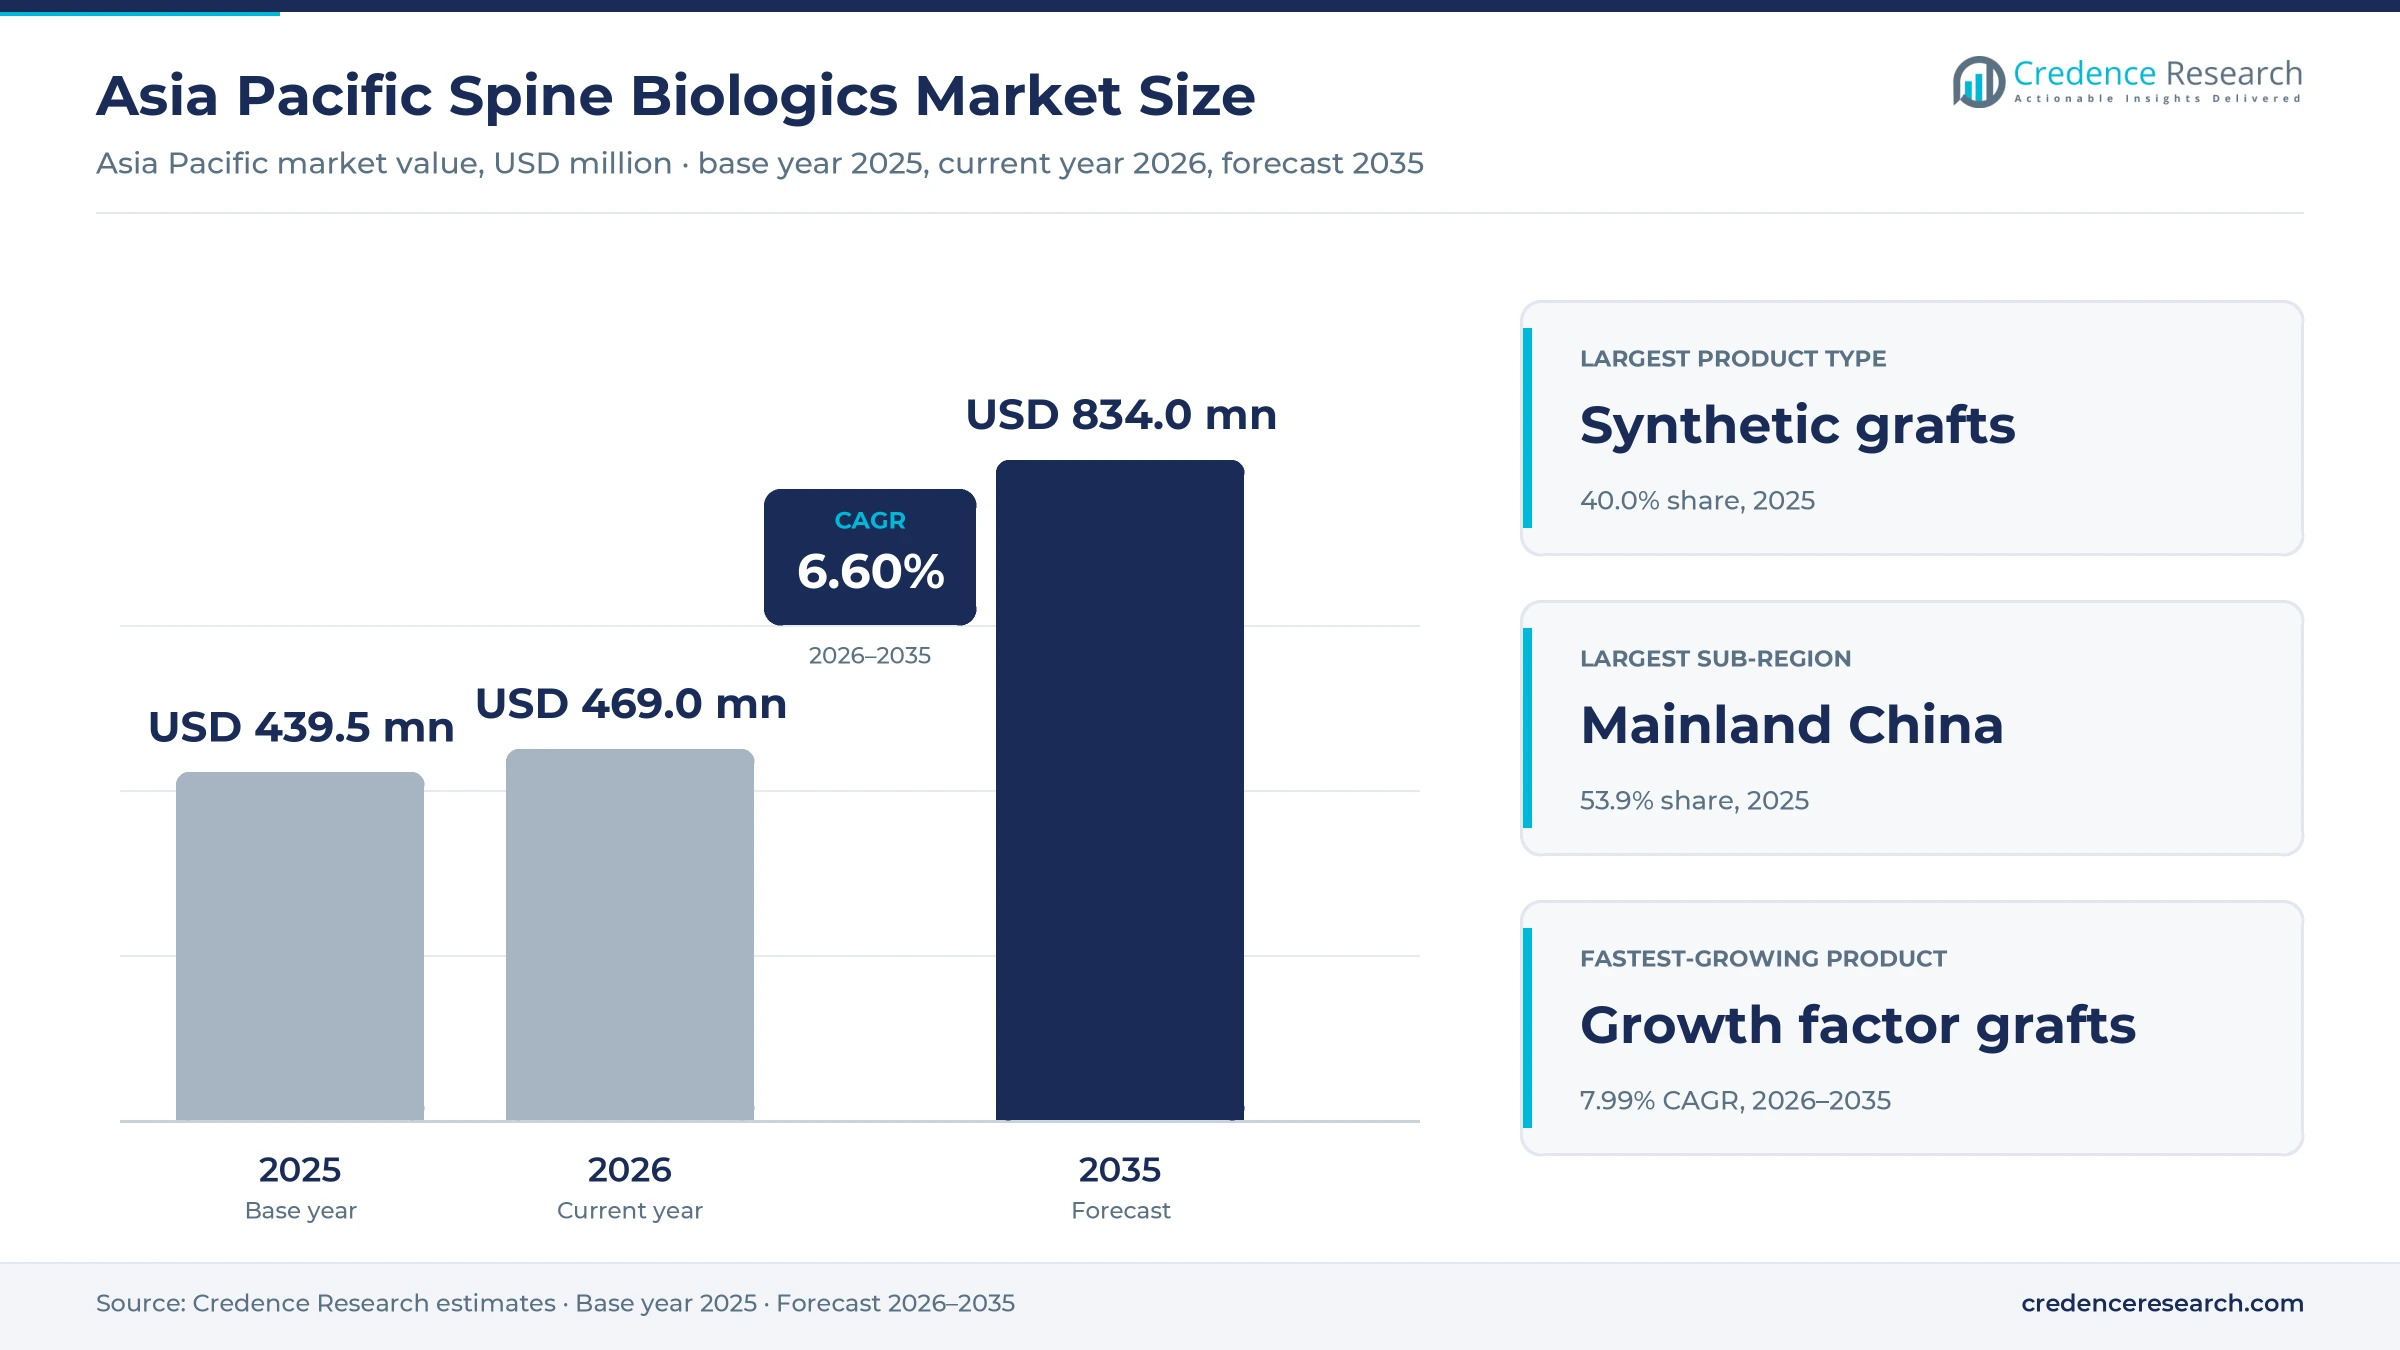
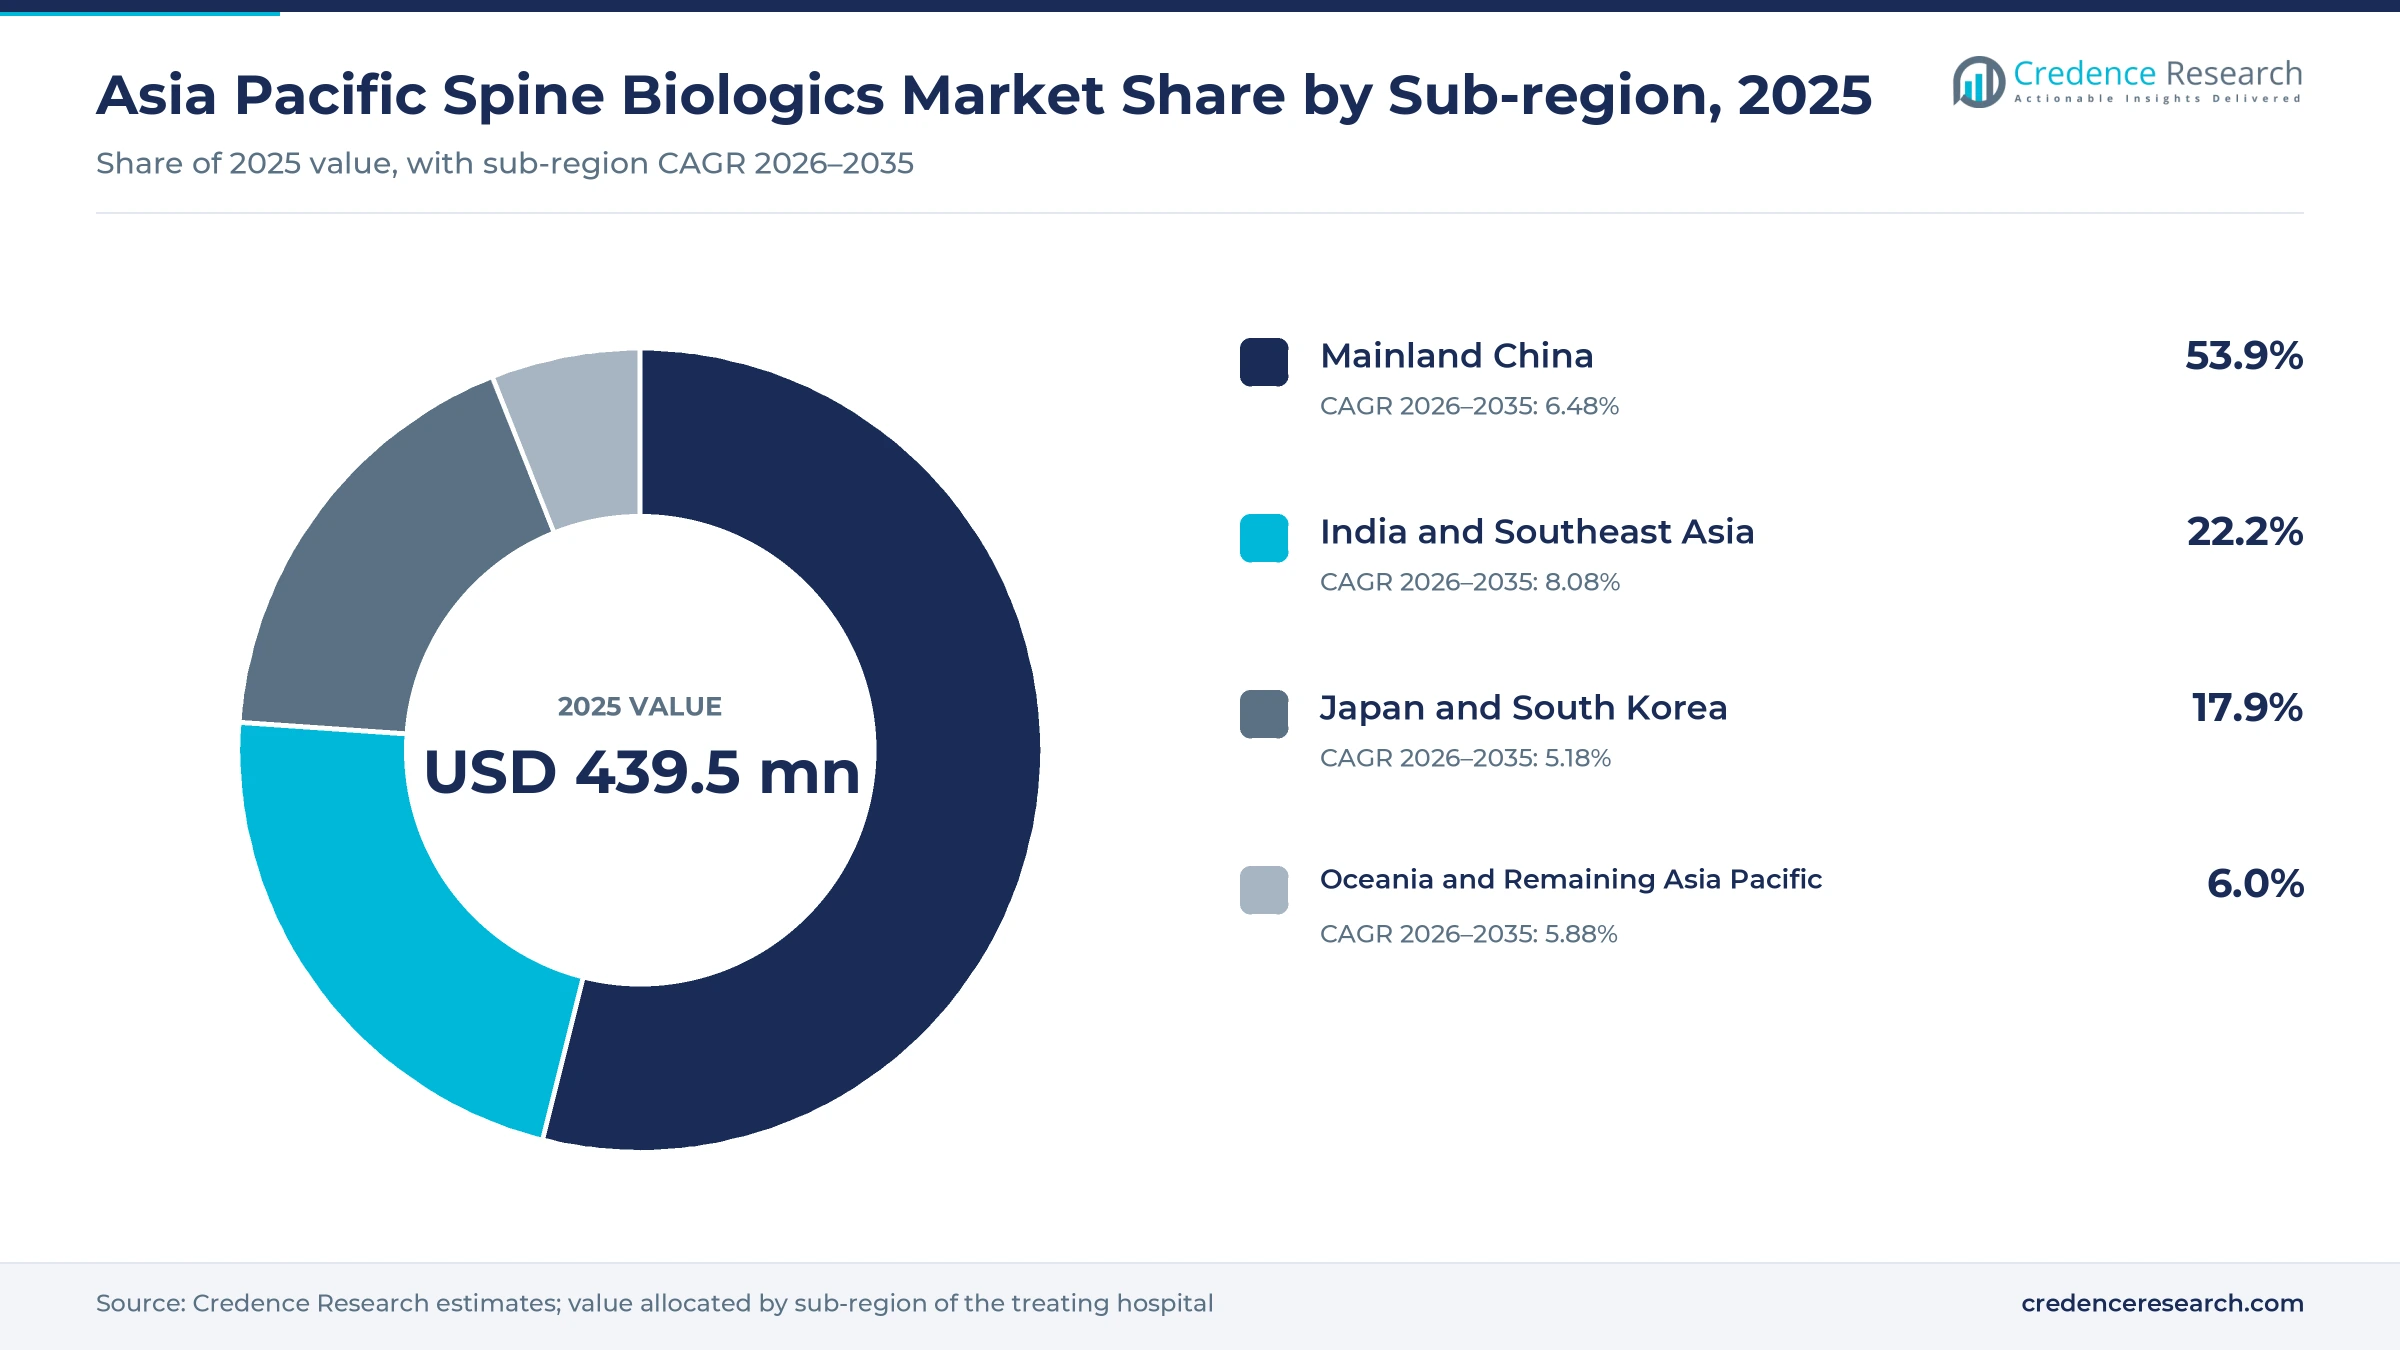
The Asia Pacific spine biologics market was valued at USD 439.5 million in 2025 and is projected to increase from USD 469.0 million in 2026 to USD 834.0 million by 2035, registering a CAGR of 6.60% during 2026–2035. Demand comes from older patients who need lumbar and cervical fusion, hospitals that buy graft material to help bone heal across fused levels, and surgeons who want less reliance on bone taken from the hip. Mainland China held the largest sub-regional share, 53.9% in 2025, because national tenders have cut spinal implant prices and widened access to fusion surgery. India and Southeast Asia is the fastest-growing sub-region at 8.08% a year, as new hospital bone banks and public insurance for older adults bring more patients to surgery. Japan approved a peptide-based bone regeneration material on Feb. 13, 2026, after a lumbar fusion study, which shows how new graft types are reaching the region.
Which bone graft products does the regional estimate cover?
The estimate measures spending on graft materials used to achieve bone fusion in spinal surgery across Asia Pacific. It covers allograft products, synthetic ceramic grafts, growth factor grafts and cellular or combination products bought by hospitals, ambulatory surgery centers and specialty spine clinics. Values are measured at the price paid by the provider, whether through direct contracts, specialist distributors or public tenders.
The estimate excludes screws, rods, cages and other spinal implants, as well as bone growth stimulators and the patient's own bone harvested during surgery. The value chain runs from tissue banks and material makers through device companies and distributors to the hospitals and clinics that treat patients in Mainland China, Japan and South Korea, India and Southeast Asia, and Oceania and Remaining Asia Pacific.
Asia Pacific Spine Biologics Market Insights
- The Asia Pacific spine biologics market was valued at USD 439.5 million in 2025 and is projected to reach USD 834.0 million by 2035, registering a CAGR of 6.60% during 2026–2035.
- Mainland China held a 53.9% share of 2025 value, because national tenders for spinal implants drew demand from 6,426 medical institutions.
- Synthetic graft products led product demand with a 40.0% share of 2025 value, because ceramic grafts avoid the tissue supply limits of donor bone.
- Japan approved the Verte bone regeneration material on Feb. 13, 2026, after a lumbar fusion study reported a 95.12% bone union rate at 12 months.
- Johnson & Johnson signed an exclusive deal in February 2025 to distribute the NOVOSIS growth factor graft in six Asian markets, including Korea and India.
Synthetic grafts lead, growth factor grafts grow fastest
Why do synthetic grafts lead product demand?
Based on product type, the market is categorized into allograft products, synthetic graft products, growth factor graft products and cellular and combination graft products. Synthetic Graft Products led with a 40.0% share of 2025 value, because ceramic grafts are easy to store and avoid the donor tissue shortages common in the region. Growth Factor Graft Products grow fastest at 7.99% a year, as Korean protein-based grafts gain distribution partners.
How do hospitals shape care setting demand?
Based on care setting, the market is categorized into hospitals, ambulatory surgery centers and specialty spine clinics. Hospitals led with a 78.0% share of 2025 value, because most fusion surgery in China, India and Japan still takes place in large inpatient centers. Ambulatory Surgery Centers grow fastest at 8.53% a year, as shorter, less invasive procedures move into day surgery units.
Why do degenerative conditions dominate case volumes?
Based on disease area, the market is categorized into degenerative spinal conditions, spinal deformity and revision and reconstructive conditions. Degenerative Spinal Conditions led with a 68.0% share of 2025 value, because stenosis and disc disease drive most fusion cases in older adults. Revision and Reconstructive Conditions grow fastest at 6.95% a year, since repeat surgery and failed fusions need more graft material per case.
How do specialist distributors lead sales?
Based on sales channel, the market is categorized into direct manufacturer contracts, specialist distributor sales and tender-led supply. Specialist Distributor Sales led with a 41.0% share of 2025 value, because device makers rely on local partners to reach hospitals across many countries. Tender-Led Supply grows fastest at 7.09% a year, as public buyers in China extend tenders to more surgical consumables.
| Segment Group | Leading Sub-segment | Share, 2025 | Fastest-growing Sub-segment | CAGR, 2026–2035 |
|---|---|---|---|---|
| By Product Type | Synthetic Graft Products | 40.0% | Growth Factor Graft Products | 7.99% |
| By Care Setting | Hospitals | 78.0% | Ambulatory Surgery Centers | 8.53% |
| By Disease Area | Degenerative Spinal Conditions | 68.0% | Revision and Reconstructive Conditions | 6.95% |
| By Sales Channel | Specialist Distributor Sales | 41.0% | Tender-Led Supply | 7.09% |
Request a Free Sample
Fill in your details and we'll send you a free sample report.
- Sample data tables & charts
- Research methodology
Older patients, matrix access and distributors lift demand
How does age-related spine disease widen surgical demand?
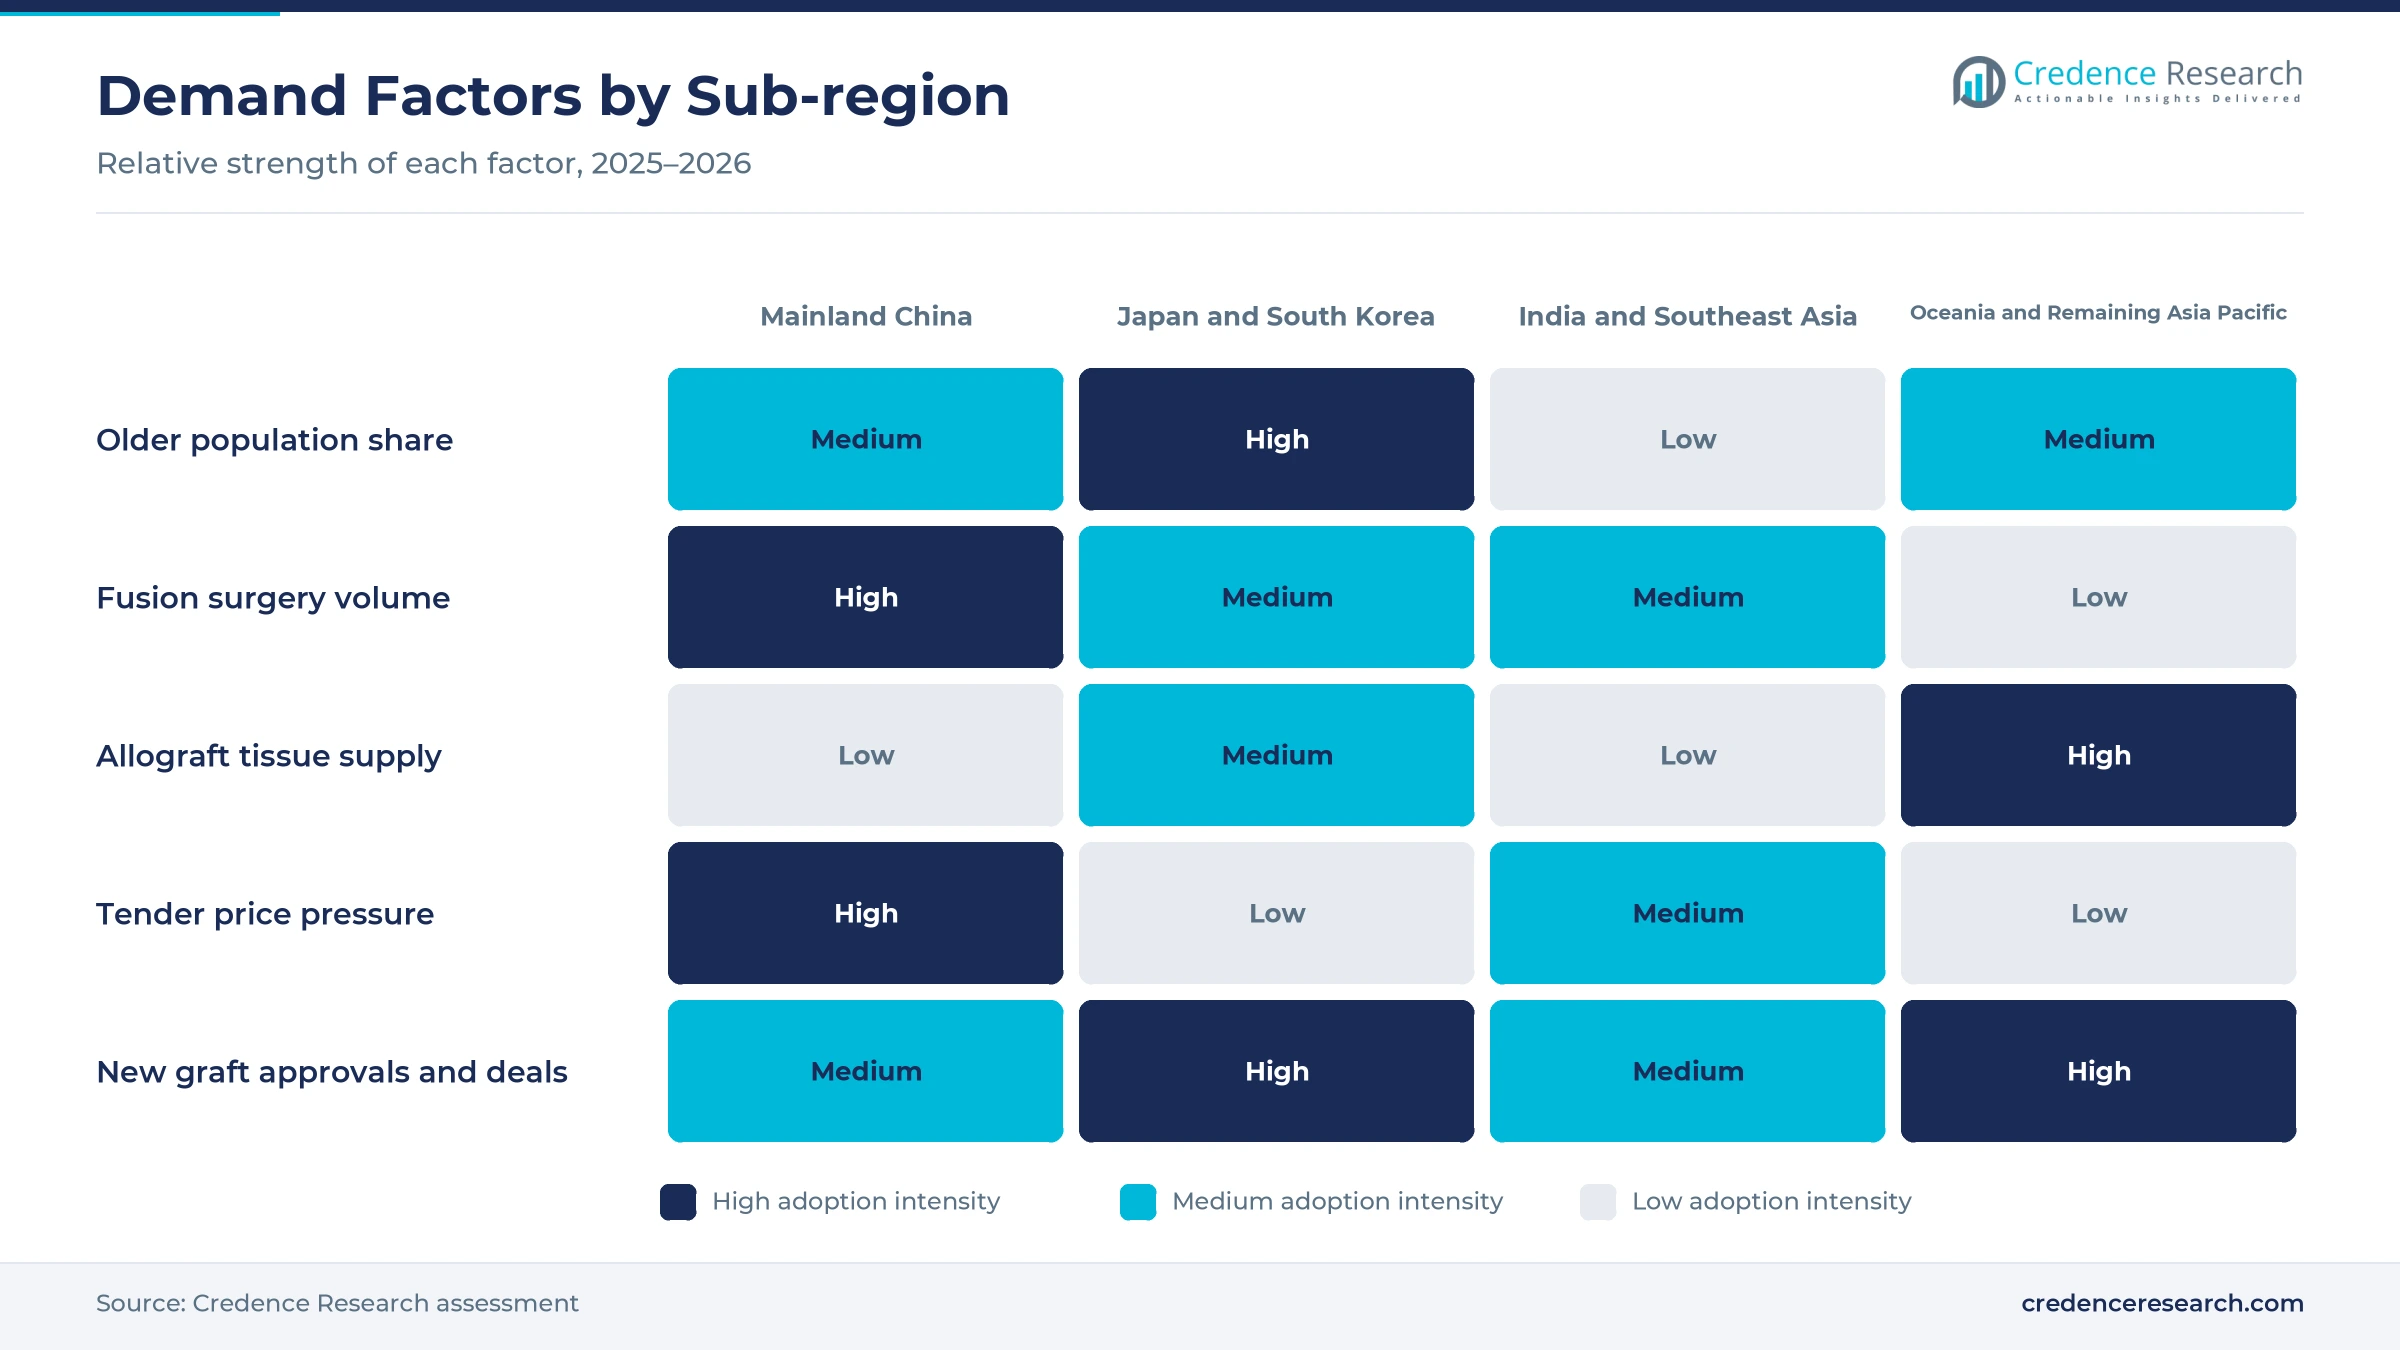
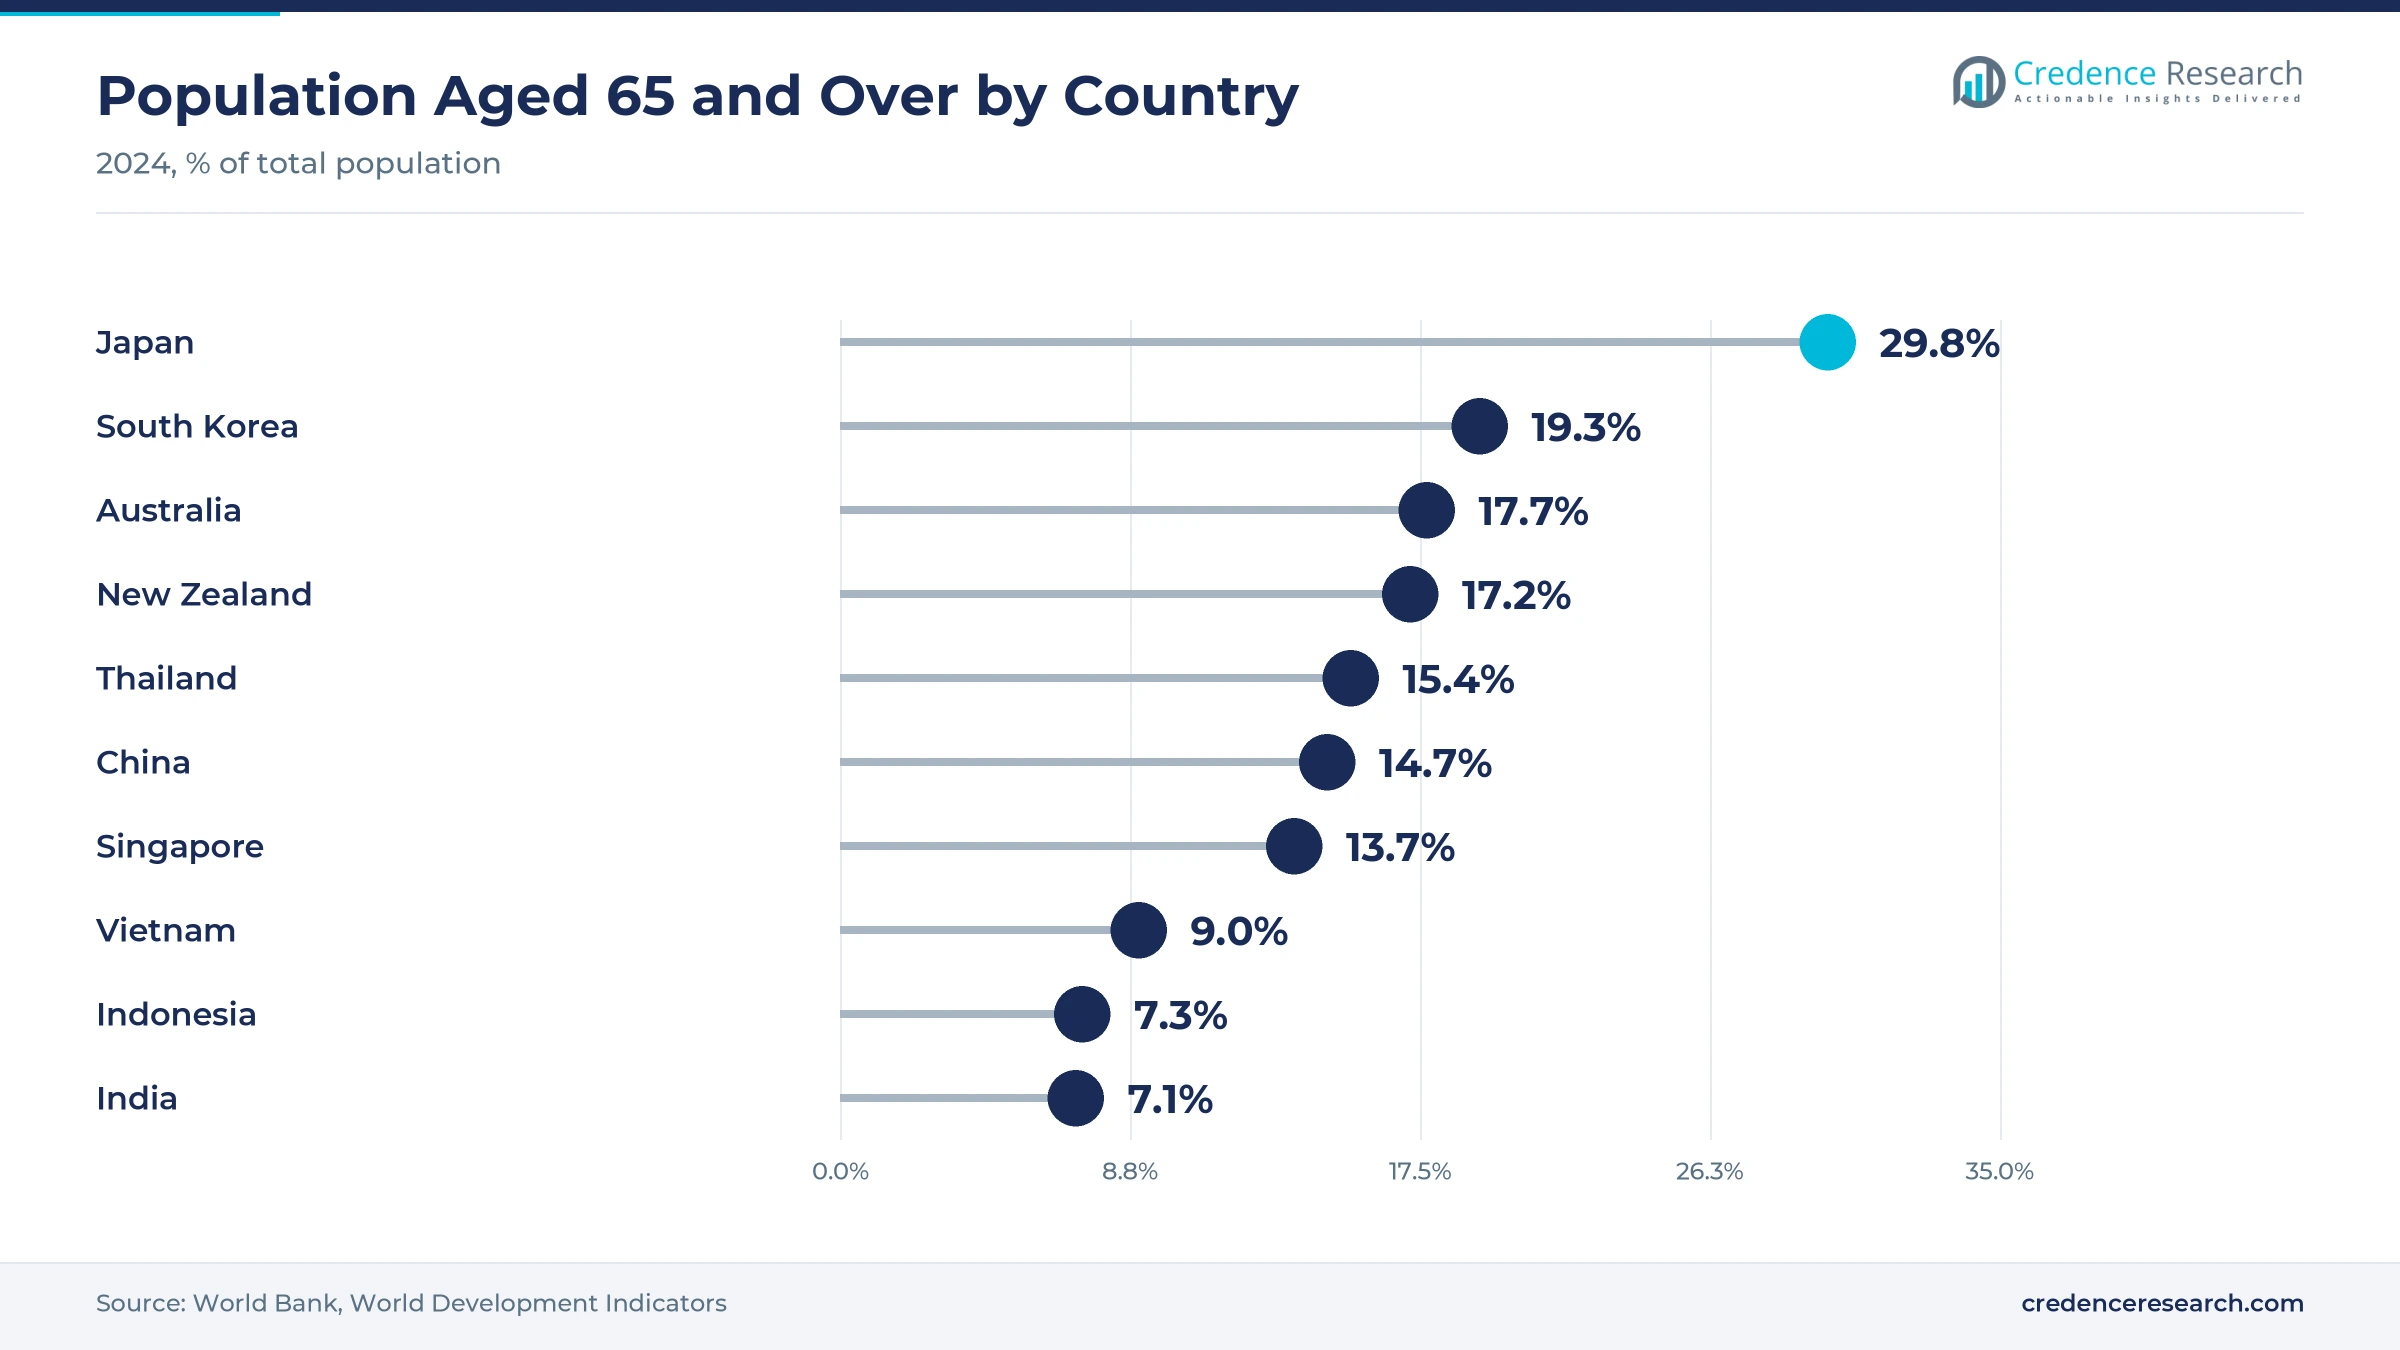
An older population brings more disc degeneration and stenosis, which raises the number of patients who qualify for fusion surgery. People aged 65 and over made up 29.8% of Japan's population, 19.3% of South Korea's and 17.7% of Australia's in 2024, according to World Bank data. China had more than 220.2 million people aged 65 and over at the end of 2024, or about 15.6% of its population. India also issued more than 9.3 million Ayushman Vay Vandana cards by Oct. 31, 2025, which give people aged 70 and over Rs 500,000 of hospital cover each year. As a result, degenerative spinal conditions hold a 68.0% share of 2025 value.
Why does established demineralized matrix access matter?
Surgeons need graft options that are approved and stocked locally, and demineralized bone matrix gives them a proven alternative to bone taken from the hip. Japan's regulator cleared Medtronic's Grafton demineralized bone matrix in August 2018, and the company launched it in February 2019 as the first such product in Japan, according to a Medtronic release that cited use in more than 1.5 million procedures worldwide. The release also described Japan as the second-largest market for spinal medical devices in the world. In India, the national tissue bank at Safdarjung Hospital supplies freeze-dried bone allografts to surgeons. In turn, locally approved matrix and synthetic grafts support Japan and South Korea, which hold 17.9% of 2025 value.
How do specialist distributors and partnerships extend reach?
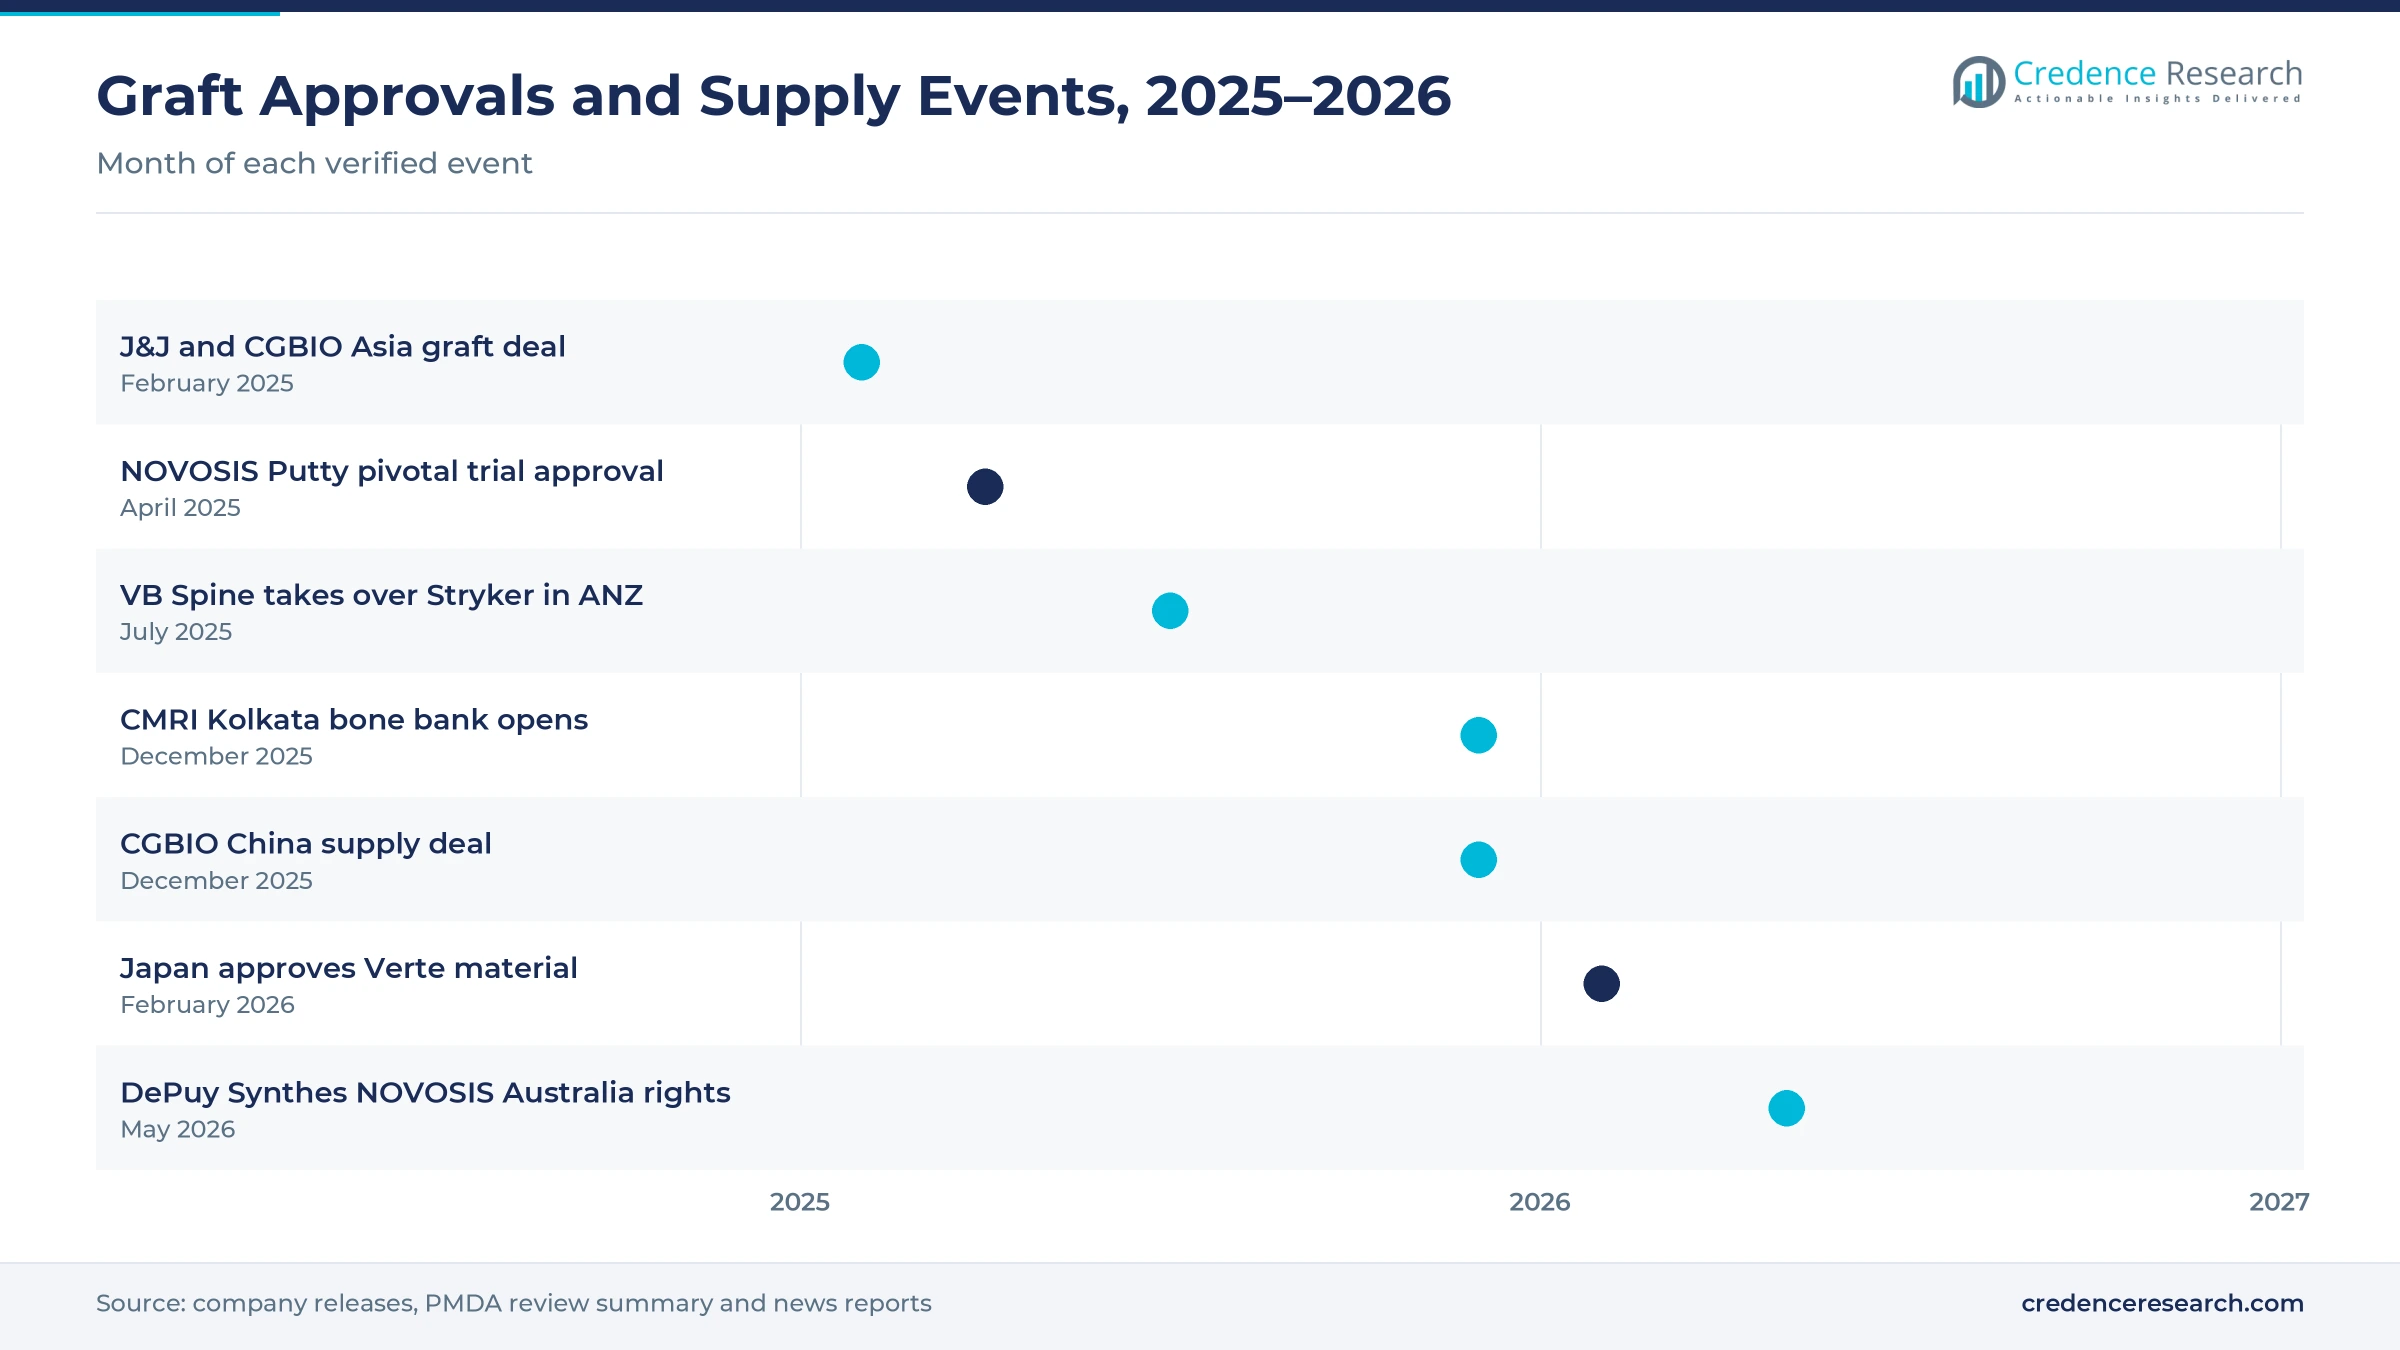
Device makers sell bone graft products through local partners that already serve spine surgeons, which extends reach across many health systems. Johnson & Johnson signed an exclusive deal with CGBIO in February 2025 to distribute the NOVOSIS growth factor graft in Korea, Taiwan, Thailand, India, Hong Kong and Macau, according to a DePuy Synthes release. DePuy Synthes then added exclusive rights for Australia on May 26, 2026. In Australia and New Zealand, the distributor LifeHealthcare kept serving hospitals when Stryker's spinal implants business moved to VB Spine in July 2025. As a result, specialist distributor sales lead the channel mix with a 41.0% share.
Why does centralized purchasing in China lift case volumes?
National tenders have cut the price of spinal implants in China, which lowers the cost of surgery and brings more patients to fusion. The national tender for spinal consumables in September 2022 cut prices by an average of 84%, according to China Daily. The same report said posterior thoracolumbar fixation sets fell from 33,000 yuan to about 4,500 yuan on average. Jiemian reported that 6,426 medical institutions submitted demand for about 1.21 million sets in that tender. In turn, lower implant costs widen access to fusion surgery in public hospitals, and tender-led supply grows at 7.09% a year.
Growth factor grafts, peptide gels and bone banks emerge
How is the shift to growth factor grafts changing supply?
Korean developers are bringing protein-based grafts to the region, which gives surgeons an option that actively signals bone growth. CGBIO said in April 2025 that its NOVOSIS Putty, which releases rhBMP-2 from a ceramic carrier, had completed phase 1 and two trials in Japan, according to The Korea Herald. The same product won U.S. approval for a pivotal spinal fusion trial that month. CGBIO also signed a supply deal with a Shanghai orthopedic company in December 2025 that targets Chinese approval of NOVOSIS by the third quarter of 2027, according to The Asia Business Daily. As a result, growth factor graft products grow fastest at 7.99% a year.
Why are peptide and synthetic regeneration materials on the rise?
Japanese makers are developing synthetic materials that guide new bone without donor tissue, which suits a country with limited allograft supply and a strong local materials industry. Japan approved Menicon's Verte absorbable bone regeneration material on Feb. 13, 2026, according to a PMDA review summary. The supporting study used the peptide gel in posterior lumbar interbody fusion and reported a 95.12% bone union rate at 12 months. The review compared that rate with historical results for beta-tricalcium phosphate combined with the patient's own bone, a common synthetic bone graft substitute option. In turn, synthetic graft products keep a 40.0% share of product demand, and new local approvals strengthen that lead.
Can hospital bone banks open new allograft supply in India?
New bone banks and wider insurance for older adults are creating fresh allograft supply and demand in India. CK Birla Hospitals opened a bone bank at CMRI Kolkata on Dec. 1, 2025, which it described as the first in Eastern India, according to Medical Dialogues. The bank processes structural blocks, morselized grafts and cancellous chips for spinal fusion, tumor and deformity surgery. The national tissue bank at Safdarjung Hospital in New Delhi also registers and trains other tissue banks. Under Ayushman Vay Vandana, 789,000 hospital admissions worth Rs 17.41 billion were authorized by Oct. 31, 2025, according to Health Ministry data. As a result, allograft products gain new local supply in a sub-region that grows fastest in the forecast.
Is there room for growth in private Oceania spine care?
Private hospitals perform most fusion surgery in Australia, which opens room for premium graft products that private health insurers and hospital groups fund. Private hospitals accounted for 83% of 14,608 lumbar spinal fusion admissions from 2015-16 to 2017-18, according to the Australian Commission on Safety and Quality in Health Care. DePuy Synthes won exclusive Australian rights to the NOVOSIS graft on May 26, 2026, pending local clinical data and approval. Globus Medical also said in its 2025 annual report that a significant part of its foreign revenue comes from Japan and Australia. In turn, Oceania and Remaining Asia Pacific grows at 5.88% a year.
Tender prices, tissue supply and evidence gaps slow uptake
How do tender prices squeeze graft margins?
Public tenders in China have pushed implant prices down sharply, which puts pressure on the price of every product used in the same surgery. Hospitals that buy low-cost implant sets often expect cheaper graft material as well. As a result, suppliers of premium matrices and protein grafts struggle to win volume in public hospitals. Companies respond by offering lower-cost synthetic ranges and by focusing on private hospitals and complex cases.
Why does limited donor tissue restrict allograft supply?
Many countries in the region have few licensed tissue banks, which limits the supply of donor bone for spinal surgery. India's national tissue bank opened only in 2017, and private banks such as the one at CMRI Kolkata opened in 2025. In turn, surgeons often rely on bone taken from the patient or on imported products. Tissue banks respond with new screening and processing standards, but building donor programs takes years.
How do evidence demands slow new graft approvals?
Regulators ask for clinical data before approving new graft types, which delays launches across the region. Menicon needed a multicenter lumbar fusion study in Japan before the regulator would approve its Verte peptide material. CGBIO also expects Chinese approval of NOVOSIS only by the third quarter of 2027. As a result, companies must fund trials in several countries before sales begin, which favors larger firms with deep clinical teams.
Why does fragmented regulation raise market entry costs?
Each country in the region sets its own approval rules for tissue and device products, which raises costs for companies that sell across borders. Globus Medical noted in its 2025 annual report that Japan requires separate regional filings, while Australia and India accept some foreign approvals. In turn, smaller graft makers enter fewer markets in the region each year. Companies respond by signing local distribution deals with partners that already hold licenses.
Mainland China leads, India and Southeast Asia grow fastest
| Sub-region | Value, 2025 (USD million) | Share, 2025 | CAGR, 2026–2035 |
|---|---|---|---|
| Mainland China | 236.9 | 53.9% | 6.48% |
| India and Southeast Asia | 97.6 | 22.2% | 8.08% |
| Japan and South Korea | 78.7 | 17.9% | 5.18% |
| Oceania and Remaining Asia Pacific | 26.4 | 6.0% | 5.88% |
Why does Mainland China hold the largest share?
China had about 310.3 million people aged 60 and over at the end of 2024, according to the State Council, which gives it the largest pool of fusion patients in the region. As a result, Mainland China held a 53.9% share of 2025 value and grows at 6.48% a year. National tenders also cut spinal implant prices by an average of 84%, which brought more patients to surgery in public hospitals.
Why are India and Southeast Asia growing fastest?
Access to spinal surgery is widening from a low base in India, Thailand, Vietnam and Indonesia, where older populations are still small but rising. India and Southeast Asia held a 22.2% share of 2025 value and grow at 8.08% a year. India gives people aged 70 and over Rs 500,000 of hospital cover a year under Ayushman Vay Vandana. Hospital bone banks and the NOVOSIS distribution deal for India and Thailand also add new graft options, while regional demand for thoracolumbar fusion implants rises.
How do Japan and South Korea support premium graft demand?
People aged 65 and over made up 29.8% of Japan's population and 19.3% of South Korea's in 2024, and both countries run well-funded hospitals. As a result, Japan and South Korea held a 17.9% share of 2025 value and grow at 5.18% a year. Japanese hospitals can now choose from demineralized matrix, ceramic and peptide grafts, while Korean developer CGBIO supplies growth factor grafts and completed early trials in Japan.
What shapes demand in Oceania and the remaining region?
Oceania and Remaining Asia Pacific held a 6.0% share of 2025 value and grows at 5.88% a year, because private hospitals in Australia fund most spinal fusion surgery. Private hospitals handled 83% of lumbar fusion admissions in the latest national atlas. VB Spine took over Stryker's spinal implants business in Australia and New Zealand in July 2025.
Graft approvals, supply deals and new bone banks since 2025
| Development | Status and market relevance |
|---|---|
| In February 2025, Johnson & Johnson signed an exclusive deal with CGBIO to distribute NOVOSIS in Korea, Taiwan, Thailand, India, Hong Kong and Macau. | Extends a growth factor graft across six Asian markets |
| In July 2025, VB Spine completed the move of Stryker's spinal implants business in Australia and New Zealand. | Keeps LifeHealthcare as the exclusive local distributor |
| In December 2025, CK Birla Hospitals opened a bone bank at CMRI Kolkata for spinal fusion and other surgery. | Adds local allograft supply in Eastern India |
| In February 2026, Japan approved Menicon's Verte bone regeneration material after a lumbar fusion study. | Adds a peptide-based option for graft use |
| In May 2026, DePuy Synthes gained exclusive Australian rights to the NOVOSIS graft. | Prepares growth factor graft entry in Oceania |
Ceramic scaffolds, matrices and protein carriers shape use
- Osteoconductive scaffolds such as beta-tricalcium phosphate and hydroxyapatite give new bone a frame to grow on, which suits hospitals that lack donor tissue.
- Osteoinductive matrices such as demineralized bone matrix contain natural proteins that signal bone growth, which helps surgeons extend limited local bone.
- Protein carriers release rhBMP-2 slowly from a ceramic base, which aims to support fusion while limiting unwanted bone growth outside the target area.
- Self-assembling peptide gels form a scaffold once implanted, which lets new bone form in fusion procedures without relying on donor tissue.
Need a Custom Version of This Report?
Tailor the scope, geography, or segments to your exact requirements.
- Custom geography or segment scope
- Direct access to our analyst team
Device makers compete through graft range and partners
Competition in spine biologics combines global device makers with Korean, Japanese and Chinese graft developers and local tissue banks. Medtronic launched the Grafton demineralized bone matrix in Japan in 2019 as the first product of its kind there. DePuy Synthes, part of Johnson & Johnson, holds exclusive rights to distribute CGBIO's NOVOSIS growth factor graft in six Asian markets and in Australia. Globus Medical sells allograft and synthetic biologics and earns a significant part of its foreign revenue in Japan and Australia. Highridge Medical counts Japan as its second-largest market, according to a September 2025 interview with its chief executive published by H.I.G. Capital, the private equity firm that owns the company today. Stryker moved its spinal implants business in Australia and New Zealand to VB Spine in July 2025. Companies compete on product range, clinical data and local distribution partners that reach surgeons.
Companies profiled and their roles in this market
| Company | Type | Role in the market |
|---|---|---|
| Medtronic | Global device maker | Launched the Grafton demineralized bone matrix in Japan in 2019 |
| DePuy Synthes | Global device maker | Distributes the NOVOSIS growth factor graft in six Asian markets and Australia |
| Globus Medical | Global device maker | Sells allograft and synthetic biologics with key foreign sales in Japan and Australia |
| Highridge Medical | Spine specialist | Counts Japan as its second-largest market for spine products |
| Stryker | Global device maker | Exiting spinal implants in Australia and New Zealand, where VB Spine took over the business in July 2025 |
Credence Research view on regional bone graft demand
Credence Research's view is that spine biologics demand in Asia Pacific will grow steadily because aging populations need more fusion surgery and new graft types are reaching the region. Synthetic grafts stay the largest product group, while growth factor grafts grow fastest as Korean developers sign distribution deals. Mainland China keeps the largest share, and India and Southeast Asia grow fastest as insurance and bone banks widen access. However, tender pricing and evidence demands will slow premium products. Suppliers that pair clinical data with strong local partners should gain share fastest.
How the regional bone graft estimate was built
The report uses 2025 as the base year on a calendar basis, and market values come from the Credence Research model. That model combines surgical volumes, tender demand, population aging statistics, product approvals and company information on distribution and product range. Segment splits and sub-regional growth rates are Credence Research estimates, while sub-regional shares follow the client-defined split. Sources used are official statistics, regulator documents, company releases, annual reports and news reports, and no interviews or surveys were used.
Aging, new graft types and partners carry growth to 2035
Regional spine biologics value is expected to reach USD 834.0 million by 2035, a 6.60% CAGR during 2026–2035, as more older patients undergo fusion surgery. Growth should be steady through 2030 while protein-based and peptide grafts complete approvals in China, Japan and Australia. After that, wider bone bank networks and insurance for older adults in India should add volume. Faster approvals of protein and peptide grafts would raise this outlook, while deeper tender price cuts in China or slower tissue bank growth would lower it.
Frequently Asked Questions
How big is the Asia Pacific spine biologics market?
Which product type leads regional demand?
Which sub-region leads the regional market?
How does population aging affect demand?
What new graft materials are reaching the region?
Which sales channel leads the market?
Who are the leading companies in the region?
What are the main challenges for suppliers?
Table of Content
Chapter 1 Market Segmentation
- 1.1 Segmentation Framework
- 1.1.1 Product and Service Classification
- 1.1.2 Application and End-Use Classification
- 1.1.3 Technology and Solution Classification
- 1.1.4 Customer and Distribution Channel Classification
- 1.1.5 Geographic Segmentation
- 1.1.6 Market Segment Definitions and Boundaries
- 1.2 By Product Type
- 1.2.1 Allograft Products
- 1.2.2 Synthetic Graft Products
- 1.2.3 Growth Factor Graft Products
- 1.2.4 Cellular and Combination Graft Products
- 1.3 By Care Setting
- 1.3.1 Hospitals
- 1.3.2 Ambulatory Surgery Centers
- 1.3.3 Specialty Spine Clinics
- 1.4 By Disease Area
- 1.4.1 Degenerative Spinal Conditions
- 1.4.2 Spinal Deformity
- 1.4.3 Revision and Reconstructive Conditions
- 1.5 By Sales Channel
- 1.5.1 Direct Manufacturer Contracts
- 1.5.2 Specialist Distributor Sales
- 1.5.3 Tender-Led Supply
- 1.6 By Sub-region
- 1.6.1 Mainland China
- 1.6.2 Japan and South Korea
- 1.6.3 India and Southeast Asia
- 1.6.4 Oceania and Remaining Asia Pacific
Chapter 2 Introduction
- 2.1 Report Objectives and Scope
- 2.2 Product Definition and Industry Terminology
- 2.3 Market Inclusions and Exclusions
- 2.4 Research Process
- 2.4.1 Primary Research and Expert Interviews
- 2.4.2 Secondary Research and Source Review
- 2.4.3 Top-Down and Bottom-Up Estimation
- 2.4.4 Data Triangulation and Verification
- 2.5 Market Size Measurement Basis
- 2.5.1 2025: USD 439.5 million → 2035: USD 834.0 million
- 2.6 Historical and Forecast Reference Periods
- 2.6.1 Historical Period: 2018-2025
- 2.6.2 Base Year: 2025
- 2.6.3 Forecast Period: 2025-2035
- 2.7 Research Assumptions and Limitations
Chapter 3 Executive Summary
- 3.1 Market Snapshot and Key Findings
- 3.2 Base-Year Market Size, 2025
- 3.3 Forecast Market Size, 2035
- 3.4 Revenue and Volume Growth Outlook
- 3.5 Key Demand and Supply Indicators
- 3.6 Leading Market Segments
- 3.7 Fastest-Growing Market Opportunities
- 3.8 Regional Performance Highlights
- 3.9 Technology and Industry Transformation
- 3.10 Competitive Landscape Summary
- 3.11 Analyst View and Strategic Implications
Chapter 4 Asia Pacific Spine Biologics Market Trends and Developments
- 4.1 Historical Industry Development, 2018-2025
- 4.2 Recent Market Trends and Developments
- 4.3 Demand and Customer Behavior Trends
- 4.4 Technology and Product Innovation
- 4.5 Artificial Intelligence, Automation and Digitalization
- 4.6 Local Manufacturing and Supply Chain Realignment
- 4.7 Industry Partnerships, Mergers and Acquisitions
- 4.8 Sustainability and Circular Economy Developments
- 4.9 Government and Private Sector Investment Trends
- 4.10 Emerging Business Models and Commercialization
- 4.11 Industry Developments and Announcements
Chapter 5 Asia Pacific Spine Biologics Market Production, Supply and Demand Analysis
- 5.1 Demand Trend and Consumption Analysis, 2018-2025
- 5.2 Demand Forecast, 2025-2035
- 5.3 Production and Output Trend, 2018-2025
- 5.4 Production and Output Forecast, 2025-2035
- 5.5 Installed Capacity and Capacity Utilization
- 5.6 Company-Wise Production Plants and Statistics
- 5.6.1 Installed Production Capacity
- 5.6.2 Actual Production
- 5.6.3 Planned Capacity and Expansion Targets
- 5.7 Supply Chain Structure and Procurement Trends
- 5.8 Supply-Demand Gap and Bottlenecks
- 5.9 Import Dependence and Sourcing Structure
- 5.10 Contract Manufacturing and Outsourcing
- 5.11 Regional Supply and Demand Concentration
Chapter 6 Asia Pacific Spine Biologics Market Pricing Analysis
- 6.1 Pricing Structure and Measurement
- 6.2 Historical Pricing Trends, 2018-2025
- 6.3 Pricing Outlook, 2025-2035
- 6.4 Average Selling Price and Unit Economics
- 6.5 Pricing by Product and Market Segment
- 6.6 Geographic Pricing Differences
- 6.7 Key Input, Energy, Labor and Logistics Costs
- 6.8 Contract Pricing and Purchasing Models
- 6.9 Pricing Sensitivity and Competitive Positioning
- 6.10 Price, Margin and Profitability Implications
Chapter 7 Asia Pacific Spine Biologics Market Dynamics
- 7.1 Market Growth Drivers
- 7.1.1 Demand-Side Drivers
- 7.1.2 Technology and Innovation Drivers
- 7.1.3 Infrastructure and Investment Drivers
- 7.1.4 Regulatory and Policy Drivers
- 7.2 Market Restraints
- 7.2.1 Cost and Affordability Constraints
- 7.2.2 Technology and Adoption Barriers
- 7.2.3 Supply Chain and Operational Constraints
- 7.3 Market Challenges
- 7.3.1 Competitive Pressure and Margin Erosion
- 7.3.2 Skills, Infrastructure and Implementation Gaps
- 7.4 Emerging Market Opportunities
- 7.5 Market Dynamics Impact and Time-Horizon Assessment
Chapter 8 Asia Pacific Spine Biologics Value Chain Analysis
- 8.1 Industry Value Chain Overview
- 8.2 Upstream Suppliers and Critical Inputs
- 8.3 Technology and Component Providers
- 8.4 Manufacturing or Service Delivery
- 8.5 Distribution, Channel Partners and Integrators
- 8.6 Downstream Applications and End Users
- 8.7 Value Addition and Profit Pools
- 8.8 Vertical Integration and Outsourcing
- 8.9 Supplier Concentration and Risk
- 8.10 Supply Chain Localization and Resilience
Chapter 9 Asia Pacific Spine Biologics Market Regulations and Policies
- 9.1 Relevant Laws, Standards and Compliance Frameworks
- 9.2 Product, Service, Safety and Quality Requirements
- 9.3 Government Policies, Incentives and Subsidies
- 9.4 Imports, Exports and Trade Barriers
- 9.5 Public Procurement and Local Content Requirements
- 9.6 Environmental and Sustainability Compliance
- 9.7 Upcoming Policy Changes and Market Implications
Chapter 10 Asia Pacific Spine Biologics Market Hotspots and Opportunities
- 10.1 Market Opportunity Mapping and Growth Hotspots
- 10.2 High-Growth Applications and Customer Groups
- 10.3 Underserved Markets and White-Space Opportunities
- 10.4 Emerging Technology and Product Opportunities
- 10.5 New Capacity and Investment Hotspots
- 10.6 Market Entry and Expansion Opportunities
- 10.7 Distribution and Partnership Opportunities
- 10.8 Near-Term and Long-Term Commercial Potential
- 10.9 Opportunity Attractiveness and Execution Risks
Chapter 11 Asia Pacific Spine Biologics Market Outlook, 2025-2035
- 11.1 Market Size and Analysis
- 11.1.1 Revenue (Market Measurement: 2025: USD 439.5 million → 2035: USD 834.0 million)
- 11.1.2 Market Volume and Quantity Sold
- 11.1.3 Historical Market Size, 2018-2025
- 11.1.4 Base-Year Market Size, 2025
- 11.2 Market Forecast, 2025-2035
- 11.2.1 Revenue Forecast to 2035
- 11.2.2 Volume Forecast to 2035
- 11.2.3 CAGR and Year-on-Year Growth
- 11.2.4 Incremental Revenue Opportunity
- 11.3 Forecast Assumptions and Scenario Analysis
- 11.3.1 Base-Case Forecast
- 11.3.2 Optimistic and Conservative Scenarios
- 11.3.3 Technology, Pricing and Policy Sensitivities
- 11.4 Market Attractiveness and Growth Outlook
Chapter 12 Asia Pacific Spine Biologics Market Segmentation and Outlook
- 12.1 Segmentation Summary and Market Shares, 2025
- 12.2 Largest and Fastest-Growing Segments
- 12.3 By Product Type - Market Size and Forecast, 2025-2035
- 12.3.1 Segment Definition and Scope
- 12.3.2 Historical Market Size, 2018-2025
- 12.3.3 Revenue Forecast, 2025-2035
- 12.3.4 Volume Forecast, 2025-2035
- 12.3.5 Base-Year Market Share, 2025
- 12.3.6 Segment CAGR and Growth Drivers
- 12.3.7 Subsegment Market Size and Forecast
- 12.3.7.1 Allograft Products
- 12.3.7.2 Synthetic Graft Products
- 12.3.7.3 Growth Factor Graft Products
- 12.3.7.4 Cellular and Combination Graft Products
- 12.3.8 Subsegment Pricing and Adoption Trends
- 12.3.9 Leading Suppliers and Competition
- 12.3.10 Regional Demand and Opportunities
- 12.4 By Care Setting - Market Size and Forecast, 2025-2035
- 12.4.1 Segment Definition and Scope
- 12.4.2 Historical Market Size, 2018-2025
- 12.4.3 Revenue Forecast, 2025-2035
- 12.4.4 Volume Forecast, 2025-2035
- 12.4.5 Base-Year Market Share, 2025
- 12.4.6 Segment CAGR and Growth Drivers
- 12.4.7 Subsegment Market Size and Forecast
- 12.4.7.1 Hospitals
- 12.4.7.2 Ambulatory Surgery Centers
- 12.4.7.3 Specialty Spine Clinics
- 12.4.8 Subsegment Pricing and Adoption Trends
- 12.4.9 Leading Suppliers and Competition
- 12.4.10 Regional Demand and Opportunities
- 12.5 By Disease Area - Market Size and Forecast, 2025-2035
- 12.5.1 Segment Definition and Scope
- 12.5.2 Historical Market Size, 2018-2025
- 12.5.3 Revenue Forecast, 2025-2035
- 12.5.4 Volume Forecast, 2025-2035
- 12.5.5 Base-Year Market Share, 2025
- 12.5.6 Segment CAGR and Growth Drivers
- 12.5.7 Subsegment Market Size and Forecast
- 12.5.7.1 Degenerative Spinal Conditions
- 12.5.7.2 Spinal Deformity
- 12.5.7.3 Revision and Reconstructive Conditions
- 12.5.8 Subsegment Pricing and Adoption Trends
- 12.5.9 Leading Suppliers and Competition
- 12.5.10 Regional Demand and Opportunities
- 12.6 By Sales Channel - Market Size and Forecast, 2025-2035
- 12.6.1 Segment Definition and Scope
- 12.6.2 Historical Market Size, 2018-2025
- 12.6.3 Revenue Forecast, 2025-2035
- 12.6.4 Volume Forecast, 2025-2035
- 12.6.5 Base-Year Market Share, 2025
- 12.6.6 Segment CAGR and Growth Drivers
- 12.6.7 Subsegment Market Size and Forecast
- 12.6.7.1 Direct Manufacturer Contracts
- 12.6.7.2 Specialist Distributor Sales
- 12.6.7.3 Tender-Led Supply
- 12.6.8 Subsegment Pricing and Adoption Trends
- 12.6.9 Leading Suppliers and Competition
- 12.6.10 Regional Demand and Opportunities
- 12.7 By Sub-region - Market Size and Forecast, 2025-2035
- 12.7.1 Segment Definition and Scope
- 12.7.2 Historical Market Size, 2018-2025
- 12.7.3 Revenue Forecast, 2025-2035
- 12.7.4 Volume Forecast, 2025-2035
- 12.7.5 Base-Year Market Share, 2025
- 12.7.6 Segment CAGR and Growth Drivers
- 12.7.7 Subsegment Market Size and Forecast
- 12.7.7.1 Mainland China
- 12.7.7.2 Japan and South Korea
- 12.7.7.3 India and Southeast Asia
- 12.7.7.4 Oceania and Remaining Asia Pacific
- 12.7.8 Subsegment Pricing and Adoption Trends
- 12.7.9 Leading Suppliers and Competition
- 12.7.10 Regional Demand and Opportunities
- 12.8 Segment Growth Comparison
- 12.9 Segment Attractiveness and Priority Matrix
Chapter 13 Asia Pacific Spine Biologics Geographic Market Outlook, 2025-2035
- 13.1 Regional Market Size and Country-Level Shares, 2025
- 13.2 Country Market Size Comparison, 2025
- 13.3 Country Market Forecasts, 2025-2035
- 13.4 Subregional Industrial and Demand Clusters
- 13.5 Intra-Regional Pricing and Cost Differences
- 13.6 Cross-Border Trade and Supply Networks
- 13.7 Regional Supply and Demand Balances
- 13.8 Country Opportunity Comparison and Prioritization
Note: Every listed country is covered on the structure shown under the first country.
Chapter 14 Asia Pacific Spine Biologics Technology, Innovation and Sustainability Outlook
- 14.1 Technology Landscape and Maturity
- 14.2 Product, Process and Service Innovation
- 14.3 AI, Automation and Digital Tools in the Industry
- 14.4 Technology Adoption and Performance Benchmarking
- 14.5 Innovation Pipeline and R&D Investment
- 14.6 Patent and Intellectual Property Trends
- 14.7 Energy Efficiency and Resource Management
- 14.8 Sustainability, Recycling and Circularity
- 14.9 Technology Roadmap, 2025-2035
- 14.10 Risks of Obsolescence and Technology Substitution
Chapter 15 Asia Pacific Spine Biologics Market Key Strategic Imperatives
- 15.1 Growth and Market Entry Priorities
- 15.2 High-Return Products and Segments
- 15.3 Pricing, Profitability and Cost Optimization
- 15.4 Technology Investment and Product Differentiation
- 15.5 Supply Chain Localization and Resilience
- 15.6 Distribution and Customer Acquisition
- 15.7 Partnership, Acquisition and Capacity Strategy
- 15.8 Regional Expansion Priorities
- 15.9 Short-, Medium- and Long-Term Actions
Chapter 16 Competition Outlook
- 16.1 Industry Competition Characteristics
- 16.2 Market Structure and Concentration
- 16.3 Market Share and Competitive Positioning, 2025
- 16.4 Company-Wise Revenue and Product Benchmarking
- 16.5 Production and Service Capacity Benchmarking
- 16.6 Technology, Pricing and Differentiation
- 16.7 Regional Footprint and Distribution Strength
- 16.8 Mergers, Acquisitions and Strategic Alliances
- 16.9 New Entrants and Competitive Threats
- 16.10 Porter's Five Forces and Industry Attractiveness
- 16.11 Competitive Outlook, 2025-2035
Chapter 17 Company Profiles
- 17.1 Company Coverage and Selection Criteria
- 17.2 Medtronic
- 17.2.1 Business Description
- 17.2.2 Company Ownership and Geographic Presence
- 17.2.3 Product and Service Portfolio
- 17.2.4 Manufacturing and Operating Footprint
- 17.2.5 Production Capacity and Expansion Plans
- 17.2.6 Financial Performance and Investment
- 17.2.7 Market Share and Competitive Position
- 17.2.8 Technology and Innovation Capabilities
- 17.2.9 Strategic Alliances or Partnerships
- 17.2.10 Recent Developments
- 17.2.11 Growth Strategy and Outlook
- 17.3 DePuy Synthes
- 17.4 Globus Medical
- 17.5 Stryker
- 17.6 Highridge Medical
- 17.7 Other Relevant Market Participants
Note: Every listed company is profiled on the structure shown under the first company. The company list is preliminary and may change based on research findings, market developments, data availability and client requirements.
Chapter 18 Disclaimer
- 18.1 Research and Forecast Disclaimer
- 18.2 Data Source and Estimation Limitations
Note: The depth of individual sections depends on data availability for this market. Volume, capacity, trade and other unit-based metrics are included where applicable.

