Market Overview
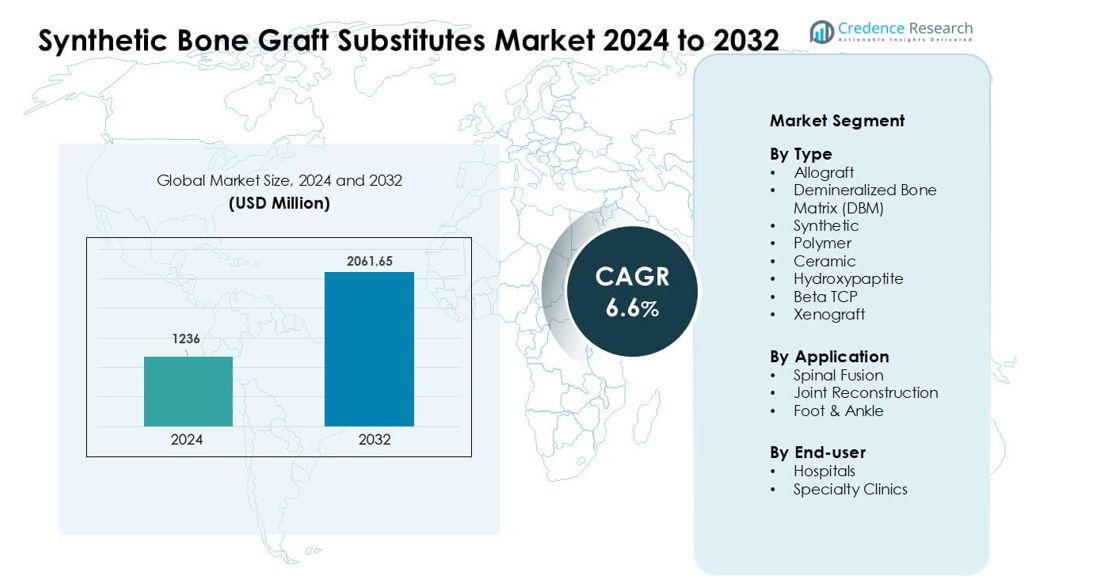
Synthetic Bone Graft Substitutes Market was valued at USD 1236 million in 2024 and is anticipated to reach USD 2061.65 million by 2032, growing at a CAGR of 6.6 % during the forecast period.
| REPORT ATTRIBUTE |
DETAILS |
| Historical Period |
2020-2023 |
| Base Year |
2024 |
| Forecast Period |
2025-2032 |
Synthetic Bone Graft Substitutes Market Size 2024
|
USD 1236 million |
| Synthetic Bone Graft Substitutes Market, CAGR |
6.6% |
| Synthetic Bone Graft Substitutes Market Size 2032 |
USD 2061.65 million |
Top players in the Synthetic Bone Graft Substitutes Market include Stryker, Smith & Nephew, Bioventus, Zimmer Biomet, MTF Biologics, Orthofix Holdings, Medtronic, SeaSpine, DePuy Synthes, and AlloSource, each offering advanced ceramic, polymer, and hybrid graft solutions. These companies strengthen the market through continuous biomaterial innovation, expanded clinical applications, and partnerships with major healthcare providers. North America emerged as the leading region in 2024 with a 38% share, driven by high orthopedic procedure volumes, rapid adoption of synthetic substitutes, and strong presence of specialized surgical centers.
Market Insights
- The Synthetic Bone Graft Substitutes Market was valued at USD 1236 million in 2024 and is projected to reach USD 2061.65 million by 2032, growing at a CAGR of 6.6 % during the forecast period.
- Demand increased as surgeons preferred synthetic grafts for predictable quality and reduced infection risks, with the synthetic segment holding the largest share in 2024.
- Trends include wider use of bioactive ceramics, polymer-ceramic hybrids, and 3D-printed grafts that offer better integration and patient-specific shaping.
- Competition intensified as key players expanded portfolios, enhanced biomaterial performance, and partnered with hospitals to support advanced spine and joint reconstruction procedures.
- North America led the market with 38% share in 2024 due to high orthopedic surgery volumes, while spinal fusion remained the dominant application segment globally.
Access crucial information at unmatched prices!
Request your sample report today & start making informed decisions powered by Credence Research Inc.!
Download Sample
Market Segmentation Analysis:
By Type
Synthetic bone grafts led the type segment in 2024 with about 38% share due to strong demand for consistent quality, controlled porosity, and reduced infection risk. Hospitals preferred synthetic options because they eliminate donor-site issues linked to allografts and xenografts. Ceramic materials, including hydroxylapatite and beta-TCP, gained steady use in complex orthopedic repairs, but their adoption stayed lower than synthetics because surgeons sought faster resorption profiles and better handling features. Polymer grafts expanded in minimally invasive cases, yet their share remained modest due to limited load-bearing performance.
- For instance, the Vitoss® synthetic graft line is a popular bone graft solution from Stryker Corporation, which, according to a 2016 industry report, had seen approximately 425,000 implantations worldwide at that time, reflecting broad acceptance among hospitals and surgeons for synthetic bone substitutes.
By Application
Spinal fusion dominated the application segment in 2024 with nearly 54% share, driven by rising spinal degeneration cases and higher surgical volumes among older adults. Surgeons used synthetic grafts to improve fusion stability and reduce complications from autograft harvesting. Joint reconstruction procedures showed steady growth due to expanding knee and hip revision surgeries, but they held a smaller share than spinal fusion because fusion procedures required larger graft volumes. Foot and ankle reconstruction advanced with demand from sports injuries, though adoption remained lower due to smaller procedure counts.
- For instance, the adoption of novel bone graft substitutes and osteoinductive biologics, such as Infuse™ (recombinant human bone morphogenetic protein-2 or rhBMP-2), has been one of many contributing factors—alongside improved surgical techniques and an aging population—behind the increasing procedural load in spinal fusion surgeries worldwide.
By End-User
Hospitals held the leading share in 2024 with about 61%, supported by higher orthopedic surgery volumes, advanced imaging, and wider access to specialized graft materials. Large hospitals preferred synthetic and ceramic grafts because they met strict sterility, traceability, and regulatory standards. Specialty clinics expanded their use of bone graft substitutes as outpatient orthopedic procedures increased, but their share stayed smaller than hospitals due to limited inventories and fewer high-complexity spine cases. Rising patient preference for minimally invasive care helped clinics adopt polymer-based options, though hospital settings remained the dominant end-user.
Key Growth Drivers:
Rising Orthopedic and Spinal Surgery Volumes
Growing global cases of fractures, spinal degeneration, and joint disorders continue to raise demand for synthetic bone graft substitutes. Many countries report steady increases in trauma and spinal procedures due to aging populations and higher accident rates. Surgeons favor synthetic grafts because they offer predictable quality, controlled resorption, and reduced infection concerns compared to donor-derived materials. The shift toward spinal fusion and complex reconstruction adds further momentum, as these procedures require stable, high-performance grafting solutions. Expanding access to orthopedic care in emerging regions strengthens long-term growth, especially where hospitals upgrade surgical suites and adopt standardized grafting protocols.
- For instance, the company NuVasive markets a synthetic graft substitute called AttraX putty this product has been used in spinal fusion procedures and was highlighted in a recent review that documented its success in a clinical trial involving 100 patients undergoing posterolateral fusion.
Advantages Over Traditional Allografts and Autografts
Synthetic substitutes gain rapid acceptance because they address key limitations linked to autografts and allografts. Donor-site pain, limited tissue availability, and risk of disease transmission encourage surgeons to choose synthetic options with consistent structure and supply. Advances in materials engineering, including bioactive ceramics and polymer composites, improve osteoconductivity and handling during surgery. This reliability allows hospitals to streamline inventory and reduce complications tied to variable donor tissue quality. Growing preference for minimally invasive procedures also supports synthetic graft adoption, as these materials adapt well to smaller incisions and targeted placements without requiring complex preparation steps.
- For instance, a systematic review comparing synthetic grafts (hydroxyapatite, β‑TCP/HA, PMMA and polymer‑based osteoconductive materials) vs autograft/allograft in spinal fusion found that synthetic grafts avoid donor‑site morbidity and eliminate the need for harvesting procedures advantages that directly reduce patient risk and simplify surgical logistics.
Advancements in Biomaterials and 3D Printing
Rapid improvements in biomaterial technology expand performance and clinical acceptance of synthetic graft substitutes. New porous ceramics, hybrid polymers, and bioactive coatings enhance bone regeneration, mechanical strength, and integration speed. 3D printing technologies now allow patient-specific graft shapes for complex bone defects or revision surgeries, reducing operative time and improving fit. Manufacturers increasingly develop composite structures that mimic natural bone, offering better load distribution and faster healing. These innovations support broader clinical use across spine, trauma, and reconstructive procedures while encouraging hospitals to upgrade to advanced graft systems with greater predictability and customization.
Key Trend & Opportunity:
Growth of Minimally Invasive Orthopedic Procedures
Minimally invasive spine and joint surgeries continue to expand, creating strong opportunities for synthetic graft substitute adoption. Surgeons prefer lightweight, moldable, and fast-resorbing materials that fit through smaller access points without compromising stability. Manufacturers respond by developing finer granules, injectable pastes, and polymer-ceramic hybrids suitable for targeted delivery. As outpatient orthopedic centers increase procedure volumes, synthetic grafts gain wider use due to shorter preparation time, consistent quality, and lower contamination risk. This trend strengthens demand across spinal fusion, sports injury repair, and foot-ankle reconstruction, especially where faster recovery remains a priority for patients.
- For instance, a recent market industry report noted that the global synthetic injectable bone graft segment, which is especially suited for minimally invasive and percutaneous procedures, had an estimated market value of USD 630.98 million in 2024. Another report estimated the total injectable bone graft substitute market (including natural types like allografts and DBM) was valued at a much higher figure of USD 2.74 billion in 2024.
Growing Adoption in Emerging Healthcare Markets
Improving healthcare infrastructure in Asia-Pacific, Latin America, and parts of the Middle East creates new pathways for market expansion. Hospitals in developing regions invest in advanced surgical equipment and standardized orthopedic care, encouraging wider use of synthetic grafts over donor-limited allografts. Rising road accidents, aging populations, and expanding insurance coverage increase orthopedic and trauma surgery rates. Manufacturers benefit from untapped demand for cost-effective synthetic materials with predictable performance, especially ceramic grafts that offer strong osteoconductive properties. Training programs for surgeons and collaborations with regional distributors further accelerate adoption across high-growth markets.
- For instance, in the Asia‑Pacific region which is a major emerging market the bone grafts & substitutes market was estimated at USD 662.4 million in 2024, reflecting strong demand for graft substitutes (synthetic among them) as orthopedic procedures rise.
Key Challenge:
High Cost of Advanced Synthetic Graft Materials
Many advanced biomaterials, including composite ceramics and polymer-ceramic hybrids, remain costly for smaller hospitals and emerging markets. These higher prices limit adoption compared to traditional allografts, which often seem more affordable despite their limitations. Cost concerns also affect outpatient centers that must balance material performance with budget constraints. Reimbursement gaps in several countries slow procurement of premium graft substitutes, forcing providers to rely on older or lower-quality options. Manufacturers face pressure to reduce prices while maintaining safety and performance standards, creating ongoing challenges for wider global penetration.
Limited Long-Term Clinical Evidence in Certain Applications
Although synthetic grafts continue to expand rapidly, some surgeons remain cautious due to limited long-term clinical data in complex load-bearing applications. Concerns involve resorption timing, mechanical strength, and long-term integration compared to well-studied autografts. Variations in material properties among manufacturers also create inconsistencies in clinical outcomes. Regulatory bodies demand robust evidence, extending approval timelines for next-generation biomaterials. These gaps slow adoption in high-risk procedures, especially revision surgeries where failure rates carry greater consequences. Strengthening long-term research and post-market studies remains essential for broader clinical confidence.
Regional Analysis
North America
North America held the leading position in 2024 with about 38% share, supported by high orthopedic procedure volumes, strong adoption of synthetic graft materials, and advanced surgical infrastructure. The United States drove most demand due to rising spinal fusion and joint reconstruction cases alongside rapid uptake of 3D-printed grafts. Hospitals in the region preferred synthetic and ceramic substitutes for their consistent quality and reduced infection risk. Favorable reimbursement for spinal and trauma procedures further strengthened market growth, while ongoing biomaterial innovations encouraged surgeons to shift from donor-derived grafts to more predictable synthetic alternatives.
Europe
Europe accounted for nearly 29% share in 2024, driven by growing orthopedic care demand and strong clinical acceptance of ceramic and polymer-based graft substitutes. Germany, France, and the U.K. led adoption due to higher spine surgery rates and broader access to minimally invasive orthopedic procedures. The region’s strict regulatory focus on safety and traceability supported the rise of synthetic materials over allografts. Increasing investments in bone regeneration research and wider availability of customizable graft shapes further enhanced uptake. Expanding aging populations and rising osteoporosis-related fractures strengthened long-term regional demand.
Asia-Pacific
Asia-Pacific captured about 23% share in 2024 and remained the fastest-growing region due to rapid healthcare expansion and increasing orthopedic surgery rates. China, India, and Japan drove demand as hospitals upgraded surgical capabilities and adopted synthetic grafts to address limited donor tissue availability. Rising trauma cases, expanding insurance coverage, and greater access to spine and joint reconstruction procedures boosted adoption. Manufacturers targeted the region with cost-effective ceramic and hybrid graft options suitable for diverse clinical settings. Growing medical tourism in Southeast Asia also contributed to rising procedure volumes and broader market penetration.
Latin America
Latin America held roughly 6% share in 2024, supported by expanding orthopedic services in Brazil, Mexico, and Argentina. Hospitals increasingly adopted synthetic substitutes to reduce infection risks associated with donor tissue and improve supply reliability. Rising fracture and trauma cases from road accidents boosted demand, especially in urban centers with advanced surgical facilities. However, slower reimbursement processes and cost constraints limited uptake of premium biomaterials. Growing investments in private healthcare and surgeon training programs encouraged steady penetration of ceramic and polymer-based grafts across major metropolitan regions.
Middle East & Africa
The Middle East & Africa region accounted for nearly 4% share in 2024, driven by growing demand for spinal and trauma procedures in Gulf countries. Investments in advanced orthopedic centers in the UAE, Saudi Arabia, and Qatar supported wider adoption of synthetic graft substitutes. Limited availability of donor tissue further encouraged hospitals to shift toward ceramics and hybrid polymers. In Africa, adoption grew slowly due to budget constraints and uneven access to specialized surgical care. However, rising urbanization and incremental upgrades to hospital infrastructure supported gradual market expansion across selected countries.
Market Segmentations:
By Type
- Allograft
- Demineralized Bone Matrix (DBM)
- Synthetic
- Polymer
- Ceramic
- Hydroxypaptite
- Beta TCP
- Xenograft
By Application
- Spinal Fusion
- Joint Reconstruction
- Foot & Ankle
By End-user
- Hospitals
- Specialty Clinics
By Geography
- North America
- Europe
- Germany
- France
- U.K.
- Italy
- Spain
- Rest of Europe
- Asia Pacific
- China
- Japan
- India
- South Korea
- South-east Asia
- Rest of Asia Pacific
- Latin America
- Brazil
- Argentina
- Rest of Latin America
- Middle East & Africa
- GCC Countries
- South Africa
- Rest of the Middle East and Africa
Competitive Landscape
The competitive landscape of the Synthetic Bone Graft Substitutes Market features active participation from leading orthopedic and biomaterial manufacturers that focus on innovation, regulatory compliance, and clinical performance. Companies such as Stryker, Smith & Nephew, Bioventus, Zimmer Biomet, MTF Biologics, Orthofix Holdings, Medtronic, SeaSpine, DePuy Synthes, and AlloSource strengthen competition through broad product portfolios that include ceramics, polymer composites, and advanced hybrid grafts. Many players invest heavily in research to enhance osteoconductivity, resorption control, and biomechanical strength, driving steady upgrades across spinal fusion and joint reconstruction solutions. Strategic partnerships with hospitals and research institutions help validate clinical outcomes and support wider adoption. Manufacturers also expand in fast-growing regions through localized distribution networks, surgeon training programs, and cost-efficient product lines. Continuous advancements in 3D-printed grafts and personalized implants further elevate competition, with companies racing to deliver next-generation biomaterials that provide predictable healing, strong integration, and reduced complication rates.
Shape Your Report to Specific Countries or Regions & Enjoy 30% Off!
Key Player Analysis
- Stryker (U.S.)
- Smith & Nephew plc (U.K.)
- Bioventus (U.S.)
- Zimmer Biomet (U.S.)
- MTF Biologics (U.S.)
- Orthofix Holdings, Inc. (U.S.)
- Medtronic PLC (Ireland)
- SeaSpine (U.S.)
- DePuy Synthes Companies (Johnson & Johnson Services, Inc.) (U.S.)
- AlloSource (U.S.)
Recent Developments
- In March 2025, Smith & Nephew plc (U.K.) Showcased advanced orthopaedic reconstruction technologies (robotics, knee/hip systems and related surgical planning tools) at AAOS 2025; while this announcement focused on reconstruction/robotics, it signals continued company investment in surgical ecosystems that interface with bone grafting and biologics used during reconstruction procedures.
- In January 2025, Stryker (U.S.) Announced a definitive agreement to sell its U.S. spinal implants business (part of a broader portfolio reshaping); this strategic move affects how Stryker will position its spine and implant offerings going forward.
- In January 2025, Medtronic PLC Medtronic signed an exclusive five-year distribution agreement with Kuros Biosciences to sell MagnetOs, a ceramic synthetic bone graft substitute, in selected U.S. spine markets, expanding its synthetic graft portfolio and leveraging MagnetOs’ higher fusion rates versus autograft in clinical trial
Report Coverage
The research report offers an in-depth analysis based on Type, Application, End-User and Geography. It details leading market players, providing an overview of their business, product offerings, investments, revenue streams, and key applications. Additionally, the report includes insights into the competitive environment, SWOT analysis, current market trends, as well as the primary drivers and constraints. Furthermore, it discusses various factors that have driven market expansion in recent years. The report also explores market dynamics, regulatory scenarios, and technological advancements that are shaping the industry. It assesses the impact of external factors and global economic changes on market growth. Lastly, it provides strategic recommendations for new entrants and established companies to navigate the complexities of the market.
Future Outlook
- Demand for synthetic grafts will rise as surgeons shift from donor-derived materials.
- Bioactive ceramics and hybrid composites will gain wider clinical acceptance.
- 3D-printed, patient-specific grafts will become more common in complex reconstructions.
- Minimally invasive orthopedic procedures will increase the need for moldable and injectable graft formats.
- Advancements in regenerative biomaterials will enhance integration and shorten healing times.
- Hospitals will expand adoption due to predictable performance and simplified inventory management.
- Emerging markets will see faster uptake as orthopedic infrastructure improves.
- Companies will invest more in long-term clinical studies to strengthen regulatory approval.
- Price optimization and localized production will improve accessibility in cost-sensitive regions.
- Strategic partnerships between manufacturers and surgical centers will accelerate innovation and adoption.


