
Market Overview
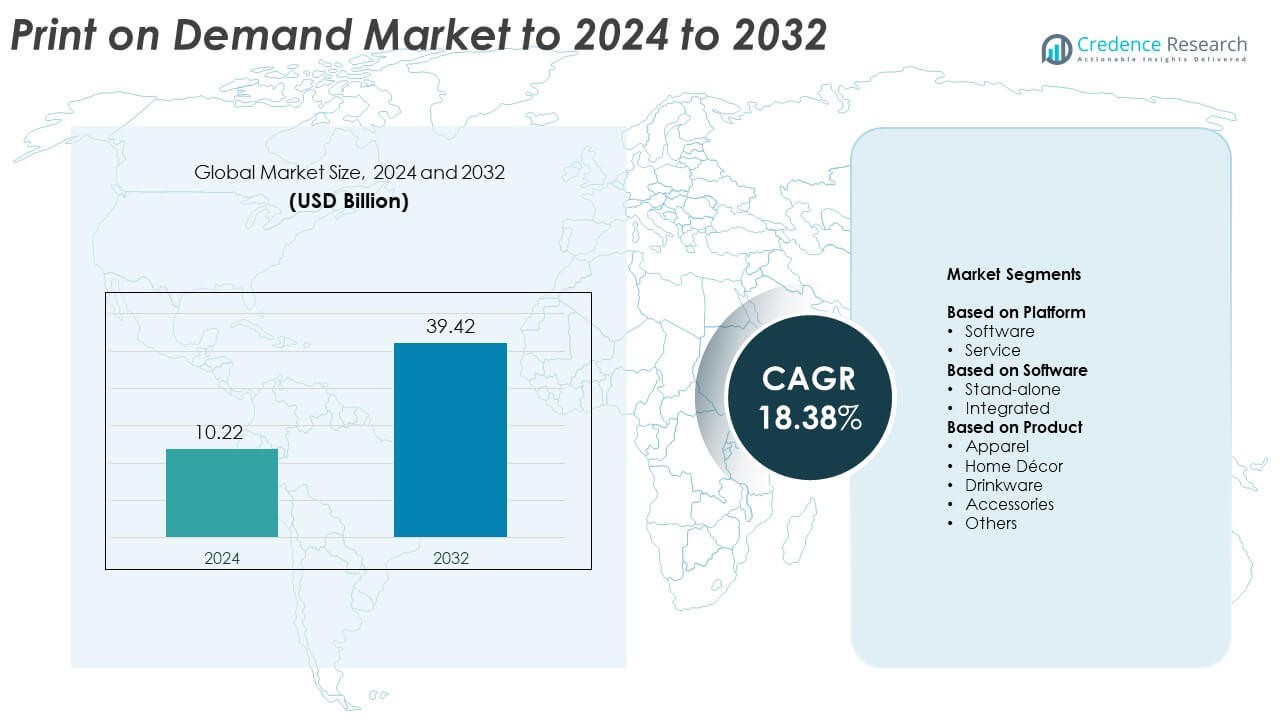
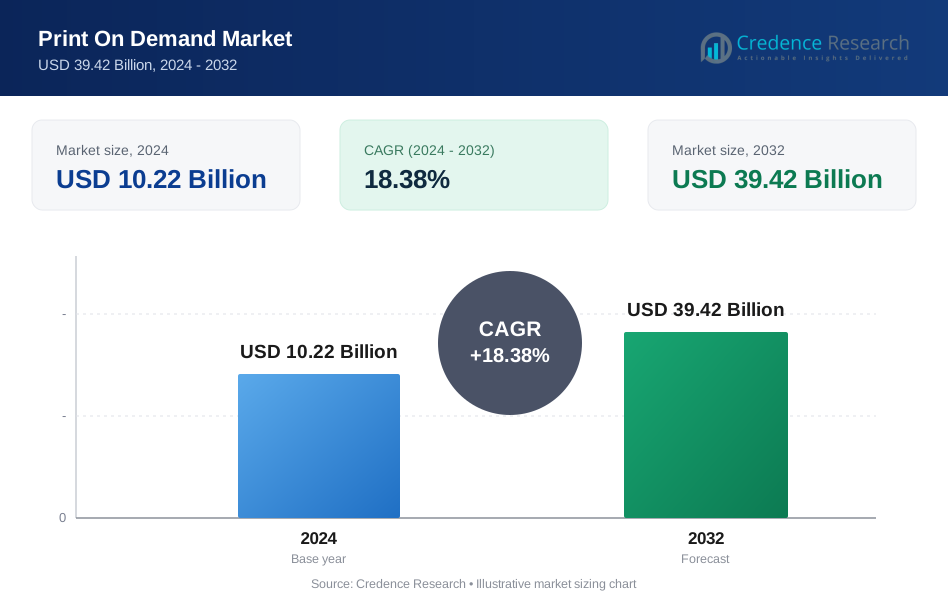
Print On Demand Market size was valued USD 10.22 Billion in 2024 and is anticipated to reach USD 39.42 Billion by 2032, at a CAGR of 18.38% during the forecast period.
| REPORT ATTRIBUTE | DETAILS |
|---|---|
| Historical Period | 2020-2023 |
| Base Year | 2024 |
| Forecast Period | 2025-2032 |
| Print On Demand Market Size 2024 | USD 10.22 Billion |
| Print On Demand Market, CAGR | 18.38% |
| Print On Demand Market Size 2032 | USD 39.42 Billion |
The print on demand market features major players such as Gooten, Printify, Apliiq, Creator Studio, JetPrint Fulfillment, CustomCat, VistaPrint, Amplifier, Printed Mint, Printful, and Gelato, all competing through wider product ranges, stronger automation, and faster global fulfilment. These companies support creators, small brands, and enterprises by offering integrated design tools, scalable production, and multi-location printing. North America leads the market with about 36.2% share due to advanced e-commerce adoption and strong platform presence, while Asia Pacific follows with nearly 29.3% share driven by rapid digital retail growth and expanding manufacturing capabilities.
Market Insights
- The print on demand market reached USD 10.22 Billion in 2024 and is projected to hit USD 39.42 Billion by 2032, growing at a CAGR of 18.38% during the forecast period.
- Strong demand for custom apparel, fast product launches, and low-inventory models drives steady adoption among creators, small brands, and online retailers across global platforms.
- Key trends include expansion of sustainable product lines, rapid use of AI-based design automation, and rising demand for premium customization across apparel, drinkware, and home décor, with apparel holding about 54% share in 2024.
- Competition intensifies as leading providers expand fulfilment hubs, improve printing technology, and integrate tightly with major e-commerce systems to support faster delivery and broader product catalogs.
- North America leads with around 36.2% share, followed by Asia Pacific at nearly 29.3% as digital retail rises, while Europe accounts for about 18% and LAMEA contributes close to 16–17%, reflecting growing adoption across emerging markets.
Market Segmentation Analysis:
By Platform
Software held the dominant position in 2024 with about 61% share of the print on demand market. Strong growth came from rising adoption of automated design tools, improved API integrations, and better workflow management for global sellers. Software platforms supported fast store setup, real-time order syncing, and reduced manual work for merchants on Shopify, Etsy, and WooCommerce. Service platforms grew at a steady pace as more creators outsourced printing and logistics, but software stayed ahead due to higher scalability, lower operating cost, and strong demand from small and mid-sized online businesses.
- For instance, Printful has delivered over 120 million items since its founding in 2013, operating from 12 facilities worldwide, according to data on the official Printful website.
By Software
Integrated software led the segment in 2024 with nearly 68% share. Merchants chose integrated solutions because these systems combine design tools, product catalogs, order routing, and fulfillment dashboards in one place. This setup helped reduce errors, improve production speed, and enable smooth cross-platform management for omnichannel sellers. Stand-alone tools remained relevant for niche creators needing customized design modules, but demand stayed lower due to limited automation. Integrated platforms grew faster as brands sought unified systems that support high order volumes and minimize turnaround time.
- For instance, As of late 2024 and early 2025, Kittl reported serving over 5 million registered users worldwide.
By Product
Apparel dominated the product segment in 2024 with about 54% share of the print on demand market. Growth was driven by strong demand for custom T-shirts, hoodies, sportswear, and merchandise promoted on social platforms by influencers and small brands. Apparel offered high margins, fast printing cycles, and wide personalization options, which attracted new sellers. Home décor and drinkware expanded as gifting and interior personalization trends increased, but apparel stayed ahead due to larger repeat-purchase rates, a broader buyer base, and the rising shift toward low-inventory fashion models.
Key Growth Drivers
Rising Adoption of Custom Apparel and Merchandise
Demand for custom apparel and merchandise continues to surge as online sellers, influencers, and small brands use print on demand to launch products without holding inventory. This model reduces financial risk and supports faster experimentation with new designs. Buyers prefer personalized clothing, accessories, and lifestyle goods, which drives continuous order volume. Strong integration with e-commerce platforms also supports rapid scaling, helping creators turn trends into sellable products within hours. These benefits make custom merchandise a major growth engine for the print on demand market.
- For instance, Spring reported hosting 450,000 verified creators selling custom products on its platform.
Expansion of E-commerce and Creator Economy
The fast growth of global e-commerce and the rise of creator-led brands have strengthened the market. Sellers want flexible production models that avoid bulk manufacturing and reduce waste. Print on demand supports this shift by offering low upfront cost, automated order handling, and global delivery networks. Social commerce platforms help creators market niche designs to targeted audiences, boosting conversion rates. This ecosystem encourages more individuals and microbrands to adopt print on demand, turning digital influence into stable revenue streams and driving strong market expansion.
- For instance, Printify is reported to serve over 12 million people who have signed up to build businesses, with more than 60 million total orders completed through its network of print providers, as stated on the official Printify website and company information pages.
Advancements in Printing Technology and Automation
New printing technologies such as direct-to-garment, UV printing, and advanced sublimation enable higher-quality output, faster turnaround, and improved color accuracy. Automation in order routing, design processing, and multi-location fulfillment also supports higher scalability. These improvements help sellers manage peak demand, reduce defects, and offer broader customization options. Lower production time strengthens customer satisfaction, while automated workflows reduce operational strain for small businesses. These technology gains play a central role in expanding production capacity and supporting long-term market growth.
Key Trends & Opportunities
Growth of Sustainable and Eco-Friendly Product Lines
Sustainability is becoming a core trend as consumers seek eco-friendly apparel, recycled materials, and low-waste production models. Print on demand aligns well with this shift because products are made only after an order is placed. Companies are offering organic fabrics, water-based inks, and reduced-waste packaging to appeal to conscious buyers. This trend creates opportunities for brands targeting green consumers and supports premium pricing strategies. Sellers who adopt sustainable inputs gain stronger loyalty and differentiate themselves in a crowded online marketplace.
- For instance, T-Pop states that over 30,000 online sellers use its eco-focused print-on-demand platform.
Rapid Rise of AI-Driven Design and Personalization Tools
AI-assisted design tools help creators produce unique artwork, automate mockups, and customize products at scale, making it easier for beginners to enter the market. These tools reduce creative time and help sellers respond quickly to seasonal trends or viral themes. Personalization features, such as name-based designs or location-based prints, also boost customer engagement. AI-driven automation expands product variety and strengthens a seller’s ability to test multiple concepts, creating major opportunities for growth in both small and enterprise-level POD operations.
- For instance, As of late 2024 and throughout 2025, Canva has reported a community of over 240 million monthly active users,
Expansion into Home Décor and Lifestyle Categories
Beyond apparel, home décor and lifestyle goods such as wall art, cushions, and drinkware are gaining traction. These categories attract both gifting customers and interior design buyers seeking unique and personalized items. Better printing formats for wood, canvas, ceramics, and metal enable stronger quality and product diversity. This expansion helps sellers reduce dependency on apparel and tap into higher-margin categories. Rising interest in personalized home spaces creates steady demand and opens new growth avenues for suppliers and creators.
Key Challenges
Intense Competition and Price Pressure Across Platforms
The market faces heavy competition as thousands of new sellers enter each year, leading to price-driven battles across apparel and accessories. Many stores offer similar designs, reducing differentiation and pushing creators to lower margins. High marketplace fees also affect profitability for small sellers. This environment forces brands to rely on strong marketing, niche targeting, and higher-quality materials to stand out. While demand is strong, competition remains a major barrier for new entrants trying to scale in the print on demand space.
Quality Control and Fulfillment Delays During Peak Demand
Maintaining consistent print quality across different fulfillment centers is challenging, especially during seasonal peaks. Variations in materials, color output, and production speed can affect customer satisfaction. Delays in shipping during high-volume periods often lead to complaints and order cancellations. Sellers rely heavily on third-party production partners, giving them limited control over operational issues. These risks make quality control and reliable delivery some of the biggest obstacles for scaling brands in the print on demand market.
Regional Analysis
North America
North America accounted for approximately 36.2% of the global print on demand market in 2024. The region benefits from advanced e-commerce infrastructure, a strong creator economy, and multiple leading POD companies headquartered in the U.S. Buyers’ preference for personalized apparel, home décor, and accessories drives demand. High internet penetration and efficient logistics networks enable fast fulfilment and return processing. The U.S. dominates within the region, supported by platforms such as Shopify and Etsy; Canada and Mexico are emerging markets as digital retail adoption climbs.
Asia Pacific
The Asia Pacific region captured around 29.3% of the global print on demand market in 2024. Rapid growth stems from rising online retail penetration, increasing disposable income, and strong demand for custom products in China, India, Japan, and Southeast Asia. The region leads in manufacturing scale and has a growing number of digital print hubs. Expansion of mobile commerce and social-commerce platforms further fuels adoption. Asia Pacific is poised to register the fastest regional growth over the forecast period, making it a key focus for POD service providers and sellers.
Europe
Europe’s share of the global print on demand market stood near 18% in 2024 (based on available estimates). The market is expanding thanks to high e-commerce adoption, increased demand for sustainable and personalized goods, and strong presence of SMEs leveraging POD. Germany, the United Kingdom, and France are notable markets with growing preference for custom apparel, lifestyle products and home décor. Regulatory emphasis on sustainability and localised fulfilment centre build-out support the value chain. Europe offers steady growth with opportunities for cross-border fulfilment within the EU.
Latin America & Middle East & Africa (LAMEA)
Combined, the LAMEA region accounted for the remaining approximate 16-17% share in 2024. Growth in Latin America is driven by rising smartphone usage, growth of regional e-commerce platforms and local fulfilment partnerships. In Middle East & Africa, early stage digital retail, expanding logistics networks and increasing creator-led merchandise stores are enabling growth. However, challenges such as weaker infrastructure, customs delays and lower per-capita disposable income slow adoption. Nonetheless, LAMEA offers long-term opportunity for POD expansion through localisation and low-inventory models.
Market Segmentations:
By Platform
- Software
- Service
By Software
- Stand-alone
- Integrated
By Product
- Apparel
- Home Décor
- Drinkware
- Accessories
- Others
By Geography
- North America
- U.S.
- Canada
- Mexico
- Europe
- Germany
- France
- U.K.
- Italy
- Spain
- Rest of Europe
- Asia Pacific
- China
- Japan
- India
- South Korea
- South-east Asia
- Rest of Asia Pacific
- Latin America
- Brazil
- Argentina
- Rest of Latin America
- Middle East & Africa
- GCC Countries
- South Africa
- Rest of the Middle East and Africa
Competitive Landscape
The print on demand market is shaped by key players such as Gooten, Printify, Inc., Apliiq, Creator Studio, JetPrint Fulfillment, CustomCat, VistaPrint, Amplifier, Printed Mint, Printful, Inc., and Gelato. The competitive landscape reflects rapid expansion as providers strengthen global fulfilment networks, improve automation, and enhance product customization options. Many companies focus on integrating with major e-commerce platforms to simplify store setup and order routing for sellers. Advanced printing methods, diversified product catalogues, and faster delivery models help providers differentiate in a crowded space. Firms also invest in sustainable materials and on-demand manufacturing techniques to meet rising consumer expectations. Growing demand from creators, small businesses, and enterprise clients encourages platforms to scale production capacity and add region-specific fulfilment centres to reduce delivery time and shipping costs.
Key Player Analysis
- Gooten
- Printify, Inc.
- Apliiq
- Creator Studio
- JetPrint Fulfillment
- CustomCat
- VistaPrint
- Amplifier
- Printed Mint
- Printful, Inc.
- Gelato
Recent Developments
- In 2025, Gooten was acquired by Taylor Corporation in October 2025, combining Gooten’s innovative OrderMesh platform and global production partners with Taylor’s manufacturing footprint.
- In 2024, Gelato, launched GelatoConnect, an AI-powered operating system to optimize procurement, workflow, and logistics for print producers.
- In 2024, Creator Studio, H&M Group's print-on-demand merchandise service, launched its first clothing printing hub in the UK.
Report Coverage
The research report offers an in-depth analysis based on Platform, Software, Product and Geography. It details leading market players, providing an overview of their business, product offerings, investments, revenue streams, and key applications. Additionally, the report includes insights into the competitive environment, SWOT analysis, current market trends, as well as the primary drivers and constraints. Furthermore, it discusses various factors that have driven market expansion in recent years. The report also explores market dynamics, regulatory scenarios, and technological advancements that are shaping the industry. It assesses the impact of external factors and global economic changes on market growth. Lastly, it provides strategic recommendations for new entrants and established companies to navigate the complexities of the market.
Future Outlook
- The market will grow as more creators and small brands adopt low-inventory business models.
- Apparel will remain the strongest category while home décor and lifestyle goods gain faster traction.
- AI-based design and automation tools will expand product variety and reduce creation time.
- Fulfilment networks will scale globally to support faster shipping and regional production.
- Eco-friendly materials and sustainable printing methods will become major decision factors for buyers.
- Integration with e-commerce platforms will deepen, improving automation and order accuracy.
- Personalization features will become more advanced across apparel, accessories, and décor.
- Competition will intensify, pushing brands toward niche markets and premium quality.
- Multi-location print hubs will help reduce delays during peak seasons.
- Enterprise-level adoption will rise as companies use POD for marketing and limited-run merchandise.
Request a Free Sample
Fill in your details and we'll send you a free sample report.
- Sample data tables & charts
- Research methodology
Need a Custom Version of This Report?
Tailor the scope, geography, or segments to your exact requirements.
- Custom geography or segment scope
- Direct access to our analyst team
Frequently Asked Questions
What is the current market size for print on demand market, and what is its projected size in 2032?
At what Compound Annual Growth Rate is the print on demand market projected to grow between 2025 and 2032?
Which print on demand market segment held the largest share in 2024?
What are the primary factors fueling the growth of the print on demand market?
Who are the leading companies in the print on demand market?
Which region commanded the largest share of the print on demand market in 2024?
Table of Content
Chapter 1. Report Introduction
- 1.1 Report Description & Purpose
- 1.1.1 Report Title & Market Definition
- 1.1.2 Unique Selling Propositions (USP) & Key Differentiators
- 1.1.3 Value Proposition for Stakeholders
- 1.2 Research Objectives
- 1.2.1 Market Sizing Objectives (Volume & Revenue) (Volume Where Applicable)
- 1.2.2 Segmentation Objectives
- 1.2.3 Competitive Intelligence Objectives
- 1.2.4 Forecast & Scenario Objectives
- 1.3 Report Scope
- 1.3.1 Print On Demand Scope – Segments & Subsegments Covered
- 1.3.2 Geographic Scope – Regions & Countries Covered
- 1.3.3 Historical Period, Base Year & Forecast Period (2024; forecast to 2032)
- 1.3.4 Inclusions & Exclusions
- 1.4 Industry Classification & Applicable Codes
- 1.5 Currency, Measurement Units & Valuation Basis
- 1.6 Target Stakeholders
- 1.7 Limitations & Assumptions
Chapter 2. Executive Summary
- 2.1 Global Print On Demand Market Snapshot
- 2.1.1 Market Size – Historical (2024) & Forecast (2024-2032) (2024: USD 10.22 Billion → 2032: USD 39.42 Billion)
- 2.1.2 Volume & Revenue – Global Totals (Volume Where Applicable)
- 2.1.3 Key Market Highlights – Top Five Facts
- 2.2 Print On Demand Market Segmentation Snapshot
- 2.2.1 Market Split by Region – 2024 vs. 2032
- 2.3 Competitive Snapshot
- 2.3.1 Top 10 Players by Revenue Share – 2024
- 2.3.2 Top 10 Players by Volume Share – 2024 (Volume Where Applicable)
- 2.3.3 Recent Strategic Developments (18-Month Summary)
- 2.4 Key Investment Highlights & Strategic Conclusions
Chapter 3. Print On Demand Market Dynamics & Industry Analysis
- 3.1 Market Overview & Context
- 3.1.1 Print On Demand Market Position in the Broader Industry Value Chain
- 3.1.2 Demand Structure & Purchasing Dynamics
- 3.1.3 Market Maturity & Development Stage by Region
- 3.2 Print On Demand Market Drivers
- 3.3 Print On Demand Market Restraints & Challenges
- 3.4 Print On Demand Market Opportunities
- 3.5 Porter's Five Forces Analysis
- 3.5.1 Threat of New Entrants
- 3.5.2 Bargaining Power of Suppliers
- 3.5.3 Bargaining Power of Buyers
- 3.5.4 Threat of Substitutes
- 3.5.5 Competitive Rivalry – Intensity Assessment
- 3.6 Print On Demand Value Chain Analysis
- 3.6.1 Upstream – Key Inputs, Resources & Suppliers
- 3.6.1.1 Key Input/Resource 1
- 3.6.1.2 Key Input/Resource 2
- 3.6.1.3 Key Input/Resource 3
- 3.6.2 Midstream – Core Operations & Value Creation
- 3.6.2.1 Operating Model & Process Overview
- 3.6.2.2 Key Operating Locations & Capabilities by Company
- 3.6.3 Downstream – Market Channels & End Users
- 3.6.3.1 Direct Sales & Customer Engagement Channels
- 3.6.3.2 Indirect Sales, Intermediaries & Partner Channels
- 3.6.4 Value Chain Profitability Analysis
- 3.6.1 Upstream – Key Inputs, Resources & Suppliers
- 3.7 PESTEL Analysis
- 3.7.1 Political Factors
- 3.7.2 Economic Factors
- 3.7.3 Social Factors
- 3.7.4 Technological Factors
- 3.7.5 Environmental Factors
- 3.7.6 Legal Factors
- 3.8 Print On Demand Supply Chain Analysis
- 3.8.1 Critical Input & Resource Availability Risk Assessment
- 3.8.2 Supplier & Operational Concentration Risk (Geographic Exposure)
- 3.8.3 Supply & Service Disruption Impact Analysis
- 3.9 Regulatory & Policy Landscape
Note: The regulatory and policy landscape section covers regulations based on their applicability to the market, Print On Demand category, geography, and scope of the study. Only regulatory frameworks with a material impact on operations, compliance, trade, sustainability, or market access are analyzed in detail.
Chapter 4. Key Investment Pockets & Opportunity Analysis
- 4.1 Print On Demand Market Attractiveness Analysis
- 4.1.1 By Region – Investment Attractiveness Matrix (Market Size × CAGR)
- 4.2 Absolute Revenue Growth Opportunity
- 4.2.1 By Region – Absolute Revenue Growth Through 2032
- 4.3 Incremental Demand Opportunity
- 4.3.1 By Region – Incremental Demand Through 2032
- 4.3.2 Segment – Incremental Demand
- 4.4 Emerging Submarket Opportunity Deep Dive (Subject to Applicability)
- 4.5 Priority Market Opportunity Scorecards
- 4.5.1 United States
- 4.5.2 Europe
- 4.5.3 Asia
- 4.5.4 Middle East & Africa
Note: Priority market opportunity scorecards reflect the geographic scope and strategic relevance of the study. Listed markets are indicative and may be adapted to the industry.
Chapter 5. Print On Demand Cross-Border Trade & Market Access Analysis
- 5.1 International Trade & Cross-Border Activity Overview
- 5.1.1 Global Export Value by Country (2024)
- 5.1.2 Global Export Volume by Country (2024) (Volume Where Applicable)
- 5.1.3 Global Import Value by Country (2024)
- 5.1.4 Global Import Volume by Country (2024) (Volume Where Applicable)
- 5.1.5 Net Trade Balance by Country (2024)
- 5.2 Export Analysis – Segment
- 5.2.1 Category 1 (Applicable Classification Code)
- 5.2.2 Category 2 (Applicable Classification Code)
- 5.2.3 Category 3 (Applicable Classification Code)
- 5.2.4 Category 4 (Applicable Classification Code)
- 5.2.5 Category 5 (Applicable Classification Code)
- 5.3 Import Analysis – Segment
- 5.3.1 Category 1 (Applicable Classification Code)
- 5.3.2 Category 2 (Applicable Classification Code)
- 5.3.3 Category 3 (Applicable Classification Code)
- 5.3.4 Category 4 (Applicable Classification Code)
- 5.3.5 Category 5 (Applicable Classification Code)
- 5.4 Cross-Border Pricing & Transaction Benchmarks
- 5.4.1 Export Pricing – Segment & Country
- 5.4.2 Import Pricing – Segment & Source Country
- 5.4.3 Price Trends (2024)
- 5.5 Key Cross-Border Trade & Delivery Routes
- 5.5.1 Cross-Border Trade/Delivery Route 1
- 5.5.2 Cross-Border Trade/Delivery Route 2
- 5.5.3 Cross-Border Trade/Delivery Route 3
- 5.5.4 Cross-Border Trade/Delivery Route 4
- 5.5.5 Cross-Border Trade/Delivery Route 5
- 5.6 Trade Policy & Market Access Impact Assessment
- 5.6.1 Tariff & Non-Tariff Barriers
- 5.6.2 Regional Trade & Economic Integration Frameworks
- 5.6.3 Bilateral & Multilateral Trade Agreements
- 5.6.4 Cross-Border Operating, Licensing & Localization Requirements
Note: This chapter applies where cross-border trade or delivery is relevant to Print On Demand. Goods, services, and digital offerings are assessed using applicable classifications and transaction measures. Import-export volumes, trade balances, and route analyses are included only where meaningful to the market.
Chapter 6. Competitive Landscape & Company Benchmarking
- 6.1 Print On Demand Market Concentration & Structure
- 6.1.1 Herfindahl-Hirschman Index (HHI) – vs. 2024
- 6.1.2 Leading, Mid-Sized & Emerging Player Structure
- 6.1.3 Global, Regional & Local Player Dynamics
- 6.2 Print On Demand Market Share Analysis – 2024
- 6.2.1 Global Revenue Share by Company
- 6.2.2 Global Volume Share by Company (Volume Where Applicable)
- 6.2.3 Regional Revenue Share
- 6.2.4 Market Share Evolution ( vs. 2024)
- 6.2.5 Company Market Share by Key Segment
- 6.2.6 Company Market Share by Customer Group
- 6.3 Operating Scale, Capacity & Infrastructure Analysis
- 6.3.1 Global Operating Scale & Supply Capacity
- 6.3.2 Resource Utilization & Operating Efficiency
- 6.3.3 Output, Service Delivery & Activity Metrics
- 6.3.4 Operating Footprint & Infrastructure Map
- 6.3.5 Planned Operational & Capacity Expansion
- 6.4 Print On Demand Competitive Benchmarking Matrix
- 6.4.1 Revenue, Growth, Profitability & Operating Metric Comparison
- 6.4.2 Channel Revenue Mix
- 6.4.3 Geographic Revenue Exposure
- 6.4.4 R&D Intensity
- 6.4.5 Sustainability Maturity
- 6.5 Strategic Developments in Print On Demand (Last 24 Months)
- 6.5.1 Mergers, Acquisitions & Divestments
- 6.5.2 New Products, Services & Solutions in Print On Demand
- 6.5.3 Operational & Infrastructure Expansions
- 6.5.4 Strategic Alliances, Joint Ventures & Partnerships
- 6.5.5 Distribution Expansion & Market Entry
- 6.5.6 Sustainability & ESG Initiatives
- 6.6 Competitive Strategy Mapping
- 6.6.1 Leader, Challenger, Follower & Niche Classification
- 6.6.2 Pricing Strategy Comparison
- 6.6.3 Channel Strategy Matrix
Note: Strategic developments are included based on their materiality and the availability of reliable information.
Chapter 7. Global Print On Demand Market – By Sales & Delivery Channel
- 7.1 Segment Overview
- 7.1.1 Volume & Revenue Split by Channel (2024 & 2032) (Volume Where Applicable)
- 7.1.2 Channel Mix Evolution (2024-2032)
Chapter 8. Regional Market Analysis – Global Overview
- 8.1 Global Regional Overview
- 8.1.1 Regional Volume Share (Volume Where Applicable)
- 8.1.2 Regional Revenue Share
- 8.1.3 Regional Volume by Region (Volume Where Applicable)
- 8.1.4 Regional Revenue by Region
- 8.1.5 Regional Forecast Through 2032
- 8.2 Cross-Regional Segment Analysis
- 8.2.1 By Sales & Delivery Channel
- 8.2.2 By Competitive Positioning & Price Tier
Chapter 9. North America Print On Demand Market
- 9.1 United States
- 9.2 Canada
- 9.3 Mexico
Chapter 10. Europe Print On Demand Market
- 10.1 Germany
- 10.2 France
- 10.3 Italy
- 10.4 United Kingdom
- 10.5 Spain
- 10.6 Poland
- 10.7 Russia
- 10.8 Netherlands
- 10.9 Belgium
- 10.10 Sweden
- 10.11 Denmark
- 10.12 Norway
- 10.13 Rest of Europe
Chapter 11. Asia Pacific Print On Demand Market
- 11.1 China
- 11.2 India
- 11.3 Japan
- 11.4 South Korea
- 11.5 Thailand
- 11.6 Indonesia
- 11.7 Vietnam
- 11.8 Malaysia
- 11.9 Australia
- 11.10 Rest of Asia Pacific
Chapter 12. Latin America Print On Demand Market
- 12.1 Brazil
- 12.2 Argentina
- 12.3 Colombia
- 12.4 Chile
- 12.5 Rest of Latin America
Chapter 13. Middle East Print On Demand Market
- 13.1 Saudi Arabia
- 13.2 United Arab Emirates
- 13.3 Turkey
- 13.4 Israel
- 13.5 Iran
- 13.6 Rest of the Middle East
Chapter 14. Africa Print On Demand Market
- 14.1 South Africa
- 14.2 Egypt
- 14.3 Nigeria
- 14.4 Morocco
- 14.5 Rest of Africa
Chapter 15. Print On Demand Company Profiles
- 15.1 [Company 01]
- 15.1.1 Company Overview
- 15.1.2 Key Management Personnel
- 15.1.3 Products & Services Portfolio
- 15.1.4 Financial Performance
- 15.1.5 Key Market Focus & Geographic Presence
- 15.1.6 Recent Developments & Strategic Initiatives
Note: The company profile list is preliminary and may change based on research findings, market developments, data availability, and client requirements.
Chapter 16. Appendices
- Appendix A – List of Abbreviations & Acronyms
- Appendix B – Industry Classification Code Reference – Full Series
- Appendix C – Supply, Output & Operating Capacity Data Tables
- Appendix D – End-Use & Demand Base Tables
- Appendix E – Demand, Adoption & Usage Assumptions
- Appendix F – Pricing & Revenue Metric Reference Tables
- Appendix G – Company Operations & Infrastructure Database
- Appendix H – Cross-Border Trade & Activity Data Tables (Where Applicable)
- Appendix I – Regulatory Summary Tables
- Appendix J – Primary Research Participant List (Anonymized)
- Appendix K – Primary Research Questionnaire Framework
- Appendix L – Data Sources & Bibliography
- Appendix M – Market Size Divergence & Source Comparison
Chapter 17. Research Methodology
- 17.1 Research Framework & Philosophy
- 17.2 Secondary Research – Sources, Hierarchy & Data Extraction
- 17.3 Data Modeling – Bottom-Up & Top-Down Market Sizing
- 17.4 Primary Research – Stakeholder Framework, LOI & Sample Sizes
- 17.5 Forecast Methodology – Regression, Scenario & Sensitivity Analysis
- 17.6 Quality Control – Four-Layer Validation Framework
- 17.7 Limitations & Standard Assumptions
- 17.8 Disclaimer
