Market Overview
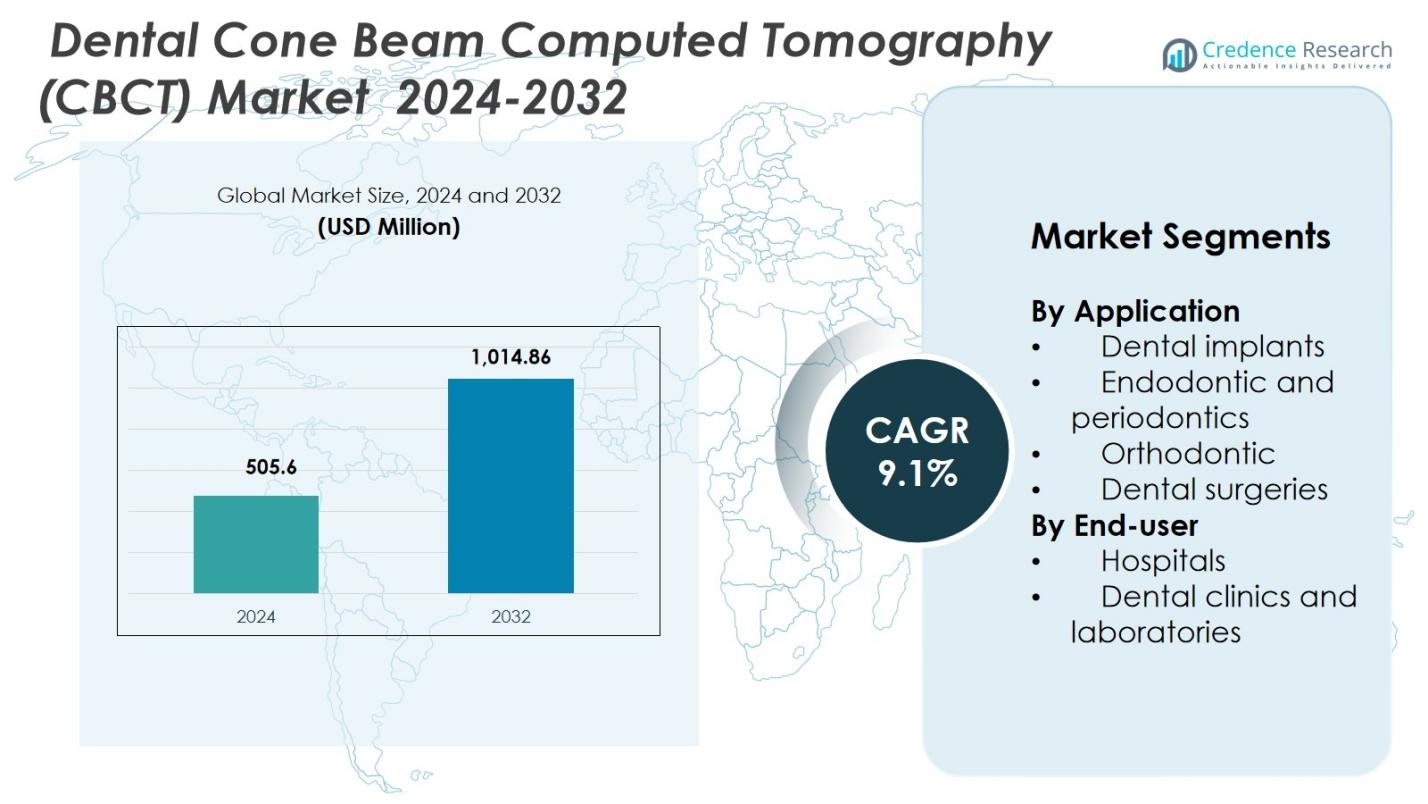
Dental Cone Beam Computed Tomography (CBCT) Market size was valued at USD 505.6 Million in 2024 and is anticipated to reach USD 1,014.86 Million by 2032, at a CAGR of 9.1% during the forecast period.
| REPORT ATTRIBUTE |
DETAILS |
| Historical Period |
2020-2023 |
| Base Year |
2024 |
| Forecast Period |
2025-2032 |
| Neurotrophic Keratitis Market Size 2024 |
USD 505.6 Million |
| Neurotrophic Keratitis Market, CAGR |
9.1% |
| Neurotrophic Keratitis Market Size 2032 |
USD 1,014.86 Million |
Dental Cone Beam Computed Tomography (CBCT) Market is shaped by leading players such as 3Shape AS, Air Techniques Inc., Asahi Roentgen Ind. Co. Ltd, Carestream Health Inc., Cefla SC, Dentium Co. Ltd., Dentsply Sirona Inc., Durr Dental SE, Envista Holdings Corp., and Finapoline SAS, all focusing on advancing 3D imaging performance and AI-enabled diagnostic accuracy. These companies strengthen their presence through product innovation, workflow integration, and broader adoption in clinics and hospitals. North America leads the market with a 38.6% share in 2024, supported by strong digital dentistry uptake and high implant procedure volumes, followed by Europe with a 27.4% share driven by early technology adoption and robust oral care infrastructure.
Access crucial information at unmatched prices!
Request your sample report today & start making informed decisions powered by Credence Research Inc.!
Download Sample
Market Insights
- The Dental Cone Beam Computed Tomography (CBCT) Market was valued at USD 505.6 Million in 2024 and is expected to grow at a CAGR of 9.1% through 2032.
- Rising demand for precision imaging in dental implants, orthodontics, and endodontics drives strong market adoption, with the dental implants segment holding a 41.3% share in 2024.
- Digital dentistry expansion, integration of AI-based diagnostics, and increased use of CAD/CAM workflows shape key market trends, supporting wider clinical adoption of 3D CBCT imaging.
- Major players, including Dentsply Sirona Inc., Envista Holdings Corp., Carestream Health Inc., and Cefla SC, focus on product innovation, low-dose imaging, and affordable systems to enhance market penetration.
- North America leads with a 38.6% share, followed by Europe at 27.4%, while Asia-Pacific grows rapidly with a 23.1% share due to rising dental tourism and expanding private dental clinics.
 Market Segmentation Analysis:
By Application
In the Dental Cone Beam Computed Tomography (CBCT) Market, the dental implants segment leads with a 41.3% share in 2024, driven by rising implant procedures, increasing edentulous cases, and strong adoption of 3D imaging for pre-surgical planning. Its precision in assessing bone density, nerve positioning, and implant angulation strengthens its dominance. The endodontic and periodontics segment follows, supported by growing demand for accurate root canal assessment and periodontal defect evaluation. Orthodontic applications also expand as CBCT enables precise cephalometric analysis and treatment simulations. Dental surgeries continue to adopt CBCT for complex maxillofacial evaluations, improving surgical outcomes and workflow efficiency.
- For instance, VATECH offers CBCT solutions that enhance 3D imaging accuracy for implant angulation, widely adopted for pre-surgical evaluations.
By End-user
The dental clinics and laboratories segment dominates the end-user landscape with a 58.7% share in 2024, propelled by rapid digital adoption, increased chairside diagnostics, and expanding patient volumes in private practices. Clinics prefer CBCT systems for their compact designs, faster imaging, and enhanced diagnostic confidence. Hospitals hold the remaining share, benefiting from higher budgets, multidisciplinary case handling, and broader integration with surgical navigation systems. Growth across both segments is driven by rising dental disorders, expanding cosmetic dentistry demand, and the shift toward advanced 3D imaging for precision treatment planning across routine and complex dental procedures.
- For instance, Planmeca’s ProMax 3D unit is widely adopted in private clinics due to its user-friendly interface and high-resolution imaging, supporting faster diagnosis.
Key Growth Drivers
Rising Demand for Precision Dental Diagnostics
Growing adoption of precision-based dental treatments significantly boosts the Dental Cone Beam Computed Tomography (CBCT) Market. Dentists increasingly rely on CBCT for high-resolution 3D visualization that enhances diagnostic accuracy across implants, orthodontics, and endodontics. Its ability to provide detailed anatomical insights improves treatment planning, reduces complications, and supports evidence-based decision-making. With patient expectations rising for predictable and minimally invasive outcomes, clinics and hospitals continue upgrading to CBCT systems, strengthening the technology’s penetration across both developed and emerging markets.
- For instance, Carestream Dental reported that their CS 9600 CBCT system has improved implant surgery precision by providing ultra-high resolution images, facilitating more accurate placement and fewer post-operative complications.
Expansion of Dental Implants and Cosmetic Dentistry
The rapid increase in dental implant procedures and cosmetic dentistry is a major growth catalyst for the CBCT market. Implantology heavily depends on CBCT imaging to assess bone density, nerve pathways, and placement angles, ensuring superior clinical outcomes. Similarly, cosmetic dentistry procedures benefit from 3D facial and dental mapping, which improves aesthetic planning and patient communication. Growing awareness of oral aesthetics, rising disposable incomes, and expanding aging populations with tooth loss further accelerate the adoption of CBCT-enabled treatment workflows.
- For instance, Dentsply Sirona’s CBCT-based treatment workflows, which have streamlined diagnosis and improved outcomes in full-mouth restorations.
Technological Advancements and AI-Integrated Imaging
Advancements in CBCT technology—including lower radiation doses, faster scan times, improved image resolution, and AI-powered diagnostics—are driving widespread market expansion. AI integration supports automated nerve canal detection, volumetric measurements, and enhanced pathology recognition, reducing clinician workload and improving diagnostic consistency. Additionally, innovations such as cloud-based imaging platforms, chairside integration, and mobile CBCT solutions enhance accessibility and workflow efficiency. These developments collectively strengthen the reliability, appeal, and clinical utility of CBCT systems across a broad range of dental applications.
Key Trends & Opportunities
Growth of Digital Dentistry and Workflow Integration
A major trend transforming the CBCT market is the integration of digital dentistry ecosystems, including CAD/CAM workflows, intraoral scanners, and 3D printing systems. CBCT becomes the central imaging component enabling seamless design-to-treatment execution for implants, orthodontics, and restorations. As clinics adopt digital workflows to boost efficiency, reduce chairside time, and enhance patient experience, opportunities expand for vendors offering interoperable software, AI-driven planning tools, and cloud-enabled platforms that unify imaging, diagnosis, and digital treatment processes.
- For instance, Planmeca’s CBCT units integrate directly with their Romexis software platform, streamlining implant planning and surgical guide creation within a single system.
Adoption in Emerging Markets and Small Practices
Increasing availability of cost-effective CBCT units creates significant opportunities across emerging markets and small-to-mid-sized dental practices. Governments and dental associations are promoting digital imaging to improve oral healthcare infrastructure, while vendors launch compact, affordable systems tailored for limited clinic spaces. As patient awareness increases and dental tourism accelerates, clinics in Asia-Pacific, Latin America, and Middle Eastern regions rapidly integrate CBCT for advanced diagnostics. This broadening adoption base enhances long-term revenue prospects and market penetration globally.
- For instance, the Dubai Health Authority’s digital transformation initiative actively encourages dental clinics to adopt CBCT technology, facilitating enhanced diagnostic capabilities and patient care in the region.
Key Challenges
High Equipment Cost and Ownership Burden
The high cost of CBCT equipment remains a major barrier, especially for small practices and clinics in developing regions. Initial investment, ongoing maintenance expenses, and software licensing fees significantly increase ownership costs. These financial burdens often delay purchasing decisions or push clinics toward shared imaging centers. Additionally, frequent technological upgrades raise lifecycle expenses, making affordability a persistent challenge. Vendors must address cost barriers through flexible financing models, subscription-based software, and modular systems to enhance accessibility.
Radiation Exposure Concerns and Regulatory Compliance
Despite improvements in low-dose imaging, concerns about radiation exposure and strict regulatory requirements continue to challenge market growth. Compliance with radiation safety standards, operator training mandates, and certification processes increases operational complexity for clinics. Some practitioners remain cautious about routine use, particularly in pediatric or preventive cases. Moreover, variations in regulatory frameworks across countries add administrative burden. Addressing these concerns requires ongoing technology evolution, clinician education, and clear guidelines supporting safe, optimized CBCT utilization in dental diagnostics.
Regional Analysis
North America
North America holds the largest share in the Dental Cone Beam Computed Tomography (CBCT) Market with a 38.6% share in 2024, driven by advanced dental infrastructure, strong adoption of digital dentistry, and high spending on cosmetic and implant procedures. The U.S. leads due to widespread integration of CBCT in orthodontics, implantology, and endodontics, supported by favorable reimbursement for dental diagnostics. A growing elderly population, expanding dental service organizations (DSOs), and continuous technological upgrades further strengthen market growth. Increasing awareness of minimally invasive procedures and AI-enabled imaging accelerates CBCT adoption across clinics and hospitals in the region.
Europe
Europe commands a 27.4% share in the Dental CBCT Market, supported by robust oral healthcare systems, early technological adoption, and rising demand for advanced imaging in restorative and aesthetic dentistry. Countries such as Germany, the U.K., France, and Italy invest heavily in digital workflows, boosting CBCT utilization across orthodontics and implant planning. Regulatory emphasis on radiation safety encourages clinics to adopt low-dose CBCT systems. The region’s expanding geriatric population and strong presence of leading dental manufacturers further propel growth. Increased training programs for dentists and integration of AI solutions enhance diagnostic precision and workflow efficiency across Europe.
Asia-Pacific
The Asia-Pacific region captures a 23.1% share and remains the fastest-growing regional market, driven by rising dental tourism, increasing disposable incomes, and rapid expansion of private dental clinics. Countries such as China, India, South Korea, and Japan adopt CBCT for implants, orthodontics, and surgical planning as awareness of advanced oral care accelerates. Government initiatives to strengthen dental infrastructure and a growing middle-class population fuel demand. The presence of cost-effective CBCT systems and increasing investments in digital dentistry education further support market expansion. APAC’s strong focus on modernizing healthcare delivery positions it as a major future growth engine.
Latin America
Latin America holds a 6.8% share in the Dental CBCT Market, supported by growing digital adoption in countries like Brazil, Mexico, Chile, and Argentina. Dental tourism, particularly for cosmetic and implant procedures, contributes significantly to CBCT demand. Clinics increasingly invest in 3D imaging to improve accuracy and patient outcomes, while partnerships with global manufacturers expand access to modern technologies. Economic improvements and rising awareness of advanced dental care support steady growth. However, cost constraints and limited reimbursement still challenge widespread adoption, making mid-tier CBCT systems and financing solutions vital for broader penetration.
Middle East & Africa
The Middle East & Africa region accounts for a 4.1% share of the market, driven by growing investments in healthcare modernization and expanding private dental practices. Countries such as the UAE, Saudi Arabia, and South Africa increasingly adopt CBCT systems for implants, orthodontics, and maxillofacial surgeries. Dental tourism in the Gulf region accelerates demand for high-precision imaging. Government-backed healthcare expansions and rising training programs enhance clinical adoption. Despite progress, high equipment costs and limited specialist availability restrain growth, but expanding digital dentistry initiatives continue to create opportunities for CBCT system deployment across MEA.
Market Segmentations:
By Application
- Dental implants
- Endodontic and periodontics
- Orthodontic
- Dental surgeries
By End-user
- Hospitals
- Dental clinics and laboratories
By Geography
- North America
- Europe
- Germany
- France
- U.K.
- Italy
- Spain
- Rest of Europe
- Asia Pacific
- China
- Japan
- India
- South Korea
- South-east Asia
- Rest of Asia Pacific
- Latin America
- Brazil
- Argentina
- Rest of Latin America
- Middle East & Africa
- GCC Countries
- South Africa
- Rest of the Middle East and Africa
Competitive Landscape
The competitive landscape of the Dental Cone Beam Computed Tomography (CBCT) Market is shaped by leading players such as 3Shape AS, Air Techniques Inc., Asahi Roentgen Ind. Co. Ltd, Carestream Health Inc., Cefla SC, Dentium Co. Ltd., Dentsply Sirona Inc., Durr Dental SE, Envista Holdings Corp., and Finapoline SAS. These companies focus on advancing 3D imaging capabilities, reducing radiation exposure, and integrating AI-driven diagnostic tools to enhance clinical accuracy and workflow efficiency. Innovation remains central as manufacturers introduce compact, cost-efficient CBCT units to cater to small and mid-sized dental practices. Vendors invest heavily in software interoperability, cloud-based image management, and digital dentistry ecosystems to strengthen their market position. Strategic collaborations with dental clinics, research organizations, and technology providers support broader product adoption. Additionally, expansion into emerging markets, product upgrades, and continuous training programs for clinicians are key strategies used to sustain competitiveness and meet evolving clinical demands.
Key Player Analysis
- Dentium Co. Ltd.
- Finapoline SAS
- Envista Holdings Corp.
- Carestream Health Inc.
- Air Techniques Inc.
- Cefla SC
- Durr Dental SE
- 3Shape AS
- Dentsply Sirona Inc.
- Asahi Roentgen Ind. Co. Ltd
Recent Developments
- In March 2025, Carestream Dental launched the Advance Edition of its CS 8200 3D CBCT system, offering extended field-of-view (FOV) and AI-powered implant-planning workflows.
- In October 2025, Carestream Dental introduced the CS 3D Imaging Premium software package, adding AI-driven features for implant planning, airway analysis, and automated diagnostics to streamline clinical workflows.
- In 2024, Dentsply Sirona and Siemens Healthineers jointly revealed development of a dental-dedicated MRI system (ddMRI), expanding imaging capabilities beyond CBCT and promising superior soft-tissue diagnostics.
Shape Your Report to Specific Countries or Regions & Enjoy 30% Off!
Report Coverage
The research report offers an in-depth analysis based on Application, End User and Geography. It details leading market players, providing an overview of their business, product offerings, investments, revenue streams, and key applications. Additionally, the report includes insights into the competitive environment, SWOT analysis, current market trends, as well as the primary drivers and constraints. Furthermore, it discusses various factors that have driven market expansion in recent years. The report also explores market dynamics, regulatory scenarios, and technological advancements that are shaping the industry. It assesses the impact of external factors and global economic changes on market growth. Lastly, it provides strategic recommendations for new entrants and established companies to navigate the complexities of the market.
Future Outlook
- The market will experience stronger adoption of AI-integrated CBCT systems that enhance diagnostic precision and automate clinical workflows.
- Digital dentistry expansion will increase CBCT usage for implants, orthodontics, and facial aesthetic planning.
- Compact and low-radiation CBCT units will gain traction among small and mid-sized dental clinics.
- Cloud-based imaging platforms will support seamless data sharing, remote consultations, and collaborative treatment planning.
- Integration with CAD/CAM systems and 3D printing will strengthen CBCT’s role in fully digital treatment ecosystems.
- Growing dental tourism in emerging regions will accelerate investment in advanced imaging technologies.
- Aging populations worldwide will increase demand for implant procedures, boosting CBCT utilization.
- Continuous technological advancements will reduce scan time, improve image clarity, and enhance patient comfort.
- Regulatory emphasis on radiation safety will promote adoption of ultra-low-dose CBCT systems.
- Training programs and digital skill development among dentists will enable wider clinical adoption of CBCT technology.


