
Dental Tourism Market Overview:
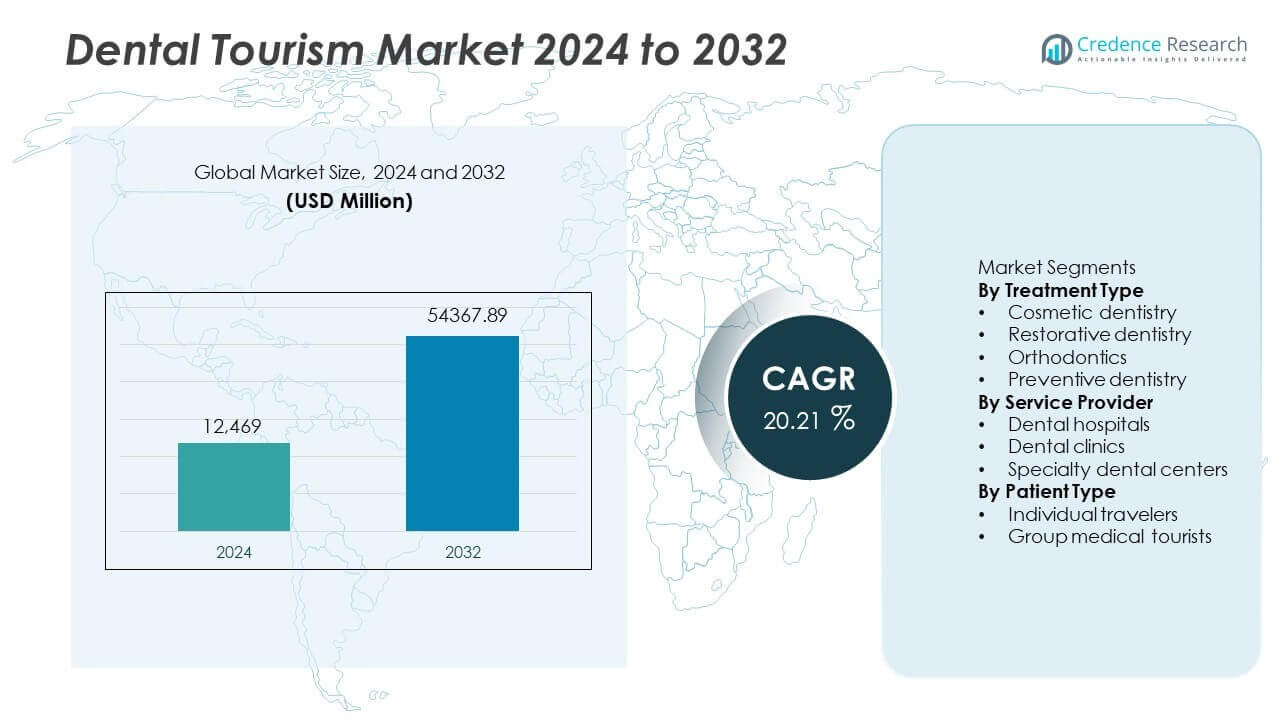
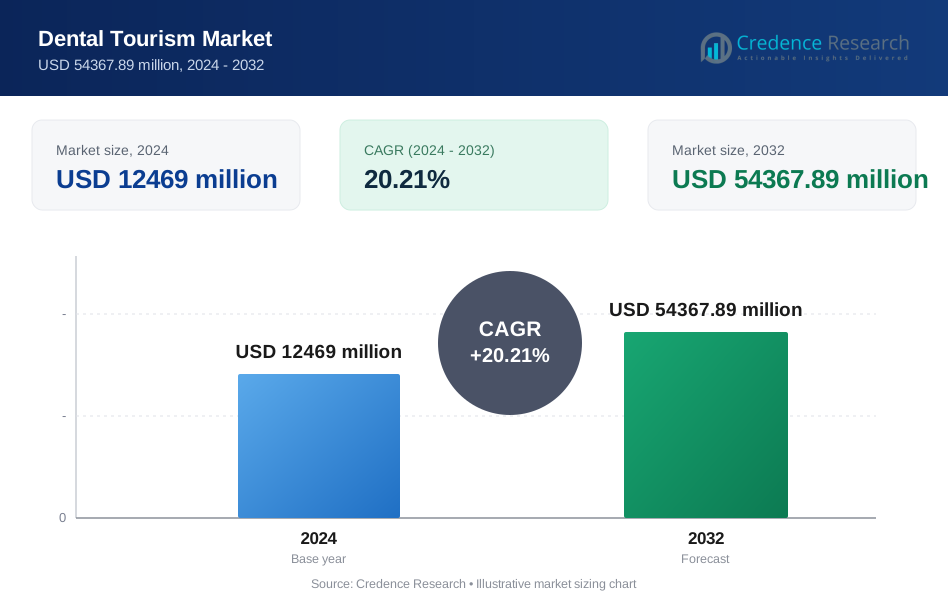
The dental tourism market was valued at USD 12469 million in 2024 and is projected to reach USD 54367.89 million by 2032, growing at a CAGR of 20.21% during the forecast period.
| REPORT ATTRIBUTE | DETAILS |
|---|---|
| Historical Period | 2020-2023 |
| Base Year | 2024 |
| Forecast Period | 2025-2032 |
| Dental Tourism Market Size 2024 | USD 12469 million |
| Dental Tourism Market , CAGR | 20.21% |
| Dental Tourism Market Size 2032 | USD 54367.89 million |
Dental Tourism Market Insights
- Market growth is driven by major cost savings, rising cosmetic dentistry demand, and limited insurance coverage in developed countries, with cosmetic dentistry leading treatment types at a market share of 44.8%.
- Key trends include growth in aesthetic procedures, digital consultations, and bundled travel packages, while individual travelers dominate patient type with a market share of 68.9% due to flexible planning.
- Competitive intensity remains high as clinics compete on accreditation, advanced technology, and patient experience, while post-treatment follow-up challenges and regulatory differences act as key restraints.
- Asia Pacific leads the market with a market share of 38.7%, followed by Europe at 26.4% and North America at 21.8%, driven by destination attractiveness, cross-border mobility, and outbound patient flows.
Dental Tourism Market Segmentation Analysis:
By Treatment Type
By treatment type, cosmetic dentistry dominates the dental tourism market with a market share of 44.8%. Patients travel abroad for procedures such as veneers, teeth whitening, and smile makeovers due to significant cost savings and shorter wait times. Rising aesthetic awareness and social media influence increase demand for cosmetic outcomes. Advanced technologies and internationally trained dentists improve confidence in overseas care. Restorative dentistry follows, driven by implants and crowns, while orthodontics and preventive dentistry support longer stays and follow-up visits. Cosmetic dentistry leads due to discretionary demand, bundled treatment packages, and strong value perception.
- For instance, Bangkok International Dental Center operates over 20 specialized dental suites and uses more than 30 chairside CAD/CAM units to deliver same-day veneers.
By Service Provider
By service provider, dental clinics lead the dental tourism market with a market share of 52.6%. Clinics offer flexible scheduling, personalized care, and competitive pricing. Many clinics cater specifically to international patients with multilingual staff and travel coordination. Modern equipment and accreditation enhance trust. Specialty dental centers follow, driven by complex procedures and advanced capabilities. Dental hospitals serve high-volume cases but face longer processes. Clinics remain dominant due to faster turnaround, tailored patient experiences, and strong partnerships with travel facilitators and hotels.
- For instance, Clove Dental manages a vast network of clinics and has completed a significant number of implant procedures utilizing advanced guided surgery workflows.
By Patient Type
By patient type, individual travelers account for a market share of 68.9%, leading dental tourism demand. Patients prefer independent planning to customize treatments and travel schedules. Online research and direct clinic communication enable informed choices. Individual travelers seek privacy, flexibility, and tailored care plans. Group medical tourists follow, driven by employer-sponsored programs and insurance tie-ups. Individuals dominate due to ease of booking, wider destination choice, and growing confidence in self-managed medical travel supported by digital platforms.
Key Growth Drivers
Significant Cost Savings and Treatment Affordability
Cost advantage remains the primary driver of dental tourism growth. Patients travel abroad to access dental procedures at substantially lower prices than in home countries. High costs of cosmetic and restorative dentistry in developed markets encourage overseas treatment. Limited insurance coverage for elective dental procedures further increases outbound travel. Clinics in emerging destinations offer bundled packages that reduce overall expenses. Transparent pricing improves patient confidence. Affordable treatment without compromising quality attracts international patients. This driver strongly supports rising patient volumes and repeat visits. Cost-driven demand continues to shape destination choice and market expansion.
- For instance, Dentzz Dental Care reports completing numerous full-mouth rehabilitation cases using personalized treatment plans that encompass diagnostics, surgery, and prosthetics.
Improved Quality of Care and Advanced Dental Technologies
Quality improvements strengthen confidence in dental tourism destinations. Clinics invest in advanced imaging, implant systems, and digital dentistry tools. Internationally trained dentists deliver procedures aligned with global standards. Accreditation and hygiene protocols enhance patient trust. Shorter waiting times improve treatment accessibility. Advanced technology improves precision and recovery outcomes. Clinics promote modern infrastructure to attract overseas patients. This driver reduces perceived risk and supports complex procedure demand. Quality assurance remains critical for sustained market credibility and long-term growth.
- For instance, Raffles Dental operates multiple clinics and utilizes cone-beam CT systems across its surgical centers for accurate implant planning.
Growth of Medical Tourism Infrastructure and Travel Support
Supportive infrastructure plays a key role in market growth. Governments promote dental tourism through policy incentives and destination branding. Clinics partner with travel agencies, hotels, and facilitators. Dedicated patient coordinators simplify scheduling and logistics. Improved air connectivity and visa facilitation reduce travel barriers. Hospitality services enhance patient comfort during treatment stays. This integrated ecosystem improves overall experience. Infrastructure development strengthens destination competitiveness. Coordinated medical and travel services continue to drive market scalability.
Key Trends & Opportunities
Rising Demand for Cosmetic and Aesthetic Dental Procedures
Aesthetic dentistry demand continues to rise globally. Patients seek veneers, whitening, and smile enhancement procedures. Social media influence and appearance awareness fuel interest. Cosmetic treatments suit short travel durations and bundled care. Clinics market digital smile design services to differentiate offerings. This trend creates strong revenue opportunities. Cosmetic focus increases discretionary spending. Growth in aesthetic demand supports premium service positioning. Clinics leverage this trend to attract high-value international patients.
- For instance, Apollo White Dental reports delivering over 180,000 cosmetic procedures supported by intraoral scanners and 3D facial analysis tools.
Digital Platforms and Direct Patient Engagement
Digital channels reshape patient acquisition strategies. Patients research destinations and clinics online before traveling. Reviews, testimonials, and virtual consultations influence decisions. Clinics use websites and social media for global outreach. Teleconsultation improves pre-treatment planning. Direct engagement reduces reliance on intermediaries. This trend improves transparency and trust. Digital marketing lowers acquisition costs. Technology-enabled communication creates scalable growth opportunities.
- For instance, the Bumrungrad International Dental Center manages a high volume of appointments and patient inquiries through its integrated digital platform and hospital-wide patient portal.
Key Challenges
Post-Treatment Follow-Up and Continuity of Care Issues
Follow-up care presents a major challenge in dental tourism. Some procedures require ongoing monitoring. Distance complicates aftercare coordination. Patients may face difficulties managing complications locally. Lack of continuity can affect outcomes. Clinics attempt remote support, but limitations remain. This challenge impacts confidence for complex treatments. Addressing follow-up gaps remains critical for patient satisfaction. Continuity concerns influence treatment selection and destination choice.
Regulatory Differences and Perceived Quality Risks
Regulatory variation across countries creates uncertainty. Standards and patient protection laws differ widely. Patients worry about legal recourse if issues arise. Inconsistent accreditation affects destination credibility. Quality perception varies by clinic and country. Managing expectations remains challenging. Clinics invest in certifications to reduce concerns. Addressing regulatory transparency is essential. This challenge influences trust and long-term market sustainability.
Regional Analysis
North America
North America holds a market share of 21.8% in the dental tourism market, driven by outbound travel from the United States and Canada. High domestic treatment costs and limited insurance coverage for elective dentistry encourage patients to seek overseas care. Patients primarily travel for cosmetic and restorative procedures. Awareness of international accreditation and quality standards supports confidence in foreign clinics. Online research and facilitator services ease planning. Although the region is a major source market rather than a destination, strong outbound volumes sustain its share. Cost pressure and long wait times continue to influence patient decisions.
Europe
Europe accounts for a market share of 26.4%, supported by both inbound and outbound dental tourism flows. Western European patients travel to Central and Eastern Europe for affordable treatments. Countries within the region benefit from short travel distances and cultural familiarity. High demand for implants, crowns, and cosmetic procedures drives travel. EU mobility and standardized care expectations support cross-border treatment. Clinics promote transparent pricing and fast access. Europe’s strong share reflects balanced demand, ease of travel, and rising acceptance of regional dental tourism destinations.
Asia Pacific
Asia Pacific leads the dental tourism market with a market share of 38.7%, driven by strong destination countries offering high-quality care at competitive prices. Thailand, India, Malaysia, and South Korea attract international patients for cosmetic and restorative dentistry. Advanced clinics, skilled dentists, and modern infrastructure enhance appeal. Favorable exchange rates and bundled treatment packages support value perception. Governments actively promote medical tourism. Asia Pacific’s leadership reflects its role as a preferred destination, large patient inflows, and continuous investment in dental tourism infrastructure.
Rest of the World
The Rest of the World region holds a market share of 13.1%, supported by emerging destinations in Latin America and the Middle East. Mexico and Costa Rica attract patients from North America due to proximity and affordability. The Middle East benefits from premium dental services and hospitality integration. Africa remains at an early stage with limited infrastructure. Growing awareness and regional investment support gradual growth. Although smaller in size, the region offers steady expansion potential through destination development and improving healthcare access.
Dental Tourism Market Segmentations:
By Treatment Type
- Cosmetic dentistry
- Restorative dentistry
- Orthodontics
- Preventive dentistry
By Service Provider
- Dental hospitals
- Dental clinics
- Specialty dental centers
By Patient Type
- Individual travelers
- Group medical tourists
By Geography
- North America
- U.S.
- Canada
- Mexico
- Europe
- Germany
- France
- U.K.
- Italy
- Spain
- Rest of Europe
- Asia Pacific
- China
- Japan
- India
- South Korea
- South-east Asia
- Rest of Asia Pacific
- Latin America
- Brazil
- Argentina
- Rest of Latin America
- Middle East & Africa
- GCC Countries
- South Africa
- Rest of the Middle East and Africa
Competitive Landscape
Competitive landscape analysis highlights competition led by Apollo White Dental, Bumrungrad International Dental Center, Bangkok International Dental Center, Raffles Dental, and Dentzz Dental Care. These players compete through treatment quality, international accreditation, and integrated travel support. Leading clinics focus on cosmetic and restorative dentistry, which attracts high-value international patients. Competitive differentiation depends on advanced technology adoption, skilled dentists, and transparent pricing. Many providers offer bundled packages covering treatment, accommodation, and logistics. Digital marketing and online consultations support global patient acquisition. Regional players leverage location advantages and cost efficiency to attract outbound patients from North America and Europe. Overall competition remains fragmented, with clinics expanding capacity, upgrading infrastructure, and strengthening patient experience to capture growing global dental tourism demand.
Key Player Analysis
- Apollo White Dental
- Bumrungrad International Dental Center
- Fortis Healthcare
- Bangkok International Dental Center
- Raffles Dental
- Dentzz Dental Care
- Clove Dental
- Pacific Dental Services
- Thailand Smile Dental Clinic
- Asiri Dental Hospital
Recent Developments
- In November 2025, Raffles Dental was included in the global dental tourism market overview, reflecting its growing footprint among international dental care leaders.
- In November 2025, Apollo White Dental (part of Apollo Hospitals) was featured in a global dental tourism market report as a key industry player driving growth and service innovation.
- In June 2025, Fortis Healthcare was recognized for its global contribution to medical value travel, highlighting its role in international patient services that include dental treatments.
Report Coverage
The research report offers an in-depth analysis based on Treatment Type, Service Provider, Patient Type and Geography. It details leading market players, providing an overview of their business, product offerings, investments, revenue streams, and key applications. Additionally, the report includes insights into the competitive environment, SWOT analysis, current market trends, as well as the primary drivers and constraints. Furthermore, it discusses various factors that have driven market expansion in recent years. The report also explores market dynamics, regulatory scenarios, and technological advancements that are shaping the industry. It assesses the impact of external factors and global economic changes on market growth. Lastly, it provides strategic recommendations for new entrants and established companies to navigate the complexities of the market.
Future Outlook
- Dental tourism demand will rise due to sustained cost advantages.
- Cosmetic dentistry will remain the primary treatment focus.
- Asia Pacific will continue to attract the highest patient inflows.
- Clinics will invest more in advanced dental technologies.
- International accreditation will gain importance for patient trust.
- Digital consultations will increase pre-treatment planning efficiency.
- Bundled treatment and travel packages will become more common.
- Patient experience and hospitality services will drive differentiation.
- Regulatory transparency will improve to address quality concerns.
- Competition will intensify as new destinations enter the market.
Request a Free Sample
Fill in your details and we'll send you a free sample report.
- Sample data tables & charts
- Research methodology
Need a Custom Version of This Report?
Tailor the scope, geography, or segments to your exact requirements.
- Custom geography or segment scope
- Direct access to our analyst team
Frequently Asked Questions
What is the current market size for Dental Tourism market, and what is its projected size in 2032?
At what Compound Annual Growth Rate is the Dental Tourism market projected to grow between 2024 and 2032?
Which Dental Tourism market segment held the largest share in 2024?
What are the primary factors fueling the growth of the Dental Tourism market?
Who are the leading companies in the Dental Tourism market?
Which region commanded the largest share of the Dental Tourism market in 2024?
Table of Content
Chapter 1. Report Introduction
- 1.1 Report Description & Purpose
- 1.1.1 Report Title & Market Definition
- 1.1.2 Unique Selling Propositions (USP) & Key Differentiators
- 1.1.3 Value Proposition for Stakeholders
- 1.2 Research Objectives
- 1.2.1 Market Sizing Objectives (Volume & Revenue)
- 1.2.2 Segmentation Objectives
- 1.2.3 Competitive Intelligence Objectives
- 1.2.4 Forecast & Scenario Objectives
- 1.3 Report Scope
- 1.3.1 Dental Tourism Scope – Types & Subtypes Covered
- 1.3.2 Geographic Scope – Regions & Countries Covered
- 1.3.3 Historical Period, Base Year & Forecast Period (2024; forecast to 2032)
- 1.3.4 Inclusions & Exclusions
- 1.4 HS Code & Classification Framework
- 1.5 Currency, Units & Pricing Basis
- 1.6 Target Stakeholders
- 1.7 Limitations & Assumptions
Chapter 2. Executive Summary
- 2.1 Global Dental Tourism Market Snapshot
- 2.1.1 Market Size – Historical (2024) & Forecast (2024-2032) (2024: USD 12469 million → 2032: USD 54367.89 million)
- 2.1.2 Volume & Revenue – Global Totals
- 2.1.3 Key Market Highlights – Top Five Facts
- 2.2 Dental Tourism Market Segmentation Snapshot
- 2.2.1 Market Split by Region – 2024 vs. 2032
- 2.3 Competitive Snapshot
- 2.3.1 Top 10 Players by Revenue Share – 2024
- 2.3.2 Top 10 Players by Volume Share – 2024
- 2.3.3 Recent Strategic Developments (18-Month Summary)
- 2.4 Key Investment Highlights & Strategic Conclusions
Chapter 3. Dental Tourism Market Dynamics & Industry Analysis
- 3.1 Market Overview & Context
- 3.1.1 Dental Tourism Market Position in the Broader Automotive Value Chain
- 3.1.2 OEM vs. Replacement Market Dynamics
- 3.1.3 Market Maturity & Development Stage by Region
- 3.2 Dental Tourism Market Drivers
- 3.3 Dental Tourism Market Restraints & Challenges
- 3.4 Dental Tourism Market Opportunities
- 3.5 Porter's Five Forces Analysis
- 3.5.1 Threat of New Entrants
- 3.5.2 Bargaining Power of Suppliers
- 3.5.3 Bargaining Power of Buyers
- 3.5.4 Threat of Substitutes
- 3.5.5 Competitive Rivalry – Intensity Assessment
- 3.6 Dental Tourism Value Chain Analysis
- 3.6.1 Upstream – Raw Material/Input Suppliers
- 3.6.1.1 Raw Material/Input 1
- 3.6.1.2 Raw Material/Input 2
- 3.6.1.3 Raw Material/Input 3
- 3.6.2 Midstream – Production/Manufacturing/Service Delivery
- 3.6.2.1 Production/Process Overview
- 3.6.2.2 Key Facility Locations & Capacity by Manufacturer
- 3.6.3 Downstream – Distribution & End Consumer
- 3.6.3.1 Primary Channel – B2B/OEM
- 3.6.3.2 Secondary Channels – Dealer, Retail, Online, Direct
- 3.6.4 Value Chain Profitability Analysis
- 3.6.1 Upstream – Raw Material/Input Suppliers
- 3.7 PESTEL Analysis
- 3.7.1 Political Factors
- 3.7.2 Economic Factors
- 3.7.3 Social Factors
- 3.7.4 Technological Factors
- 3.7.5 Environmental Factors
- 3.7.6 Legal Factors
- 3.8 Dental Tourism Supply Chain Analysis
- 3.8.1 Raw Material/Input Supply Risk Assessment
- 3.8.2 Manufacturing Concentration Risk (Geographic Exposure)
- 3.8.3 Trade Disruption Impact Analysis
- 3.9 Regulatory & Policy Landscape
Note: The regulatory and policy landscape section covers regulations based on their applicability to the market, Dental Tourism category, geography, and scope of the study. Only regulatory frameworks with a material impact on operations, compliance, trade, sustainability, or market access are analyzed in detail.
Chapter 4. Key Investment Pockets & Opportunity Analysis
- 4.1 Dental Tourism Market Attractiveness Analysis
- 4.1.1 By Region – Investment Attractiveness Matrix (Volume × CAGR)
- 4.2 Absolute Revenue Growth Opportunity
- 4.2.1 By Region – Absolute USD Growth Through 2032
- 4.3 Incremental Volume Opportunity
- 4.3.1 By Region – Incremental Volume Through 2032
- 4.3.2 Segment – Incremental Volume
- 4.4 Emerging Submarket Opportunity Deep Dive (Subject to Applicability)
- 4.5 Emerging Market Opportunity Scorecards
- 4.5.1 United States
- 4.5.2 Europe
- 4.5.3 Asia
- 4.5.4 Middle East & Africa
Note: Emerging Market Opportunity Scorecards will be included based on relevance and strategic importance. Regions listed are indicative and may vary depending on data availability and market dynamics.
Chapter 5. Dental Tourism Import-Export Analysis & Trade Flows
- 5.1 Global Trade Overview
- 5.1.1 Global Export Value by Country (2024)
- 5.1.2 Global Export Volume by Country (2024)
- 5.1.3 Global Import Value by Country (2024)
- 5.1.4 Global Import Volume by Country (2024)
- 5.1.5 Net Trade Balance by Country (2024)
- 5.2 Export Analysis – Segment
- 5.2.1 Type 1 (HS Code)
- 5.2.2 Type 2 (HS Code)
- 5.2.3 Type 3 (HS Code)
- 5.2.4 Type 4 (HS Code)
- 5.2.5 Type 5 (HS Code)
- 5.3 Import Analysis – Segment
- 5.3.1 Type 1 (HS Code)
- 5.3.2 Type 2 (HS Code)
- 5.3.3 Type 3 (HS Code)
- 5.3.4 Type 4 (HS Code)
- 5.3.5 Type 5 (HS Code)
- 5.4 Average Unit Trade Prices
- 5.4.1 Average Export Price – Segment & Country
- 5.4.2 Average Import Price – Segment & Source Country
- 5.4.3 Price Trends (2024)
- 5.5 Key Trade Route Analysis
- 5.5.1 Trade Route 1
- 5.5.2 Trade Route 2
- 5.5.3 Trade Route 3
- 5.5.4 Trade Route 4
- 5.5.5 Trade Route 5
- 5.6 Trade Policy Impact Assessment
- 5.6.1 US Anti-Dumping & Section 301 Tariffs
- 5.6.2 EU Customs Union Impact
- 5.6.3 Major Free Trade Agreements
- 5.6.4 USMCA Rules of Origin
Note: Trade policy analysis will be included only where relevant to the Dental Tourism market.
Chapter 6. Competitive Landscape & Company Benchmarking
- 6.1 Dental Tourism Market Concentration & Structure
- 6.1.1 Herfindahl-Hirschman Index (HHI) – vs. 2024
- 6.1.2 Tier 1, Tier 2 & Tier 3 Market Structure
- 6.1.3 Global, Regional & Local Player Dynamics
- 6.2 Dental Tourism Market Share Analysis – 2024
- 6.2.1 Global Revenue Share by Company
- 6.2.2 Global Volume Share by Company
- 6.2.3 Regional Revenue Share
- 6.2.4 Market Share Evolution ( vs. 2024)
- 6.2.5 OEM Segment Share by Company
- 6.2.6 Replacement Segment Share by Company
- 6.3 Production/Delivery Capacity & Facility Analysis
- 6.3.1 Global Installed Capacity
- 6.3.2 Capacity Utilization Rates
- 6.3.3 Production/Output Volume
- 6.3.4 Facility Locations & Capacity Map
- 6.3.5 Planned Capacity Additions
- 6.4 Dental Tourism Competitive Benchmarking Matrix
- 6.4.1 Revenue, Volume, CAGR & Profitability Comparison
- 6.4.2 Channel Revenue Mix
- 6.4.3 Geographic Revenue Exposure
- 6.4.4 R&D Intensity
- 6.4.5 Sustainability Maturity
- 6.5 Strategic Developments in Dental Tourism (Last 24 Months)
- 6.5.1 Mergers, Acquisitions & Divestments
- 6.5.2 New Dental Tourism Launches
- 6.5.3 Facility Expansions
- 6.5.4 Strategic Alliances, Joint Ventures & Partnerships
- 6.5.5 Distribution Expansion & Market Entry
- 6.5.6 Sustainability & ESG Initiatives
- 6.6 Competitive Strategy Mapping
- 6.6.1 Leader, Challenger, Follower & Niche Classification
- 6.6.2 Pricing Strategy Comparison
- 6.6.3 Channel Strategy Matrix
Note: Strategic developments are included based on their materiality and the availability of reliable information.
Chapter 7. Global Dental Tourism Market – By Distribution Channel
- 7.1 Segment Overview
- 7.1.1 Volume & Revenue Split by Channel (2024 & 2032)
- 7.1.2 Channel Mix Evolution (2024-2032)
Chapter 8. Regional Market Analysis – Global Overview
- 8.1 Global Regional Overview
- 8.1.1 Regional Volume Share
- 8.1.2 Regional Revenue Share
- 8.1.3 Regional Volume by Region
- 8.1.4 Regional Revenue by Region
- 8.1.5 Regional Forecast Through 2032
- 8.2 Cross-Regional Segment Analysis
- 8.2.1 By Distribution Channel
- 8.2.2 By Brand/Price Tier
Chapter 9. North America Dental Tourism Market
- 9.1 United States
- 9.2 Canada
- 9.3 Mexico
Chapter 10. Europe Dental Tourism Market
- 10.1 Germany
- 10.2 France
- 10.3 Italy
- 10.4 United Kingdom
- 10.5 Spain
- 10.6 Poland
- 10.7 Russia
- 10.8 Netherlands
- 10.9 Belgium
- 10.10 Sweden
- 10.11 Denmark
- 10.12 Norway
- 10.13 Rest of Europe
Chapter 11. Asia Pacific Dental Tourism Market
- 11.1 China
- 11.2 India
- 11.3 Japan
- 11.4 South Korea
- 11.5 Thailand
- 11.6 Indonesia
- 11.7 Vietnam
- 11.8 Malaysia
- 11.9 Australia
- 11.10 Rest of Asia Pacific
Chapter 12. Latin America Dental Tourism Market
- 12.1 Brazil
- 12.2 Argentina
- 12.3 Colombia
- 12.4 Chile
- 12.5 Rest of Latin America
Chapter 13. Middle East Dental Tourism Market
- 13.1 Saudi Arabia
- 13.2 United Arab Emirates
- 13.3 Turkey
- 13.4 Israel
- 13.5 Iran
- 13.6 Rest of the Middle East
Chapter 14. Africa Dental Tourism Market
- 14.1 South Africa
- 14.2 Egypt
- 14.3 Nigeria
- 14.4 Morocco
- 14.5 Rest of Africa
Chapter 15. Dental Tourism Company Profiles
- 15.1 [Company 01]
- 15.1.1 Company Overview
- 15.1.2 Key Management Personnel
- 15.1.3 Products & Services Portfolio
- 15.1.4 Financial Performance
- 15.1.5 Key Market Focus & Geographic Presence
- 15.1.6 Recent Developments & Strategic Initiatives
Note: The company profile list is preliminary and may change based on research findings, market developments, data availability, and client requirements.
Chapter 16. Appendices
- Appendix A – List of Abbreviations & Acronyms
- Appendix B – Industry Classification Code Reference – Full Series
- Appendix C – Production & Capacity Data Tables
- Appendix D – End-Use & Demand Base Tables
- Appendix E – Consumption & Replacement Rate Assumptions
- Appendix F – ASP Reference Tables
- Appendix G – Manufacturing & Facility Database
- Appendix H – Import-Export Data Tables
- Appendix I – Regulatory Summary Tables
- Appendix J – Primary Research Participant List (Anonymized)
- Appendix K – Primary Research Questionnaire Framework
- Appendix L – Data Sources & Bibliography
- Appendix M – Market Size Divergence & Source Comparison
Chapter 17. Research Methodology
- 17.1 Research Framework & Philosophy
- 17.2 Secondary Research – Sources, Hierarchy & Data Extraction
- 17.3 Data Modeling – Bottom-Up & Top-Down Market Sizing
- 17.4 Primary Research – Stakeholder Framework, LOI & Sample Sizes
- 17.5 Forecast Methodology – Regression, Scenario & Sensitivity Analysis
- 17.6 Quality Control – Four-Layer Validation Framework
- 17.7 Limitations & Standard Assumptions
- 17.8 Disclaimer
