Market Overview
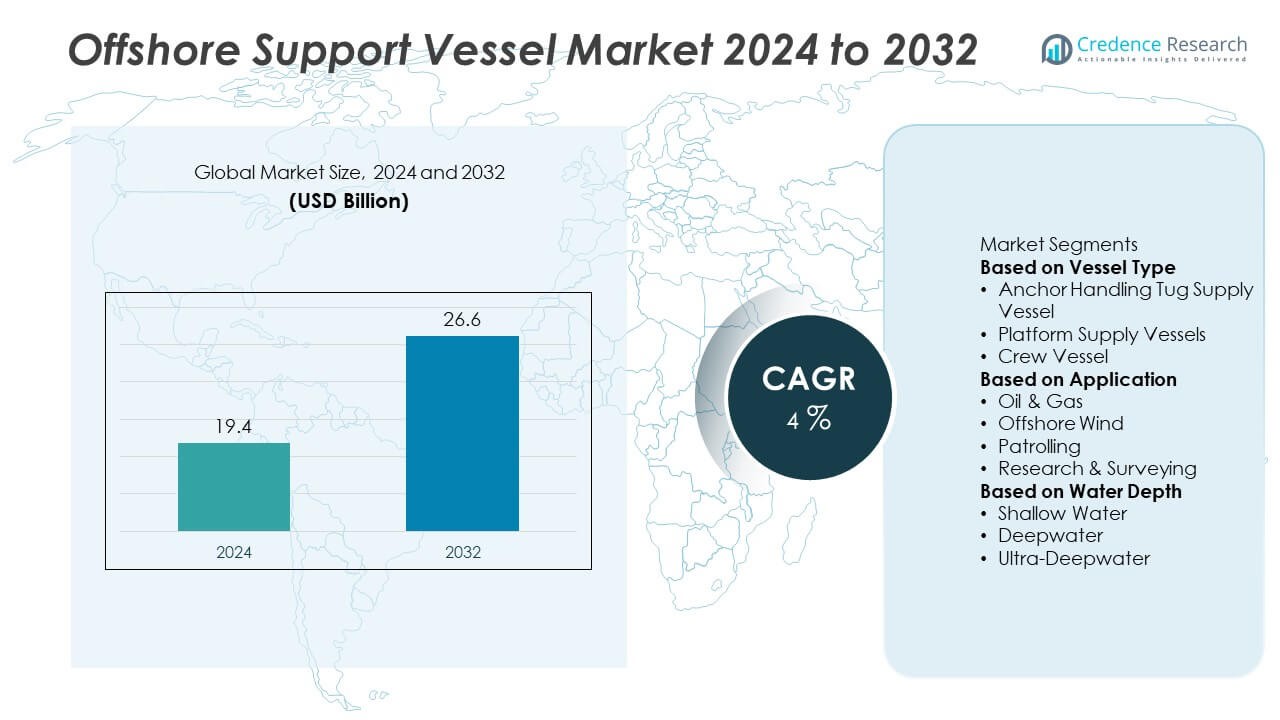
The Offshore Support Vessel Market size was valued at USD 19.4 Million in 2024 and is projected to reach USD 26.6 Million by 2032, growing at a CAGR of 4% during the forecast period.
| REPORT ATTRIBUTE |
DETAILS |
| Historical Period |
2020-2024 |
| Base Year |
2024 |
| Forecast Period |
2025-2032 |
| Offshore Support Vessel Market Size 2024 |
USD 19.4 Million |
| Offshore Support Vessel Market, CAGR |
4% |
| Offshore Support Vessel Market Size 2032 |
USD 26.6 Million |
The Offshore Support Vessel Market grows through rising offshore oil and gas exploration, supported by expanding deepwater and ultra-deepwater projects that require reliable logistics and operational support. Strong drivers include growing investments in offshore wind farms.
The Offshore Support Vessel Market demonstrates strong geographical presence across North America, Europe, Asia Pacific, Latin America, and the Middle East & Africa. North America leads with robust offshore oil and gas activity in the Gulf of Mexico and growing offshore wind projects along the U.S. East Coast. Europe shows steady growth supported by extensive offshore wind farms in the North Sea and continued oilfield operations in Norway and the UK. Asia Pacific emerges as a key growth region with China, Japan, and India investing in offshore exploration and renewable energy developments. Latin America strengthens its role through Brazil’s pre-salt oilfields and Mexico’s offshore projects, while the Middle East & Africa expand vessel demand for large offshore oil and gas fields. Key players driving competitiveness in the market include Maersk Supply Service, Solstad Offshore ASA, Tidewater Marine, and BOURBON, who focus on fleet modernization, hybrid propulsion technologies, and digital integration to strengthen efficiency and global presence.
Access crucial information at unmatched prices!
Request your sample report today & start making informed decisions powered by Credence Research Inc.!
Download Sample
Market Insights
- The Offshore Support Vessel Market was valued at USD 19.4 billion in 2024 and is projected to reach USD 26.6 billion by 2032, growing at a CAGR of 4% during the forecast period.
- Demand grows as offshore oil and gas exploration expands into deeper waters, requiring anchor handling, supply, and crew transfer vessels to sustain drilling and production activities.
- Offshore wind projects create significant opportunities, with vessels supporting turbine installation, subsea cable laying, and long-term maintenance operations for renewable energy infrastructure.
- The market is highly competitive, with leading companies such as Maersk Supply Service, Solstad Offshore ASA, Tidewater Marine, and BOURBON modernizing fleets and investing in hybrid propulsion and digital navigation technologies.
- High operating costs, volatile fuel prices, and strict regulatory frameworks on emissions and safety standards act as restraints, creating financial pressure for operators and smaller fleet owners.
- North America benefits from offshore oilfields in the Gulf of Mexico and expanding wind projects, Europe focuses on North Sea oil and large-scale wind farms, Asia Pacific shows rapid growth driven by China, Japan, and India, while Latin America and the Middle East & Africa gradually expand through offshore oilfields and energy investments.
- Long-term opportunities lie in digitalization, predictive maintenance, autonomous vessel development, and the rising shift toward sustainable offshore operations that align with global energy transition goals.
Market Drivers
Rising Exploration and Production in Offshore Oil and Gas Fields
The Offshore Support Vessel Market grows with expanding offshore oil and gas projects worldwide. Energy companies increase investments in deepwater and ultra-deepwater fields to meet rising energy demand. Offshore support vessels provide essential logistics, crew transfers, and supply operations for these projects. Their role in transporting drilling equipment and subsea tools strengthens market need. Governments in resource-rich regions encourage exploration through licensing and development programs. It positions offshore support vessels as a vital link in sustaining offshore production activities.
- For instance, SEACOR Marine operates a fleet of Fast Support Vessels (FSVs) that includes various classes of ships. Their high-speed catamaran FSVs, known as Crewzers, can carry up to 150 passengers and reach speeds of over 40 knots. Other FSVs, such as the M/V Ava J McCall, are capable of speeds up to 38 knots and are equipped with powerful 13,500 BHP propulsion systems. These FSVs serve as efficient, cost-effective, and comfortable alternatives to helicopter transport for personnel and cargo.
Growing Demand for Offshore Wind Energy Projects
The Offshore Support Vessel Market benefits from the rapid expansion of offshore wind energy installations. Wind farm developers require vessels for cable laying, turbine installation, and maintenance operations. Specialized vessels equipped with advanced dynamic positioning systems support precise operations at sea. Countries in Europe, Asia, and North America allocate significant budgets to accelerate renewable energy targets. Offshore support vessels enable timely construction and servicing of large-scale wind projects. It strengthens their relevance in the global shift toward cleaner energy sources.
- For instance, BOURBON signed a five-year charter with Eni Congo for the future deployment of six new S200X-G2 crewboats, which are 20-meter vessels seating 30 passengers with a foredeck area of 25 m². The vessels are scheduled for delivery progressively between June and December 2026. The S200X-G2s are designed with built-in energy performance systems expected to reduce fuel use by around 20% compared to previous models.
Advancement of Offshore Infrastructure and Subsea Developments
The Offshore Support Vessel Market gains momentum through advancements in offshore infrastructure and subsea projects. Operators deploy vessels to support subsea construction, pipeline installation, and inspection services. Increased reliance on remotely operated vehicles (ROVs) and subsea systems drives demand for multipurpose vessels. Shipbuilders integrate advanced technologies such as hybrid propulsion to improve operational efficiency. Offshore infrastructure growth requires reliable marine logistics to ensure safe and timely project execution. It highlights the expanding scope of offshore support vessels in complex offshore operations.
Rising Global Trade and Maritime Security Operations
The Offshore Support Vessel Market also benefits from growth in maritime trade and coastal security activities. Nations strengthen naval and coast guard fleets with support vessels to safeguard offshore resources. Offshore platforms rely on patrol and standby vessels for emergency response and crew safety. Expanding seaborne trade increases demand for support services in congested maritime zones. Shipbuilders design vessels with enhanced safety and communication systems to meet security requirements. It reflects the dual role of offshore support vessels in both commercial and defense applications.
Market Trends
Shift Toward Hybrid and Fuel-Efficient Propulsion Systems
The Offshore Support Vessel Market witnesses a shift toward hybrid and fuel-efficient propulsion technologies. Operators prioritize vessels with lower fuel consumption to reduce operational costs and emissions. Shipbuilders introduce designs with dual-fuel engines and hybrid systems to meet sustainability targets. Regulatory pressure on greenhouse gas reduction accelerates adoption of eco-friendly solutions. Offshore energy projects increasingly demand vessels that balance performance with environmental compliance. It reflects the industry’s move toward cleaner and more efficient marine operations.
- For instance, ABB engineered an electric propulsion system for a 200+ metric‑ton bollard pull AHTS vessel that reduced annual fuel consumption by approximately 1,900 metric tons, showcasing the efficiency gains possible with hybrid propulsion tech.
Rising Deployment of Advanced Dynamic Positioning Systems
The Offshore Support Vessel Market shows a growing reliance on advanced dynamic positioning systems. These systems ensure precise vessel stability during offshore drilling, wind turbine installation, and subsea operations. Shipbuilders integrate high-accuracy positioning technology to reduce downtime and enhance safety. Offshore projects require uninterrupted operations, making dynamic positioning a critical trend. Investment in automation improves vessel maneuverability in harsh offshore environments. It strengthens the role of advanced navigation in supporting high-value offshore projects.
Increasing Demand for Multi-Purpose and Flexible Vessel Designs
The Offshore Support Vessel Market adapts to rising demand for multi-purpose vessel designs. Operators seek vessels that can handle cargo transport, crew accommodation, subsea inspection, and emergency response. Multi-role capabilities reduce fleet costs while improving operational flexibility. Shipbuilders respond by introducing modular layouts that can be customized for specific missions. Offshore operators value flexibility in meeting changing project requirements. It demonstrates a growing preference for versatile offshore vessel solutions.
- For instance, the Bourbon Evolution 800 is a diesel-electric, DP3 multipurpose supply vessel approximately 100 meters long. It features a large 1,200 m² deck and accommodates 105 people. The vessel is equipped for subsea operations using two Active Heave Compensation (AHC) cranes: a main crane with a lifting capacity of 150 tonnes and an auxiliary crane with a capacity of 40 tonnes. These cranes can operate at depths of up to 3,000 meters.
Integration of Digital Technologies for Fleet Optimization
The Offshore Support Vessel Market trends toward digital integration for improved fleet management. Operators adopt predictive maintenance tools, remote monitoring, and AI-driven analytics to maximize uptime. Digital twins simulate vessel performance under various conditions to optimize deployment. Data-driven solutions improve safety, efficiency, and cost savings across large fleets. The shift to connected operations aligns with broader maritime digitalization strategies. It reinforces the transformation of offshore support vessels into intelligent assets.
Market Challenges Analysis
High Operational Costs and Volatile Fuel Prices
The Offshore Support Vessel Market faces significant challenges due to high operating expenses and fluctuating fuel prices. Vessel maintenance, crew salaries, and insurance add heavy financial burdens for operators. Volatility in global fuel prices directly impacts profitability, especially for vessels operating long distances in offshore fields. Smaller operators struggle to sustain operations when costs rise faster than charter rates. Shipbuilders respond with fuel-efficient designs, but adoption requires high initial investments. It creates financial strain across the industry and limits growth for budget-constrained companies.
Regulatory Compliance and Environmental Restrictions
The Offshore Support Vessel Market also encounters challenges in meeting strict environmental and safety regulations. International Maritime Organization (IMO) rules on emissions demand costly retrofits and upgrades. Compliance with ballast water management and waste disposal standards increases operating complexity. Delays in obtaining certifications hinder vessel deployment in international waters. Operators must allocate resources to ensure adherence to evolving global regulations. It forces companies to balance compliance requirements with operational efficiency and cost control.
Market Opportunities
Expansion of Offshore Renewable Energy Projects
The Offshore Support Vessel Market holds strong opportunities with the rapid growth of offshore wind and renewable energy projects. Governments allocate significant funding to expand clean energy infrastructure, creating higher demand for vessels in turbine installation, subsea cabling, and maintenance operations. Shipbuilders design specialized vessels equipped with dynamic positioning and heavy-lift capabilities to serve large-scale offshore wind farms. Operators benefit from long-term contracts tied to renewable energy commitments. Growth in Europe, Asia, and North America strengthens the role of support vessels in green energy transitions. It ensures steady opportunities for companies investing in renewable-focused offshore fleets.
Emergence of Digitalization and Autonomous Vessel Technologies
The Offshore Support Vessel Market gains opportunities from the adoption of digital and autonomous technologies. Predictive maintenance platforms, real-time data monitoring, and AI-based navigation improve operational efficiency and fleet management. Automation reduces reliance on large crew sizes, lowering costs while enhancing safety during offshore missions. Shipyards and technology providers collaborate to test autonomous offshore support vessels with advanced control systems. Digital integration aligns with broader maritime transformation trends, creating new service models for operators. It highlights a future where offshore support vessels evolve into smarter, more cost-effective assets.
Market Segmentation Analysis:
By Vessel Type
The Offshore Support Vessel Market shows diverse segmentation by vessel type, with anchor handling tug supply vessels holding strong demand due to their critical role in offshore drilling and rig positioning. These vessels manage anchors, tow rigs, and support subsea construction, making them indispensable for deepwater operations. Platform supply vessels represent another key category, transporting equipment, drilling fluids, and provisions to offshore platforms with high efficiency. Crew vessels provide safe and reliable transport of personnel to offshore sites, offering speed and operational flexibility. Other vessels, including standby and emergency response types, contribute by improving safety and security in offshore fields. It ensures that varied vessel types collectively support the dynamic needs of offshore industries.
- For instance, the Maersk Trimmer AHTS delivers a bollard pull of 177 tonnes, offers 600 m² of open deck space, and features 400-ton anchor-handling and towing winches, with accommodation for 30 personnel.
By Application
The Offshore Support Vessel Market expands across oil and gas, offshore wind, patrolling, and research applications. Oil and gas continues to dominate demand, with vessels enabling exploration, drilling, and production support in offshore environments. Offshore wind projects create rising opportunities as vessels are deployed for turbine installation, subsea cable laying, and ongoing maintenance. Patrolling applications strengthen coastal security, requiring vessels for surveillance and emergency response. Research and surveying operations depend on specialized vessels equipped with advanced instruments for oceanographic studies and subsea mapping. It highlights the sector’s adaptability to both traditional and renewable energy domains, as well as defense and scientific needs.
- For instance, Bourbon’s PX 105 series of Platform Supply Vessels (PSVs) deliver a deadweight tonnage of 4,250 tonnes, a deck area of nearly 1,000 m², and deploy a DP2 system coupled with diesel-electric propulsion—suited for offshore deployment versatility.
By Water Depth
The Offshore Support Vessel Market further divides by operational water depth, covering shallow, deepwater, and ultra-deepwater segments. Shallow water operations continue to use a wide range of support vessels for oil, gas, and renewable projects near coastal regions. Deepwater exploration drives demand for advanced vessels with high dynamic positioning capabilities and increased endurance. Ultra-deepwater projects require multipurpose vessels capable of handling complex subsea installations, heavy lifting, and long-term logistics support. Growth in deepwater and ultra-deepwater activities emphasizes the strategic role of technologically advanced vessels. It ensures that offshore support vessels evolve to meet the operational challenges posed by greater depths and harsher marine environments.
Segments:
Based on Vessel Type
- Anchor Handling Tug Supply Vessel
- Platform Supply Vessels
- Crew Vessel
Based on Application
- Oil & Gas
- Offshore Wind
- Patrolling
- Research & Surveying
Based on Water Depth
- Shallow Water
- Deepwater
- Ultra-Deepwater
Based on the Geography:
- North America
- Europe
- UK
- France
- Germany
- Italy
- Spain
- Russia
- Belgium
- Netherlands
- Austria
- Sweden
- Poland
- Denmark
- Switzerland
- Rest of Europe
- Asia Pacific
- China
- Japan
- South Korea
- India
- Australia
- Thailand
- Indonesia
- Vietnam
- Malaysia
- Philippines
- Taiwan
- Rest of Asia Pacific
- Latin America
- Brazil
- Argentina
- Peru
- Chile
- Colombia
- Rest of Latin America
- Middle East
- UAE
- KSA
- Israel
- Turkey
- Iran
- Rest of Middle East
- Africa
- Egypt
- Nigeria
- Algeria
- Morocco
- Rest of Africa
Regional Analysis
North America
North America accounts for nearly 32% of the global Offshore Support Vessel Market in 2024, positioning it as one of the leading regional markets. The United States drives demand with extensive offshore oil and gas projects in the Gulf of Mexico and growing investments in offshore wind energy along the East Coast. Canada contributes through Arctic offshore exploration and development of marine infrastructure. U.S. operators deploy anchor handling tug supply vessels and platform supply vessels to support drilling and production, while new contracts focus on specialized vessels for offshore wind turbine installation. Investments in shipbuilding and retrofitting of fleets align with stricter environmental standards, supporting low-emission and hybrid propulsion technologies. It reinforces North America’s leadership in both oil and gas and renewable offshore energy support operations.
Europe
Europe holds around 28% of the global Offshore Support Vessel Market in 2024, driven by its strong offshore wind and oilfield presence. Countries such as the United Kingdom, Norway, and Denmark remain central to demand with North Sea projects, while Germany, the Netherlands, and France accelerate vessel usage for offshore wind development. The region emphasizes advanced vessel technology, including dynamic positioning systems and hybrid propulsion, to meet strict European Union emission standards. European shipbuilders lead in producing multipurpose vessels that serve both oil and gas platforms and renewable installations. The expansion of offshore wind farms in the North Sea continues to drive requirements for cable-laying and crew transfer vessels. It positions Europe as a hub for sustainable offshore vessel operations with increasing reliance on modern fleets.
Asia Pacific
Asia Pacific represents nearly 25% of the global Offshore Support Vessel Market in 2024, making it one of the fastest-growing regions. China dominates through its offshore oilfields in the South China Sea and its ambitious offshore wind energy projects. Japan and South Korea invest heavily in advanced offshore vessels to serve their growing renewable energy targets. India also emerges as a significant market, with offshore oil exploration in the Arabian Sea and Bay of Bengal requiring high-capacity supply vessels. Southeast Asian nations such as Indonesia, Malaysia, and Vietnam continue to rely on offshore support vessels for oil production and energy exports. Shipyards in China and South Korea expand their production capabilities, offering cost-effective yet technologically advanced vessels. It ensures Asia Pacific maintains a strong growth trajectory supported by both oil and renewable offshore projects.
Latin America
Latin America accounts for about 9% of the global Offshore Support Vessel Market in 2024, with Brazil leading regional demand through its extensive offshore oilfields in the pre-salt basins. Mexico contributes with offshore developments in the Gulf of Mexico, supported by both domestic and foreign energy firms. Other nations, including Argentina and Colombia, show gradual adoption as offshore energy activities expand. Regional operators focus on platform supply vessels and anchor handling tug supply vessels to maintain production in deepwater fields. Economic challenges slow large-scale adoption, yet international collaborations and foreign investments improve fleet modernization. It secures steady growth in Latin America, supported by vast offshore oil reserves and strategic maritime developments.
Middle East and Africa (MEA)
The Middle East and Africa together hold nearly 6% of the global Offshore Support Vessel Market in 2024, representing the smallest but steadily expanding regional share. The Gulf Cooperation Council (GCC) nations, led by Saudi Arabia, Qatar, and the United Arab Emirates, dominate demand with large offshore oil production and infrastructure projects. Africa contributes through offshore fields in Nigeria, Angola, and Ghana, creating demand for vessels that support drilling and subsea activities. Limited infrastructure and high capital requirements constrain broader adoption, but new investments in hybrid and multipurpose vessels strengthen the fleet base. Maritime security concerns drive requirements for patrol and standby vessels in both the Middle East and African waters. It reflects a gradual but consistent expansion of offshore support vessels in MEA as energy investments and security needs rise.
Access crucial information at unmatched prices!
Request your sample report today & start making informed decisions powered by Credence Research Inc.!
Download Sample
Key Player Analysis
- SEACOR Marine Holdings
- BOURBON
- Maersk Supply Service
- Damen Shipyards Group
- MMA Offshore Limited
- Wartsila
- Tidewater Marine
- Siem Offshore
- Solstad Offshore ASA
- “K” line (Kawasaki Kisen Kaisha, Ltd)
Competitive Analysis
The competitive landscape of the Offshore Support Vessel Market is shaped by leading players including Wartsila, Damen Shipyards Group, Solstad Offshore ASA, Maersk Supply Service, SEACOR Marine Holdings, Tidewater Marine, Siem Offshore, BOURBON, “K” Line, and MMA Offshore Limited. These companies focus on strengthening their fleets with advanced vessels equipped with hybrid propulsion systems, dynamic positioning technology, and multipurpose capabilities to address both oil and gas exploration and offshore wind projects. Investments in sustainable designs and digital integration enhance operational efficiency, reduce fuel consumption, and ensure compliance with evolving international maritime regulations. Leading operators expand their presence in high-growth regions such as Asia Pacific and Latin America through long-term contracts with energy companies and government-led renewable initiatives. Shipbuilding groups emphasize modular and versatile designs, enabling operators to adapt vessels for cargo transport, crew transfer, subsea inspection, or emergency response. Strategic partnerships, acquisitions, and fleet modernization remain central to gaining competitive advantage, while emphasis on safety, cost efficiency, and environmental performance drives continuous innovation. Together, these players maintain strong positions in a market that demands reliability, versatility, and alignment with global energy transition objectives.
Recent Developments
- In August 2025, SEACOR Marine Holdings agreed to sell two 335-foot class liftboats for $76 million, expecting closure during the third quarter; the deal promises a gain of $30.5 million and supports the firm’s strategic asset realignment.
- In July 2025, BOURBON secured a five-year charter with Eni Congo to deploy six new S200X‑G2 crewboats, set to deliver between June and December 2026; these 20‑meter vessels feature real-time energy-performance monitoring and enhanced hydrodynamics for improved operational efficiency.
- In March 2025, Siem Offshore (as Sea1 Offshore), ordered two additional offshore energy support vessels from COSCO Shipping, following an earlier order in November 2024.
- In November 2024, DOF Group completed its acquisition of Maersk Supply Service on November 1, 2024, and the acquired 22 vessels increased the combined fleet to 78 offshore/subsea vessels under the DOF brand.
Report Coverage
The research report offers an in-depth analysis based on Vessel Type, Application, Water Depth and Geography. It details leading market players, providing an overview of their business, product offerings, investments, revenue streams, and key applications. Additionally, the report includes insights into the competitive environment, SWOT analysis, current market trends, as well as the primary drivers and constraints. Furthermore, it discusses various factors that have driven market expansion in recent years. The report also explores market dynamics, regulatory scenarios, and technological advancements that are shaping the industry. It assesses the impact of external factors and global economic changes on market growth. Lastly, it provides strategic recommendations for new entrants and established companies to navigate the complexities of the market.
Future Outlook
- Demand rises for vessels supporting offshore wind farms, with operators seeking specialized installation and maintenance capabilities.
- Hybrid and zero-emission propulsion systems gain traction to meet stricter marine environmental regulations.
- Operators adopt advanced dynamic positioning systems for safer subsea operations in deeper and rougher waters.
- Multipurpose vessel designs offer flexibility for operators to support oil & gas, renewables, and emergency response with a single asset.
- Digital twins and AI-based fleet control improve routing, fuel use, and predictive maintenance strategies.
- Collaborative vessel-sharing models help operators optimize asset utilization and reduce lay-up periods.
- Growing interest emerges in unmanned or autonomous support vessels for hazardous offshore zones.
- Floating offshore wind and wave energy projects stimulate demand for highly maneuverable and specialized support boats.
- Enhanced onboard safety technologies reduce onboard risk and help meet evolving crew welfare standards.
- Regional expansion into Southeast Asia, West Africa, and Latin America boosts need for localized vessel support infrastructure.


