
Market Overview
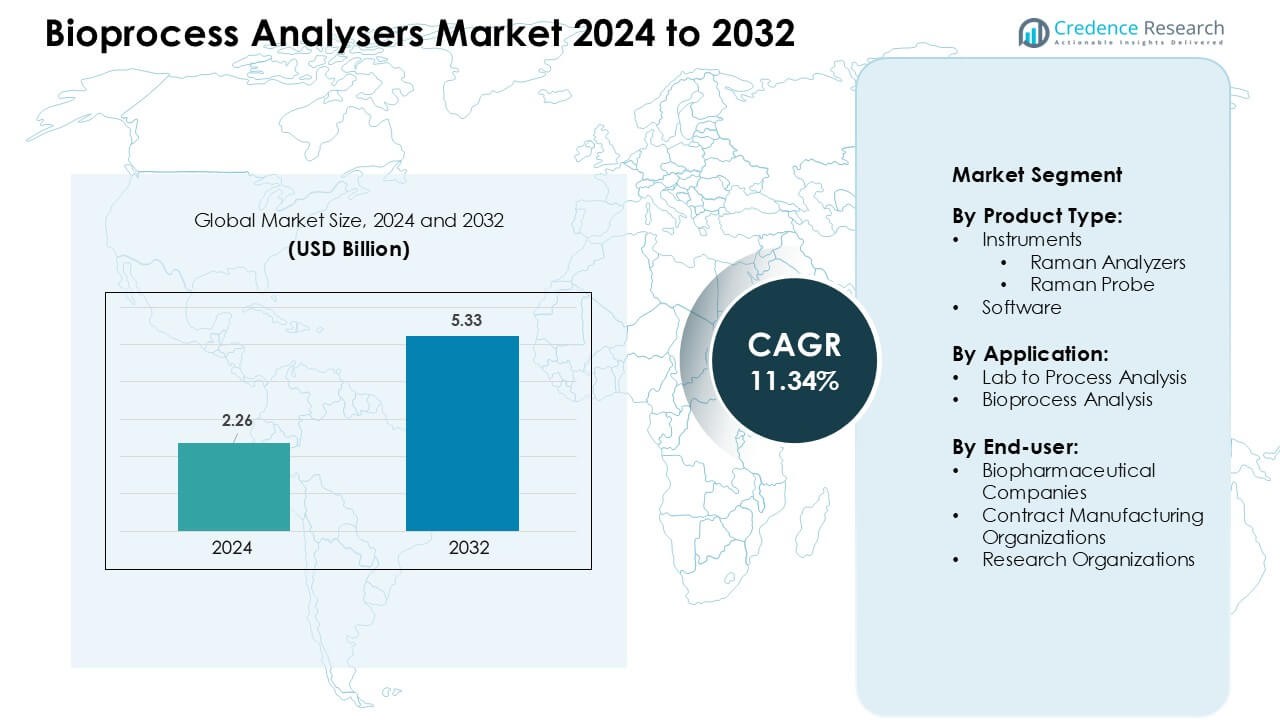
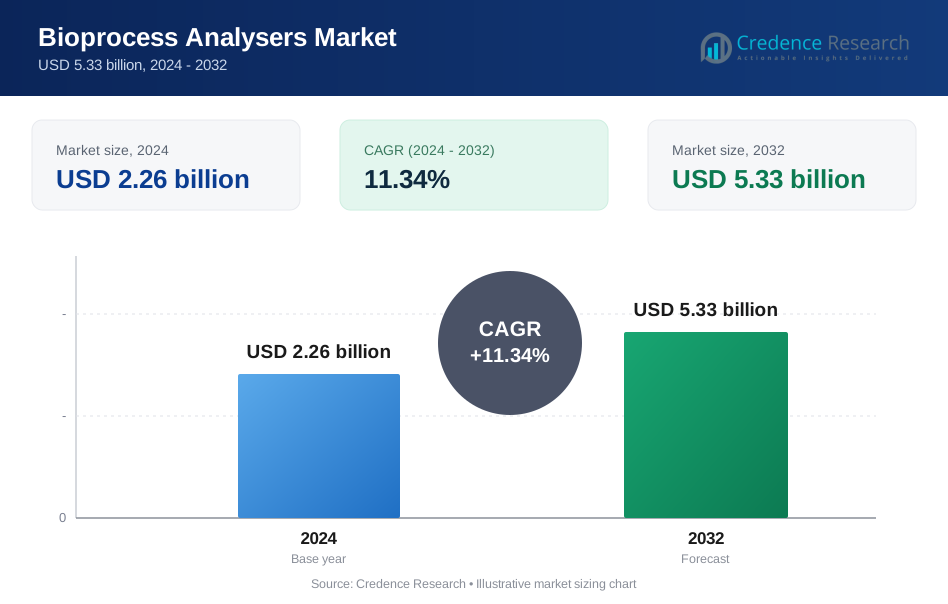
Bioprocess Analysers Market was valued at USD 2.26 billion in 2024 and is anticipated to reach USD 5.33 billion by 2032, growing at a CAGR of 11.34 % during the forecast period.
| REPORT ATTRIBUTE | DETAILS |
|---|---|
| Historical Period | 2020-2023 |
| Base Year | 2024 |
| Forecast Period | 2025-2032 |
| Bioprocess Analysers Market Size 2024 | USD 2.26 Billion |
| Bioprocess Analysers Market, CAGR | 11.34 % |
| Bioprocess Analysers Market Size 2032 | USD 5.33 Billion |
The Bioprocess Analysers Market is shaped by key players such as Sartorius AG, Randox Laboratories Ltd., Agilent Technologies, Inc., Nova Biomedical, Solida Biotech GmBH, Danaher Corporation, Eppendorf AG, Endress+Hauser Group Services AG, F. Hoffmann-La Roche Ltd., and 4BioCell GmbH & Co. KG. These companies compete by advancing real-time monitoring technologies, improving Raman and multiparameter platforms, and expanding automation for upstream and downstream bioprocesses. North America led the market in 2024 with 38% share, driven by strong biologics manufacturing, early adoption of PAT frameworks, and significant investment in digital and automated bioprocessing systems across commercial and CDMO facilities.
Market Insights
- The global Bioprocess Analysers Market is valued at approximately USD 2.26 billion in 2024 and is projected to grow at a CAGR of around 11.34%.
- Demand grows because biopharma firms increasingly adopt real-time monitoring and automation, improving batch consistency and reducing production risks.
- A rising trend involves adoption of spectroscopic and multiparameter analysers, single-use bioprocessing integration, and expansion of continuous/perfusion manufacturing systems.
- The market remains competitive, led by firms like Sartorius AG, Agilent Technologies, Inc., Danaher Corporation, Eppendorf AG, Randox Laboratories Ltd., Nova Biomedical, and others, each offering advanced sensor platforms, Raman and chemometric tools, and automated sampling solutions.
- Market restraint stems from high costs and complexity of analyser integration, calibration demands, and small-scale manufacturers’ limited ability to invest; regionally, North America holds roughly 38% share (followed by Europe ~31%, Asia-Pacific ~24%, Latin America ~4%, Middle East & Africa ~3%), while upstream and downstream process-control applications dominate segment share given widespread biologics manufacturing.
Market Segmentation Analysis:
By Product Type
Instruments dominated the Bioprocess Analysers Market in 2024, accounting for an estimated 68–72% share. Within instruments, Raman analyzers held the leading position due to strong use in real-time process monitoring and PAT initiatives in biopharmaceutical plants. Raman probes supported in-situ measurements, but demand stayed smaller than complete analyzer systems. Vendors focused on multi-parameter instruments that reduced sampling time and manual interventions. Software showed steady growth as firms integrated analytics, chemometrics, and data visualization, yet remained a secondary revenue contributor compared with high-value hardware sales.
- For instance, Renishaw rolled out its Virsa Raman analyser designed for inline, non-destructive bioprocess monitoring which continuously measures metabolite concentrations (like glucose and lactate) directly in cell-culture or fermentation vessels, enabling real-time control of critical parameters without manual sampling.
By Application
Bioprocess analysis represented the dominant application in 2024, capturing roughly 60–65% share. Adoption increased as companies shifted from end-point testing to continuous, real-time quality control in upstream and downstream operations. Bioprocess analyzers helped maintain critical quality attributes for biologics and cell-based therapies, which reduced batch failures and deviations. Lab to process analysis held the remaining share, mainly supporting method development, calibration, and model building. Many companies first validated Raman and other tools in laboratories, then scaled models into full bioprocess monitoring environments.
- For instance, Endress+Hauser (via its Raman‑analysis business) reported deploying an inline Raman system that provided 24/7 monitoring of critical parameters (glucose, lactate, amino acids, viable cell density, ammonium) in a cell culture bioreactor enabling in‑process control rather than relying on discrete sampling.
By End-user
Biopharmaceutical companies led end-user demand in 2024, with an estimated 62–67% share. Large and mid-sized biopharma firms invested heavily in bioprocess analyzers to support complex monoclonal antibody, vaccine, and cell-gene therapy pipelines. These firms prioritized in-line PAT tools to meet quality-by-design and regulatory expectations. Contract manufacturing organizations formed the second-largest group as CDMOs upgraded facilities to attract outsourcing projects. Research organizations contributed a smaller but important share, using analyzers for process innovation, scale-down studies, and early-stage development of new biologic modalities.
Key Growth Drivers:
Growing Shift Toward Real-Time Bioprocess Monitoring
Real-time monitoring drives Bioprocess Analysers Market adoption because biomanufacturers need tighter control over process variables during upstream and downstream stages. Companies face rising pressure to improve batch consistency for monoclonal antibodies, viral vectors, biosimilars, and advanced cell-based therapies. Regulatory agencies encourage continuous data capture under frameworks like PAT and QbD, which pushes firms to adopt Raman, NIR, and multiparameter analysers instead of offline lab testing. Real-time tracking reduces batch failure risks and shortens deviation-handling time, enabling higher output per bioreactor. This shift helps firms maintain compliance during scale-up, minimize manual sampling, and enhance product purity during complex biologics production. Contract manufacturers use real-time analysers to improve audit readiness and assure clients of traceable data. The rising volume of biologics approvals and expanding GMP manufacturing footprints strengthen the long-term demand for automated analysers that provide precise, continuous biochemical insights.
- For instance, AGC Biologics has implemented inline Raman‑based monitoring systems that feed into multivariate data‑analysis (MVDA) pipelines. This setup allows real‑time measurement of culture media metabolites such as glucose, lactate and amino acids directly in the bioreactor, making it possible to detect deviations from optimal conditions the moment they occur, rather than waiting for off-line sample analysis.
Expansion of Biopharmaceutical Manufacturing Capacity
Global biopharmaceutical manufacturing continues to expand, and this trend lifts demand for Bioprocess Analysers Market tools across North America, Europe, and Asia. Large players build new plants for recombinant proteins, gene therapies, and vaccines, while CDMOs add multiple single-use and stainless-steel bioreactor lines. Every new production suite needs in-line and at-line analysers to track glucose, lactate, amino acids, cell growth, and metabolite changes. Companies adopt advanced monitoring platforms to enhance yield, optimize feeding strategies, and reduce process variability during commercial-scale runs. The rise of biosimilars in markets such as India, South Korea, and China accelerates analyser deployment because competitive pricing requires tight process efficiency. Expanding regulatory expectations for automated documentation further supports analyser use. Growth in continuous and perfusion-based systems also drives upgrades to high-throughput instruments capable of handling longer, uninterrupted production cycles.
- For instance, Samsung Biologics a leading global CDMO is expanding its capacity through its second Bio Campus: its upcoming Plant 5 will add 180,000 liters of bioreactor capacity, taking the company’s total capacity to 784,000 liters across its facilities.
Rising Adoption of Automation and Digital Bioprocessing
Automation plays a central role in modern biomanufacturing, and the Bioprocess Analysers Market benefits from this trend. Digital bioprocessing relies on analysers that feed accurate, high-frequency data into control software, digital twins, and adaptive algorithms. Companies invest in automated sampling systems, machine-learning-enabled prediction models, and integrated bioreactor–analyser networks to lower manual error and enhance decision speed. Automation helps teams maintain consistent product quality during high-density cell culture, reduce reagent waste, and improve facility throughput. Biomanufacturers adopt analysers that support closed-loop feedback, particularly for fed-batch, perfusion, and continuous systems. This transition aligns with the shift toward smart factories driven by Industry 4.0 principles. CDMOs gain a competitive edge by offering automated, analyzer-driven process optimization to reduce client development timelines. Growth in digital recordkeeping and cloud-based process data systems further enhances analyser adoption across development and GMP environments.
Key Trends & Opportunities:
Growing Use of Raman and Multiparameter Analytical Platforms
Raman platforms represent a major trend because they provide non-invasive, high-precision biochemical insights without interrupting cultures. The Bioprocess Analysers Market sees wider adoption of Raman probes for glucose, lactate, and nutrient prediction models, which help execute automated feeding strategies. Multiparameter analysers that combine spectroscopy, optical sensors, and chemometrics support richer datasets that enable faster process insights. Biopharma companies use these platforms to shorten clone selection stages, support high-density perfusion cultures, and reduce off-line lab workload. Vendors invest in improved calibration models and plug-and-play probe designs, creating opportunities in both R&D and GMP manufacturing. The trend aligns with increasing demand for real-time PAT tools and digital twins that require broader and more accurate data streams.
- For instance, in a perfusion‑culture demonstration, a validated Raman model for glucose control (with RMSEP ≈ 0.2 g/L) was used to maintain glucose levels at 4 g/L (or 1.5 g/L) over multiple days with a variability of ±0.4 g/L enabling continuous, scale‑independent process control.
Opportunities in Continuous and Perfusion Bioprocessing
The rapid shift toward continuous and perfusion operations opens new opportunities for the Bioprocess Analysers Market. Continuous systems run for extended periods and require analysers that provide stable, drift-free measurements over long durations. Adoption increases as firms aim for higher productivity per bioreactor and predictable quality outcomes. Advanced analysers allow automated nutrient control, early detection of metabolic shifts, and improved harvest scheduling. Vendors gain opportunities by offering low-maintenance probes, software-driven prediction tools, and analysers built for uninterrupted monitoring. Countries expanding vaccine and cell-therapy manufacturing seek analysers that support scalable continuous production. CDMOs use these tools to differentiate service offerings and attract global biotech clients.
- For instance, researchers showed that a Raman-based platform monitoring the permeate (i.e. cell-free filtrate) from a perfusion bioreactor could reliably track analytes including glucose, lactate, glutamine, glutamate, and product titer with chemometric models robust across changes in perfusion scale and flow rate, enabling automated feed control even during long-duration perfusion runs.
Expansion of Single-Use and Modular Bioprocessing Systems
Single-use bioprocessing continues expanding, and this creates significant openings for analyser integration. The Bioprocess Analysers Market benefits because manufacturers require sensors, probes, and plug-and-play analyser modules that fit disposable bioreactors and modular cleanroom setups. Companies invest in gamma-sterilizable probes, optical sensors, and compact analysers with simple installation for single-use bags. Modular manufacturing facilities rely on analysers to support rapid line changeovers and multi-product workflows. Adoption strengthens in fast-growing regions where new plants prefer single-use over stainless-steel systems due to lower upfront cost and faster validation. Vendors offering disposable-compatible instrumentation and cloud-enabled monitoring platforms gain a strong competitive edge.
Key Challenges:
High Integration and Calibration Complexity
Integration remains a major challenge for the Bioprocess Analysers Market. Many facilities face difficulties aligning analyser data with control systems, historian software, and PAT frameworks. Calibration requires skilled staff, frequent model updates, and robust reference datasets. Raman and chemometric models often need product-specific calibration, increasing implementation time. Smaller biotechs lack the analytical expertise to manage complex setups, which slows adoption. In multi-product facilities, operators must recalibrate analysers for new cell lines, media compositions, and feeding strategies. These challenges can limit automation efficiency, raise operational costs, and prolong technology-validation timelines during GMP rollout.
High Cost Barriers for Small and Mid-Sized Biomanufacturers
Cost remains a significant barrier because advanced analysers, automated sampling systems, and integration services require substantial investment. Many smaller biotechs operate under tight development budgets and cannot afford multiparameter Raman systems or fully automated PAT suites. Upfront instrument prices, consumable costs, and ongoing maintenance increase total ownership cost. Facilities also need skilled personnel to operate analysers and interpret chemometric data, which adds further expense. These financial hurdles slow adoption in emerging markets and among early-stage companies. High cost barriers also delay upgrades from offline to real-time analysers, affecting broader digital bioprocessing expansion.
Regional Analysis
North America
North America held the leading share in 2024 with about 38% of the Bioprocess Analysers Market, supported by strong biopharmaceutical manufacturing and early adoption of PAT frameworks. The United States expanded use of Raman and multiparameter analysers across biologics, gene therapy, and vaccine facilities. CDMOs strengthened capacity and deployed automated monitoring to enhance compliance with FDA expectations. Growth in continuous and perfusion systems further increased demand. Canada added new biologics plants, enhancing analyser adoption in clinical and commercial production. Strong digital bioprocessing investments helped maintain regional leadership.
Europe
Europe captured nearly 31% of the market in 2024, driven by strong biologics production in Germany, the U.K., Switzerland, and Ireland. EU regulatory alignment with real-time monitoring and QbD standards pushed adoption of high-precision Raman probes, nutrient analysers, and automated sampling units. CDMOs in the region installed analysers to improve audit readiness and reduce batch variability across monoclonal antibody and recombinant protein lines. The region’s advanced single-use bioprocessing infrastructure supported broader deployment of disposable-compatible sensor systems. Increased investments in cell and gene therapy facilities helped accelerate analyser integration.
Asia-Pacific
Asia-Pacific accounted for about 24% of the global share in 2024, expanding quickly as China, South Korea, India, and Singapore boosted biologics and vaccine manufacturing capacity. Governments supported GMP facility growth, encouraging firms to adopt real-time analysers to improve product consistency and meet export standards. Biosimilar manufacturers expanded use of automated monitoring tools to enhance yield and reduce cost. Regional CDMOs integrated Raman, optical, and multiparameter platforms to attract global biotech contracts. Rapid expansion of single-use systems and digital bioprocessing infrastructure supported strong market momentum.
Latin America
Latin America held nearly 4% of the market in 2024, supported by growing biologics production in Brazil and Mexico. Regional manufacturers used bioprocess analysers to strengthen compliance, reduce manual sampling, and improve documentation for regulatory scrutiny. Expansion in vaccine and therapeutic protein production encouraged adoption of optical and at-line analysers. Local CDMOs modernized facilities to attract outsourcing from North American and European clients. Despite limited budgets, interest in automated monitoring increased as firms sought higher process efficiency. Broader training programs and partnerships helped accelerate adoption across development and pilot-scale operations.
Middle East & Africa
The Middle East & Africa region accounted for around 3% of the Bioprocess Analysers Market in 2024, driven by rising biomanufacturing investments in the UAE, Saudi Arabia, and South Africa. Countries expanded vaccine, biosimilar, and plasma-derived product capabilities, requiring real-time analysers to ensure process reliability. Regional stakeholders partnered with global technology suppliers to upgrade digital monitoring and improve GMP alignment. Limited local manufacturing and resource constraints slowed broad adoption, yet niche high-tech facilities deployed Raman and nutrient analysers to strengthen quality control. Growing interest in localized biologics production supports long-term development.
Market Segmentations:
By Product Type
- Instruments
- Raman Analyzer
- Raman Probe
- Software
By Application
- Lab to Process Analysis
- Bioprocess Analysis
By End-user
- Biopharmaceutical Companies
- Contract Manufacturing Organizations
- Research Organizations
By Geography
- North America
- U.S.
- Canada
- Mexico
- Europe
- Germany
- France
- U.K.
- Italy
- Spain
- Rest of Europe
- Asia Pacific
- China
- Japan
- India
- South Korea
- South-east Asia
- Rest of Asia Pacific
- Latin America
- Brazil
- Argentina
- Rest of Latin America
- Middle East & Africa
- GCC Countries
- South Africa
- Rest of the Middle East and Africa
Competitive Landscape
The Bioprocess Analysers Market features major players such as Sartorius AG, Randox Laboratories Ltd., Agilent Technologies, Inc., Nova Biomedical, Solida Biotech GmBH, Danaher Corporation, Eppendorf AG, Endress+Hauser Group Services AG, F. Hoffmann-La Roche Ltd., and 4BioCell GmbH & Co. KG, which shape industry competition through continuous technology upgrades and wider integration with digital bioprocessing systems. Companies compete by improving real-time sensing accuracy, expanding Raman and multiparameter platforms, and offering automated sampling units for upstream and downstream stages. Vendors also invest in chemometric modeling, plug-and-play probe designs, and single-use-compatible solutions to match rising demand in biologics and biosimilars. Strategic partnerships with CDMOs and biopharma manufacturers help expand global footprints, while software-driven innovations strengthen differentiation. Firms focus on reliability, regulatory alignment, and data-integration capabilities to secure long-term contracts. Growing adoption of PAT and continuous bioprocessing keeps competition active and encourages steady product innovation across all regions.
Key Player Analysis
- Sartorius AG
- Randox Laboratories Ltd.
- Agilent Technologies, Inc.
- Nova Biomedical
- Solida Biotech GmBH
- Danaher Corporation
- Eppendorf AG
- Endress+Hauser Group Services AG
- Hoffmann-La Roche Ltd.
- 4BioCell GmbH & Co. KG
Recent Developments
- In June 2025, Agilent Technologies, Inc. Launched the Infinity Lab Pro iQ Series (announced at ASMS/HPLC 2025), a next-generation LC/MS line targeted at improved sensitivity for peptides, proteins and oligonucleotides tools that are directly useful for bioprocess analytics (characterization and QC).
- In June 2025, Randox Laboratories Ltd. Launched the Evidence RABTA (Randox Access Biochip Technology Analyser) (announcement dated 27 June 2025), a new biochip-array analyser platform an advancement relevant to bioprocess/biomarker testing where multiplexed, high-throughput biochemical readouts are required.
- In Nov 2024, Sartorius AG: Opened a new Center for Bioprocess Innovation in Marlborough, USA, adding GMP suites and expanded process-development capabilities that help customers move from analytics and process development into early clinical production. (Relevant for labs deploying bioprocess analyzers alongside development workflows.
Report Coverage
The research report offers an in-depth analysis based on ProductType, Application, End-User and Geography. It details leading market players, providing an overview of their business, product offerings, investments, revenue streams, and key applications. Additionally, the report includes insights into the competitive environment, SWOT analysis, current market trends, as well as the primary drivers and constraints. Furthermore, it discusses various factors that have driven market expansion in recent years. The report also explores market dynamics, regulatory scenarios, and technological advancements that are shaping the industry. It assesses the impact of external factors and global economic changes on market growth. Lastly, it provides strategic recommendations for new entrants and established companies to navigate the complexities of the market.
Future Outlook
- Adoption of real-time PAT tools will grow as biologics production becomes more complex.
- Raman and multiparameter analysers will gain wider use in continuous and perfusion systems.
- Automated sampling units will replace manual workflows in most GMP facilities.
- Single-use compatible probes and sensors will expand with rising disposable bioreactor adoption.
- Digital twins and AI-driven process control will boost analyser integration across development and manufacturing.
- CDMOs will invest heavily in analyser-based automation to attract global outsourcing projects.
- Chemometric models will become more standardized, reducing calibration complexity for new products.
- Growth in cell and gene therapies will increase demand for high-sensitivity and low-volume analysers.
- Emerging markets will expand adoption as more biosimilar and vaccine plants come online.
- Cloud-based process data systems will strengthen remote monitoring and multi-site coordination.
Request a Free Sample
Fill in your details and we'll send you a free sample report.
- Sample data tables & charts
- Research methodology
Need a Custom Version of This Report?
Tailor the scope, geography, or segments to your exact requirements.
- Custom geography or segment scope
- Direct access to our analyst team
Frequently Asked Questions
What is the current market size for Bioprocess Analysers Market, and what is its projected size in 2032?
At what Compound Annual Growth Rate is the Bioprocess Analysers Market projected to grow between 2024 and 2032?
Which Bioprocess Analysers Market segment held the largest share in 2024?
What are the primary factors fueling the growth of the Bioprocess Analysers Market?
Who are the leading companies in the Bioprocess Analysers Market?
Which region commanded the largest share of the Bioprocess Analysers Market?
Table of Content
Chapter 1. Report Introduction
- 1.1 Report Description & Purpose
- 1.1.1 Report Title & Market Definition
- 1.1.2 Unique Selling Propositions (USP) & Key Differentiators
- 1.1.3 Value Proposition for Stakeholders
- 1.2 Research Objectives
- 1.2.1 Market Sizing Objectives (Volume & Revenue)
- 1.2.2 Segmentation Objectives
- 1.2.3 Competitive Intelligence Objectives
- 1.2.4 Forecast & Scenario Objectives
- 1.3 Report Scope
- 1.3.1 Bioprocess Analysers Scope – Types & Subtypes Covered
- 1.3.2 Geographic Scope – Regions & Countries Covered
- 1.3.3 Historical Period, Base Year & Forecast Period (2024; forecast to 2032)
- 1.3.4 Inclusions & Exclusions
- 1.4 HS Code & Classification Framework
- 1.5 Currency, Units & Pricing Basis
- 1.6 Target Stakeholders
- 1.7 Limitations & Assumptions
Chapter 2. Executive Summary
- 2.1 Global Bioprocess Analysers Market Snapshot
- 2.1.1 Market Size – Historical (2024) & Forecast (2024-2032) (2024: USD 2.26 billion → 2032: USD 5.33 billion)
- 2.1.2 Volume & Revenue – Global Totals
- 2.1.3 Key Market Highlights – Top Five Facts
- 2.2 Bioprocess Analysers Market Segmentation Snapshot
- 2.2.1 Market Split by Region – 2024 vs. 2032
- 2.3 Competitive Snapshot
- 2.3.1 Top 10 Players by Revenue Share – 2024
- 2.3.2 Top 10 Players by Volume Share – 2024
- 2.3.3 Recent Strategic Developments (18-Month Summary)
- 2.4 Key Investment Highlights & Strategic Conclusions
Chapter 3. Bioprocess Analysers Market Dynamics & Industry Analysis
- 3.1 Market Overview & Context
- 3.1.1 Bioprocess Analysers Market Position in the Broader Automotive Value Chain
- 3.1.2 OEM vs. Replacement Market Dynamics
- 3.1.3 Market Maturity & Development Stage by Region
- 3.2 Bioprocess Analysers Market Drivers
- 3.3 Bioprocess Analysers Market Restraints & Challenges
- 3.4 Bioprocess Analysers Market Opportunities
- 3.5 Porter's Five Forces Analysis
- 3.5.1 Threat of New Entrants
- 3.5.2 Bargaining Power of Suppliers
- 3.5.3 Bargaining Power of Buyers
- 3.5.4 Threat of Substitutes
- 3.5.5 Competitive Rivalry – Intensity Assessment
- 3.6 Bioprocess Analysers Value Chain Analysis
- 3.6.1 Upstream – Raw Material/Input Suppliers
- 3.6.1.1 Raw Material/Input 1
- 3.6.1.2 Raw Material/Input 2
- 3.6.1.3 Raw Material/Input 3
- 3.6.2 Midstream – Production/Manufacturing/Service Delivery
- 3.6.2.1 Production/Process Overview
- 3.6.2.2 Key Facility Locations & Capacity by Manufacturer
- 3.6.3 Downstream – Distribution & End Consumer
- 3.6.3.1 Primary Channel – B2B/OEM
- 3.6.3.2 Secondary Channels – Dealer, Retail, Online, Direct
- 3.6.4 Value Chain Profitability Analysis
- 3.6.1 Upstream – Raw Material/Input Suppliers
- 3.7 PESTEL Analysis
- 3.7.1 Political Factors
- 3.7.2 Economic Factors
- 3.7.3 Social Factors
- 3.7.4 Technological Factors
- 3.7.5 Environmental Factors
- 3.7.6 Legal Factors
- 3.8 Bioprocess Analysers Supply Chain Analysis
- 3.8.1 Raw Material/Input Supply Risk Assessment
- 3.8.2 Manufacturing Concentration Risk (Geographic Exposure)
- 3.8.3 Trade Disruption Impact Analysis
- 3.9 Regulatory & Policy Landscape
Note: The regulatory and policy landscape section covers regulations based on their applicability to the market, Bioprocess Analysers category, geography, and scope of the study. Only regulatory frameworks with a material impact on operations, compliance, trade, sustainability, or market access are analyzed in detail.
Chapter 4. Key Investment Pockets & Opportunity Analysis
- 4.1 Bioprocess Analysers Market Attractiveness Analysis
- 4.1.1 By Region – Investment Attractiveness Matrix (Volume × CAGR)
- 4.2 Absolute Revenue Growth Opportunity
- 4.2.1 By Region – Absolute USD Growth Through 2032
- 4.3 Incremental Volume Opportunity
- 4.3.1 By Region – Incremental Volume Through 2032
- 4.3.2 Segment – Incremental Volume
- 4.4 Emerging Submarket Opportunity Deep Dive (Subject to Applicability)
- 4.5 Emerging Market Opportunity Scorecards
- 4.5.1 United States
- 4.5.2 Europe
- 4.5.3 Asia
- 4.5.4 Middle East & Africa
Note: Emerging Market Opportunity Scorecards will be included based on relevance and strategic importance. Regions listed are indicative and may vary depending on data availability and market dynamics.
Chapter 5. Bioprocess Analysers Import-Export Analysis & Trade Flows
- 5.1 Global Trade Overview
- 5.1.1 Global Export Value by Country (2024)
- 5.1.2 Global Export Volume by Country (2024)
- 5.1.3 Global Import Value by Country (2024)
- 5.1.4 Global Import Volume by Country (2024)
- 5.1.5 Net Trade Balance by Country (2024)
- 5.2 Export Analysis – Segment
- 5.2.1 Type 1 (HS Code)
- 5.2.2 Type 2 (HS Code)
- 5.2.3 Type 3 (HS Code)
- 5.2.4 Type 4 (HS Code)
- 5.2.5 Type 5 (HS Code)
- 5.3 Import Analysis – Segment
- 5.3.1 Type 1 (HS Code)
- 5.3.2 Type 2 (HS Code)
- 5.3.3 Type 3 (HS Code)
- 5.3.4 Type 4 (HS Code)
- 5.3.5 Type 5 (HS Code)
- 5.4 Average Unit Trade Prices
- 5.4.1 Average Export Price – Segment & Country
- 5.4.2 Average Import Price – Segment & Source Country
- 5.4.3 Price Trends (2024)
- 5.5 Key Trade Route Analysis
- 5.5.1 Trade Route 1
- 5.5.2 Trade Route 2
- 5.5.3 Trade Route 3
- 5.5.4 Trade Route 4
- 5.5.5 Trade Route 5
- 5.6 Trade Policy Impact Assessment
- 5.6.1 US Anti-Dumping & Section 301 Tariffs
- 5.6.2 EU Customs Union Impact
- 5.6.3 Major Free Trade Agreements
- 5.6.4 USMCA Rules of Origin
Note: Trade policy analysis will be included only where relevant to the Bioprocess Analysers market.
Chapter 6. Competitive Landscape & Company Benchmarking
- 6.1 Bioprocess Analysers Market Concentration & Structure
- 6.1.1 Herfindahl-Hirschman Index (HHI) – vs. 2024
- 6.1.2 Tier 1, Tier 2 & Tier 3 Market Structure
- 6.1.3 Global, Regional & Local Player Dynamics
- 6.2 Bioprocess Analysers Market Share Analysis – 2024
- 6.2.1 Global Revenue Share by Company
- 6.2.2 Global Volume Share by Company
- 6.2.3 Regional Revenue Share
- 6.2.4 Market Share Evolution ( vs. 2024)
- 6.2.5 OEM Segment Share by Company
- 6.2.6 Replacement Segment Share by Company
- 6.3 Production/Delivery Capacity & Facility Analysis
- 6.3.1 Global Installed Capacity
- 6.3.2 Capacity Utilization Rates
- 6.3.3 Production/Output Volume
- 6.3.4 Facility Locations & Capacity Map
- 6.3.5 Planned Capacity Additions
- 6.4 Bioprocess Analysers Competitive Benchmarking Matrix
- 6.4.1 Revenue, Volume, CAGR & Profitability Comparison
- 6.4.2 Channel Revenue Mix
- 6.4.3 Geographic Revenue Exposure
- 6.4.4 R&D Intensity
- 6.4.5 Sustainability Maturity
- 6.5 Strategic Developments in Bioprocess Analysers (Last 24 Months)
- 6.5.1 Mergers, Acquisitions & Divestments
- 6.5.2 New Bioprocess Analysers Launches
- 6.5.3 Facility Expansions
- 6.5.4 Strategic Alliances, Joint Ventures & Partnerships
- 6.5.5 Distribution Expansion & Market Entry
- 6.5.6 Sustainability & ESG Initiatives
- 6.6 Competitive Strategy Mapping
- 6.6.1 Leader, Challenger, Follower & Niche Classification
- 6.6.2 Pricing Strategy Comparison
- 6.6.3 Channel Strategy Matrix
Note: Strategic developments are included based on their materiality and the availability of reliable information.
Chapter 7. Global Bioprocess Analysers Market – By Distribution Channel
- 7.1 Segment Overview
- 7.1.1 Volume & Revenue Split by Channel (2024 & 2032)
- 7.1.2 Channel Mix Evolution (2024-2032)
Chapter 8. Regional Market Analysis – Global Overview
- 8.1 Global Regional Overview
- 8.1.1 Regional Volume Share
- 8.1.2 Regional Revenue Share
- 8.1.3 Regional Volume by Region
- 8.1.4 Regional Revenue by Region
- 8.1.5 Regional Forecast Through 2032
- 8.2 Cross-Regional Segment Analysis
- 8.2.1 By Distribution Channel
- 8.2.2 By Brand/Price Tier
Chapter 9. North America Bioprocess Analysers Market
- 9.1 United States
- 9.2 Canada
- 9.3 Mexico
Chapter 10. Europe Bioprocess Analysers Market
- 10.1 Germany
- 10.2 France
- 10.3 Italy
- 10.4 United Kingdom
- 10.5 Spain
- 10.6 Poland
- 10.7 Russia
- 10.8 Netherlands
- 10.9 Belgium
- 10.10 Sweden
- 10.11 Denmark
- 10.12 Norway
- 10.13 Rest of Europe
Chapter 11. Asia Pacific Bioprocess Analysers Market
- 11.1 China
- 11.2 India
- 11.3 Japan
- 11.4 South Korea
- 11.5 Thailand
- 11.6 Indonesia
- 11.7 Vietnam
- 11.8 Malaysia
- 11.9 Australia
- 11.10 Rest of Asia Pacific
Chapter 12. Latin America Bioprocess Analysers Market
- 12.1 Brazil
- 12.2 Argentina
- 12.3 Colombia
- 12.4 Chile
- 12.5 Rest of Latin America
Chapter 13. Middle East Bioprocess Analysers Market
- 13.1 Saudi Arabia
- 13.2 United Arab Emirates
- 13.3 Turkey
- 13.4 Israel
- 13.5 Iran
- 13.6 Rest of the Middle East
Chapter 14. Africa Bioprocess Analysers Market
- 14.1 South Africa
- 14.2 Egypt
- 14.3 Nigeria
- 14.4 Morocco
- 14.5 Rest of Africa
Chapter 15. Bioprocess Analysers Company Profiles
- 15.1 [Company 01]
- 15.1.1 Company Overview
- 15.1.2 Key Management Personnel
- 15.1.3 Products & Services Portfolio
- 15.1.4 Financial Performance
- 15.1.5 Key Market Focus & Geographic Presence
- 15.1.6 Recent Developments & Strategic Initiatives
Note: The company profile list is preliminary and may change based on research findings, market developments, data availability, and client requirements.
Chapter 16. Appendices
- Appendix A – List of Abbreviations & Acronyms
- Appendix B – Industry Classification Code Reference – Full Series
- Appendix C – Production & Capacity Data Tables
- Appendix D – End-Use & Demand Base Tables
- Appendix E – Consumption & Replacement Rate Assumptions
- Appendix F – ASP Reference Tables
- Appendix G – Manufacturing & Facility Database
- Appendix H – Import-Export Data Tables
- Appendix I – Regulatory Summary Tables
- Appendix J – Primary Research Participant List (Anonymized)
- Appendix K – Primary Research Questionnaire Framework
- Appendix L – Data Sources & Bibliography
- Appendix M – Market Size Divergence & Source Comparison
Chapter 17. Research Methodology
- 17.1 Research Framework & Philosophy
- 17.2 Secondary Research – Sources, Hierarchy & Data Extraction
- 17.3 Data Modeling – Bottom-Up & Top-Down Market Sizing
- 17.4 Primary Research – Stakeholder Framework, LOI & Sample Sizes
- 17.5 Forecast Methodology – Regression, Scenario & Sensitivity Analysis
- 17.6 Quality Control – Four-Layer Validation Framework
- 17.7 Limitations & Standard Assumptions
- 17.8 Disclaimer
