
Market Overview
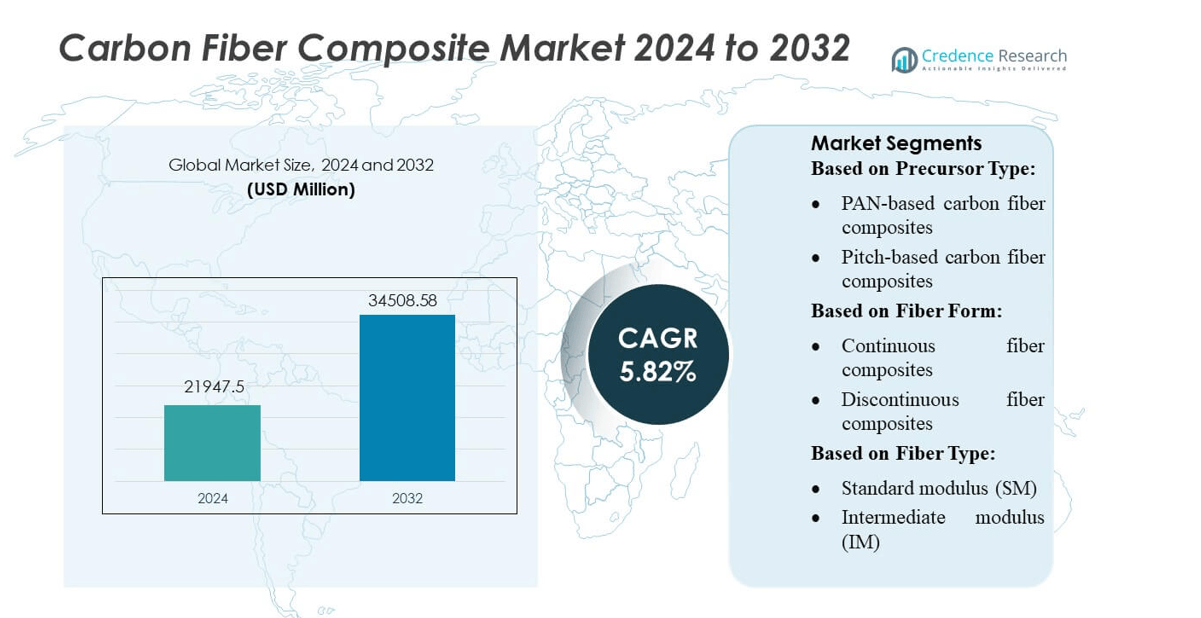
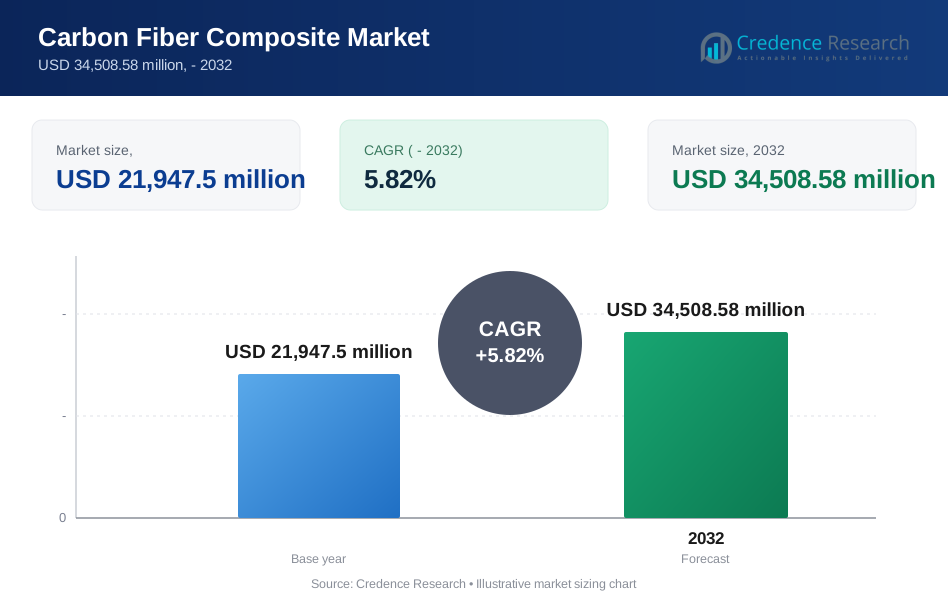
Carbon Fiber Composite Market size was valued USD 21947.5 million in 2024 and is anticipated to reach USD 34508.58 million by 2032, at a CAGR of 5.82% during the forecast period.
| REPORT ATTRIBUTE | DETAILS |
|---|---|
| Historical Period | 2020-2023 |
| Base Year | 2024 |
| Forecast Period | 2025-2032 |
| Carbon Fiber Composite Market Size 2024 | USD 21947.5 million |
| Carbon Fiber Composite Market, CAGR | 5.82% |
| Carbon Fiber Composite Market Size 2032 | USD 34508.58 million |
The carbon fiber composite market is dominated by a concentrated group of global manufacturers that compete through material innovation, production capacity, and partnerships with aerospace, automotive, and renewable energy OEMs. Leading companies continuously advance high-strength fibers, resin systems, and automated processing technologies to meet the growing demand for lightweight, high-performance components. Asia-Pacific remains the leading region, holding approximately 34% of the global market share, driven by strong industrialization, expanding aerospace programs, and large-scale EV and wind turbine manufacturing. The region’s rapid capacity expansion and government-backed R&D initiatives further reinforce its leadership in carbon fiber composite production and consumption.
Market Insights
- The Carbon Fiber Composite Market reached USD 21,947.5 million in 2024 and is projected to hit USD 34,508.58 million by 2032, growing at a CAGR of 5.82%, driven by rising demand for lightweight, high-strength materials across major industries.
- Increasing adoption in aerospace, automotive, and wind energy applications acts as a strong market driver, supported by the shift toward fuel efficiency, electrification, and larger turbine blade production.
- Continuous advancements in automated fiber placement, rapid-cure resins, and high-performance fiber grades shape market trends, enabling faster production and enhanced structural performance.
- Competitive intensity remains high as global manufacturers expand capacity, strengthen OEM partnerships, and invest in sustainable composite technologies, although high material costs and limited large-scale recycling infrastructure restrain wider adoption.
- Asia-Pacific leads the market with 34% regional share, while aerospace remains the dominant application segment, supported by expanding manufacturing programs and strong government-backed R&D investments across major economies.
Market Segmentation Analysis:
By Precursor Type
PAN-based carbon fiber composites dominate the market with an estimated 85–90% share due to their superior tensile strength, consistent quality, and suitability for aerospace, automotive, and industrial applications. Their strong performance-to-weight ratio and well-established production infrastructure drive widespread adoption among OEMs. Pitch-based carbon fiber composites hold a smaller share, mainly serving niche segments requiring extremely high modulus and thermal conductivity, such as satellite structures and high-temperature insulation. Demand for PAN-based composites continues to rise as manufacturers scale capacity and optimize precursor conversion efficiency.
- For instance, Hexcel Corporation produces its HexTow® IM7 PAN-based fiber in 12 000-filament tow with a tensile strength of around 5 688 MPa and a chord modulus of 276 GPa, highlighting why OEMs choose PAN over other types.
By Fiber Form
Continuous fiber composites lead the segment with a market share exceeding 70%, supported by their structural integrity, high load-bearing capacity, and suitability for aerospace, automotive body panels, wind turbine blades, and pressure vessels. Their ability to deliver uniform mechanical properties across large components keeps them the preferred choice for high-performance applications. Discontinuous fiber composites capture the remaining share, primarily driven by cost-effective manufacturing, design flexibility, and use in consumer electronics, sporting goods, and automotive interiors. Growth in automated molding and compounding technologies further supports their adoption.
- For instance, Hyosung Advanced Materials recently developed its ultra-high-tensile carbon fiber H3065 (T-1000 grade), which delivers a tensile strength of 6.4 GPa and a Young’s modulus exceeding 295 GPa, showcasing its capability in high-load, continuous applications.
By Fiber Type
Standard modulus (SM) carbon fibers represent the dominant sub-segment with over 55% market share, driven by their balanced strength, affordability, and extensive use in automotive, wind energy, marine, and industrial applications. Intermediate modulus (IM) fibers continue to expand in aerospace and defense due to improved stiffness-to-weight characteristics. High modulus (HM) and ultra-high modulus (UHM) fibers serve specialized applications requiring extreme stiffness, including space structures, precision robotics, and high-end sporting equipment. Growing investment in next-generation aircraft and space systems fuels incremental demand across IM and HM categories.
Key Growth Drivers
Rising Adoption in Aerospace and Defense
The aerospace and defense sector drives substantial growth in the carbon fiber composite market as manufacturers prioritize lightweight, high-strength materials to enhance fuel efficiency and performance. Carbon fiber composites enable a 20–30% reduction in aircraft structural weight, improving payload capacity and lowering emissions. Increasing production of next-generation aircraft, UAVs, and space systems intensifies demand for advanced composite structures. OEMs also integrate carbon fiber components into engines, fuselages, and interiors, strengthening market penetration across military and commercial aviation platforms.
- For instance, Nippon Graphite Fiber Co. Ltd supplies its “GRANOC™” pitch-based carbon fibers featuring ultra-high modulus grades of up to 95 tf/mm² (~9,300 MPa) and thermal conductivities reaching 1,200 W/m·K, making them ideal for satellite back-structures and precision aerospace components.
Expanding Use in Automotive Lightweighting
The shift toward vehicle lightweighting to meet stringent emission and fuel-efficiency standards accelerates carbon fiber composite adoption in the automotive sector. Automakers increasingly incorporate carbon fiber in chassis, body panels, and powertrain components to reduce vehicle weight by up to 50% compared with steel. The rise of electric vehicles further boosts demand, as OEMs use carbon fiber to extend driving range by lowering battery load. Growing production of premium and performance vehicles also stimulates the integration of high-strength composite materials.
- For instance, Jiangsu Hengshen Co. Ltd offers its HF10J-24K PAN-based carbon fiber with a tensile strength of 4,100 MPa and a modulus of 240 GPa, specifically engineered for pultruded structural applications.
Growing Applications in Renewable Energy
The renewable energy sector, particularly wind power, significantly contributes to market growth as carbon fiber composites support the development of longer, more durable turbine blades. These materials offer excellent fatigue resistance and high stiffness-to-weight ratios, enabling turbine blade lengths to exceed 80 meters while maintaining structural stability. As global wind capacity expands and offshore installations increase, demand for carbon fiber-reinforced polymers rises. Their role in boosting turbine efficiency and lifespan strengthens their presence in sustainable energy infrastructure.
Key Trends & Opportunities
Advancements in Low-Cost Manufacturing Technologies
Emerging production technologies such as automated fiber placement, resin transfer molding, and rapid-cure thermoset systems create opportunities to reduce composite manufacturing costs. These innovations shorten cycle times, improve material utilization, and enhance scalability for high-volume applications. Growing investment in industrial automation and digital manufacturing enables producers to achieve consistent quality and reduce labor requirements. As cost barriers decline, carbon fiber composites are positioned to penetrate mass-market automotive and industrial segments more effectively.
- For instance, AKSACA™ A-42 carbon fiber roving (24K, 1600 tex) exhibits a tensile strength of 4200 MPa and a modulus of 240 GPa, enabling lightweight yet robust parts.
Increasing Shift Toward Recyclable and Bio-Based Composites
Sustainability trends promote the development of recyclable and bio-derived carbon fiber composites. Companies are adopting thermoplastic matrices that allow remelting and reshaping, improving end-of-life recovery. Innovations in chemical recycling enable the extraction of high-quality fibers from composite waste, reducing environmental impact and production costs. Governments and industries prioritize circular material flows, creating opportunities for eco-efficient composite solutions in transportation, construction, and electronics. This shift supports compliance with global sustainability standards and enhances market competitiveness.
- For instance, Mitsubishi Chemical recycles carbon fiber scrap via pyrolysis, recovering fibers that are then refined into its carboNXT products; this process is reported to cut recycling costs relative to virgin fiber by 20–40%.
Growing Integration in Infrastructure and Construction
The construction sector presents new opportunities as carbon fiber composites gain traction in strengthening bridges, buildings, and industrial structures. Their high corrosion resistance and long service life make them ideal for reinforcing concrete, retrofitting aging infrastructure, and supporting seismic resilience projects. Composite rebar, laminates, and panels increasingly replace steel in harsh environments, reducing maintenance costs and improving structural performance. Expanding infrastructure modernization programs in developed and emerging economies accelerate this adoption trend.
Key Challenges
High Material and Processing Costs
Carbon fiber composites face adoption barriers due to high production and processing costs associated with precursor materials and energy-intensive manufacturing methods. These expenses limit penetration in cost-sensitive sectors such as mass-market automotive and consumer goods. OEMs require significant capital investment for specialized equipment and skilled labor, which further increases operational costs. Despite ongoing research to reduce material prices, cost competitiveness with metals and alternative composites remains a persistent challenge for widespread market expansion.
Limited Recycling Infrastructure and Technical Complexity
While recycling technologies for carbon fiber composites are improving, the market still struggles with insufficient large-scale recycling infrastructure and technical processing challenges. Mechanical and chemical recycling methods often compromise fiber quality or involve high operational costs, deterring commercial adoption. Disposal of composite waste from aerospace, automotive, and wind energy sectors remains a concern due to environmental regulations. The absence of standardized recycling protocols restricts circular economy initiatives and creates compliance challenges for manufacturers.
Regional Analysis
North America
North America holds an estimated 32% share of the carbon fiber composite market, driven by strong adoption across aerospace, defense, automotive, and renewable energy sectors. The U.S. leads demand due to the presence of major aircraft OEMs and technical composite manufacturers that prioritize high-strength materials for next-generation platforms. Growth also stems from electric vehicle expansion and increased use of lightweight composites in sports equipment and industrial applications. Government-funded R&D and advanced manufacturing capabilities further strengthen regional competitiveness and accelerate commercialization of high-performance composite technologies across high-value industries.
Europe
Europe accounts for roughly 28% of the global market, supported by leading aerospace, automotive, and wind-energy production hubs. Germany, France, and the U.K. spearhead composite innovation through strong engineering networks and advanced material research institutes. The region’s ambitious decarbonization and lightweighting objectives stimulate adoption of carbon fiber in electric mobility, aviation modernization, and offshore wind installations. Strong regulatory focus on energy efficiency and sustainable materials further drives composite penetration. Europe’s extensive wind turbine manufacturing capacity significantly contributes to its market share, reinforcing the region as a core consumer of structural composite materials.
Asia-Pacific
Asia-Pacific dominates the global market with an estimated 34% share, driven by rapid industrialization, expanding aerospace programs, and large-scale automotive production. China, Japan, and South Korea lead regional demand as manufacturers scale composite usage for electric vehicles, industrial machinery, and high-speed rail systems. The region also experiences strong growth in renewable energy, with China’s wind turbine production heavily dependent on carbon fiber composites. Increasing domestic manufacturing capacity, supportive government initiatives, and rising export-oriented composite production enhance regional competitiveness, positioning Asia-Pacific as the fastest-growing and most influential contributor to global carbon fiber consumption.
Latin America
Latin America holds a modest 4% market share, but demand continues to rise as industries incorporate lightweight composites in automotive, sports equipment, and wind energy projects. Brazil and Mexico lead adoption due to expanding manufacturing bases and growing participation in global automotive supply chains. Increasing investments in renewable energy—particularly wind power—stimulate the use of carbon fiber turbine blades, while aerospace component manufacturing in Brazil supports additional consumption. Although regional capabilities are developing, limited industrial infrastructure and higher import dependency constrain market expansion compared with more mature global regions.
Middle East & Africa
The Middle East & Africa region accounts for approximately 2% of the global market, with growth primarily fueled by investments in aerospace, defense, and high-performance construction materials. The UAE and Saudi Arabia lead adoption as they diversify industrial capacity and integrate advanced composite materials into infrastructure megaprojects. Demand also increases through renewable energy initiatives, including wind and solar installations. However, limited local manufacturing, high cost of specialized raw materials, and dependency on imports restrict broader market penetration. Despite these challenges, expanding industrialization and technology partnerships gradually enhance regional carbon fiber composite consumption.
Market Segmentations:
By Precursor Type:
- PAN-based carbon fiber composites
- Pitch-based carbon fiber composites
By Fiber Form:
- Continuous fiber composites
- Discontinuous fiber composites
By Fiber Type:
- Standard modulus (SM)
- Intermediate modulus (IM)
By Geography
- North America
- U.S.
- Canada
- Mexico
- Europe
- Germany
- France
- U.K.
- Italy
- Spain
- Rest of Europe
- Asia Pacific
- China
- Japan
- India
- South Korea
- South-east Asia
- Rest of Asia Pacific
- Latin America
- Brazil
- Argentina
- Rest of Latin America
- Middle East & Africa
- GCC Countries
- South Africa
- Rest of the Middle East and Africa
Competitive Landscape
The carbon fiber composite market features a competitive landscape led by major players such as Hexcel Corporation, Hyosung Advanced Materials, Anshan Sinocarb Carbon Fiber Co. Ltd, Nippon Graphite Fiber Co. Ltd, Formosa Plastics Corporation, Jiangsu Hengshen Co. Ltd, DowAksa USA LLC, Mitsubishi Chemical Corporation, A&P Technology Inc., and Holding Company Composite. The carbon fiber composite market is defined by continuous innovation, expanding production capacities, and increasing integration of advanced materials across high-performance industries. Companies focus on improving fiber strength, enhancing resin compatibility, and optimizing automated manufacturing processes that reduce cycle time and production costs. Strategic collaboration with aerospace, automotive, wind energy, and industrial OEMs remains central to securing long-term contracts and ensuring material qualification. Producers are also investing in sustainable technologies, including recyclable thermoplastic composites and low-emission precursor materials, to align with global environmental standards. Rising demand for lightweight structures and performance-critical components continues to intensify competition and drive technological advancement across the value chain.
Key Player Analysis
- Hexcel Corporation
- Hyosung Advanced Materials
- Anshan Sinocarb Carbon Fiber Co. Ltd
- Nippon Graphite Fiber Co. Ltd
- Formosa Plastics Corporation
- Jiangsu Hengshen Co. Ltd
- DowAksa USA LLC
- Mitsubishi Chemical Corporation
- A&P Technology Inc.
- Holding Company Composite
Recent Developments
- In June 2025, Toray Carbon Fibers Europe received a Silver 'AVIO Industrial Partners 2025' award from AVIO during its Supply Chain Partner Days. The award was given to recognize Toray's high-quality and timely supply of carbon fiber composites and their innovative collaboration within the space and defense sector.
- In May 2024, CUPRA integrated Bcomp's flax-based natural fiber composites into the CUP Bucket seats of the Born VZ electric vehicle, reducing CO2 emissions by 49% compared to the previous hybrid seats. This collaboration, which also involved Sabelt, replaced traditional materials with natural fiber solutions, making the seats lighter, reducing the car's energy demand, and improving vibration damping and safety.
- In April 2024, UBE Corporation launched new composite products made with recycled carbon fiber reinforced nylon under its "U-BE-INFINITY" brand. These second-generation lightweight functional composites are produced with low greenhouse gas (GHG) emissions and have a lesser environmental impact, specifically advocated for use in the automotive and sports segments as part of global carbon neutrality efforts.
- In March 2024, Hexcel launched HexTow IM9 24K carbon fiber, a material for aerospace composites with superior tensile strength, high modulus, and increased fiber line productivity due to its 24,000-filament tow size
Report Coverage
The research report offers an in-depth analysis based on Precursor Type, Fiber Form, Fiber Type and Geography. It details leading market players, providing an overview of their business, product offerings, investments, revenue streams, and key applications. Additionally, the report includes insights into the competitive environment, SWOT analysis, current market trends, as well as the primary drivers and constraints. Furthermore, it discusses various factors that have driven market expansion in recent years. The report also explores market dynamics, regulatory scenarios, and technological advancements that are shaping the industry. It assesses the impact of external factors and global economic changes on market growth. Lastly, it provides strategic recommendations for new entrants and established companies to navigate the complexities of the market.
Future Outlook
- The market will expand as aerospace platforms increasingly integrate lightweight composite structures.
- Automotive manufacturers will adopt more carbon fiber components to enhance energy efficiency and support EV growth.
- Wind energy installations will accelerate demand for longer and stronger turbine blades made from advanced composites.
- Manufacturers will scale automated production technologies to reduce cycle times and increase output.
- Adoption of recyclable and bio-based composite materials will rise as sustainability requirements tighten.
- Defense programs will incorporate carbon fiber in next-generation aircraft, missiles, and armored systems.
- Infrastructure modernization will boost the use of composites in bridge reinforcement and seismic retrofitting.
- Emerging economies will expand production capacity to reduce dependency on imported high-performance fibers.
- Partnerships between material suppliers and OEMs will strengthen to support long-term application development.
- Continuous R&D will focus on improving mechanical performance while lowering overall production costs.
Request a Free Sample
Fill in your details and we'll send you a free sample report.
- Sample data tables & charts
- Research methodology
Need a Custom Version of This Report?
Tailor the scope, geography, or segments to your exact requirements.
- Custom geography or segment scope
- Direct access to our analyst team
Frequently Asked Questions
What is the current market size for the Carbon Fiber Composite Market, and what is its projected size in 2032?
At what Compound Annual Growth Rate is the Carbon Fiber Composite Market projected to grow between 2025 and 2032?
Which Carbon Fiber Composite Market segment held the largest share in 2024?
Which segment is expected to post the highest CAGR during the forecast period?
Who are the major players in the global carbon fiber composite market?
What is the major market driver of the carbon fiber composite industry?
What are the major market restraints of the carbon fiber composite industry?
What are the major market opportunities of the Carbon Fiber Composite industry?
Who are the leading companies in the Carbon Fiber Composite Market?
Table of Content
Chapter 1. Report Introduction
- 1.1 Report Description & Purpose
- 1.1.1 Report Title & Market Definition
- 1.1.2 Unique Selling Propositions (USP) & Key Differentiators
- 1.1.3 Value Proposition for Stakeholders
- 1.2 Research Objectives
- 1.2.1 Market Sizing Objectives (Volume & Revenue)
- 1.2.2 Segmentation Objectives
- 1.2.3 Competitive Intelligence Objectives
- 1.2.4 Forecast & Scenario Objectives
- 1.3 Report Scope
- 1.3.1 Carbon Fiber Composite Scope – Types & Subtypes Covered
- 1.3.2 Geographic Scope – Regions & Countries Covered
- 1.3.3 Historical Period, Base Year & Forecast Period (the historical period; forecast to 2032)
- 1.3.4 Inclusions & Exclusions
- 1.4 HS Code & Classification Framework
- 1.5 Currency, Units & Pricing Basis
- 1.6 Target Stakeholders
- 1.7 Limitations & Assumptions
Chapter 2. Executive Summary
- 2.1 Global Carbon Fiber Composite Market Snapshot
- 2.1.1 Market Size – Historical (the historical period) & Forecast (2032) (base year: USD 21,947.5 million → 2032: USD 34,508.58 million)
- 2.1.2 Volume & Revenue – Global Totals
- 2.1.3 Key Market Highlights – Top Five Facts
- 2.2 Carbon Fiber Composite Market Segmentation Snapshot
- 2.2.1 Market Split by Region – vs. 2032
- 2.3 Competitive Snapshot
- 2.3.1 Top 10 Players by Revenue Share –
- 2.3.2 Top 10 Players by Volume Share –
- 2.3.3 Recent Strategic Developments (18-Month Summary)
- 2.4 Key Investment Highlights & Strategic Conclusions
Chapter 3. Carbon Fiber Composite Market Dynamics & Industry Analysis
- 3.1 Market Overview & Context
- 3.1.1 Carbon Fiber Composite Market Position in the Broader Automotive Value Chain
- 3.1.2 OEM vs. Replacement Market Dynamics
- 3.1.3 Market Maturity & Development Stage by Region
- 3.2 Carbon Fiber Composite Market Drivers
- 3.3 Carbon Fiber Composite Market Restraints & Challenges
- 3.4 Carbon Fiber Composite Market Opportunities
- 3.5 Porter's Five Forces Analysis
- 3.5.1 Threat of New Entrants
- 3.5.2 Bargaining Power of Suppliers
- 3.5.3 Bargaining Power of Buyers
- 3.5.4 Threat of Substitutes
- 3.5.5 Competitive Rivalry – Intensity Assessment
- 3.6 Carbon Fiber Composite Value Chain Analysis
- 3.6.1 Upstream – Raw Material/Input Suppliers
- 3.6.1.1 Raw Material/Input 1
- 3.6.1.2 Raw Material/Input 2
- 3.6.1.3 Raw Material/Input 3
- 3.6.2 Midstream – Production/Manufacturing/Service Delivery
- 3.6.2.1 Production/Process Overview
- 3.6.2.2 Key Facility Locations & Capacity by Manufacturer
- 3.6.3 Downstream – Distribution & End Consumer
- 3.6.3.1 Primary Channel – B2B/OEM
- 3.6.3.2 Secondary Channels – Dealer, Retail, Online, Direct
- 3.6.4 Value Chain Profitability Analysis
- 3.6.1 Upstream – Raw Material/Input Suppliers
- 3.7 PESTEL Analysis
- 3.7.1 Political Factors
- 3.7.2 Economic Factors
- 3.7.3 Social Factors
- 3.7.4 Technological Factors
- 3.7.5 Environmental Factors
- 3.7.6 Legal Factors
- 3.8 Carbon Fiber Composite Supply Chain Analysis
- 3.8.1 Raw Material/Input Supply Risk Assessment
- 3.8.2 Manufacturing Concentration Risk (Geographic Exposure)
- 3.8.3 Trade Disruption Impact Analysis
- 3.9 Regulatory & Policy Landscape
Note: The regulatory and policy landscape section covers regulations based on their applicability to the market, Carbon Fiber Composite category, geography, and scope of the study. Only regulatory frameworks with a material impact on operations, compliance, trade, sustainability, or market access are analyzed in detail.
Chapter 4. Key Investment Pockets & Opportunity Analysis
- 4.1 Carbon Fiber Composite Market Attractiveness Analysis
- 4.1.1 By Region – Investment Attractiveness Matrix (Volume × CAGR)
- 4.2 Absolute Revenue Growth Opportunity
- 4.2.1 By Region – Absolute USD Growth Through 2032
- 4.3 Incremental Volume Opportunity
- 4.3.1 By Region – Incremental Volume Through 2032
- 4.3.2 Segment – Incremental Volume
- 4.4 Emerging Submarket Opportunity Deep Dive (Subject to Applicability)
- 4.5 Emerging Market Opportunity Scorecards
- 4.5.1 United States
- 4.5.2 Europe
- 4.5.3 Asia
- 4.5.4 Middle East & Africa
Note: Emerging Market Opportunity Scorecards will be included based on relevance and strategic importance. Regions listed are indicative and may vary depending on data availability and market dynamics.
Chapter 5. Carbon Fiber Composite Import-Export Analysis & Trade Flows
- 5.1 Global Trade Overview
- 5.1.1 Global Export Value by Country (the historical period)
- 5.1.2 Global Export Volume by Country (the historical period)
- 5.1.3 Global Import Value by Country (the historical period)
- 5.1.4 Global Import Volume by Country (the historical period)
- 5.1.5 Net Trade Balance by Country (the historical period)
- 5.2 Export Analysis – Segment
- 5.2.1 Type 1 (HS Code)
- 5.2.2 Type 2 (HS Code)
- 5.2.3 Type 3 (HS Code)
- 5.2.4 Type 4 (HS Code)
- 5.2.5 Type 5 (HS Code)
- 5.3 Import Analysis – Segment
- 5.3.1 Type 1 (HS Code)
- 5.3.2 Type 2 (HS Code)
- 5.3.3 Type 3 (HS Code)
- 5.3.4 Type 4 (HS Code)
- 5.3.5 Type 5 (HS Code)
- 5.4 Average Unit Trade Prices
- 5.4.1 Average Export Price – Segment & Country
- 5.4.2 Average Import Price – Segment & Source Country
- 5.4.3 Price Trends (the historical period)
- 5.5 Key Trade Route Analysis
- 5.5.1 Trade Route 1
- 5.5.2 Trade Route 2
- 5.5.3 Trade Route 3
- 5.5.4 Trade Route 4
- 5.5.5 Trade Route 5
- 5.6 Trade Policy Impact Assessment
- 5.6.1 US Anti-Dumping & Section 301 Tariffs
- 5.6.2 EU Customs Union Impact
- 5.6.3 Major Free Trade Agreements
- 5.6.4 USMCA Rules of Origin
Note: Trade policy analysis will be included only where relevant to the Carbon Fiber Composite market.
Chapter 6. Competitive Landscape & Company Benchmarking
- 6.1 Carbon Fiber Composite Market Concentration & Structure
- 6.1.1 Herfindahl-Hirschman Index (HHI) – vs.
- 6.1.2 Tier 1, Tier 2 & Tier 3 Market Structure
- 6.1.3 Global, Regional & Local Player Dynamics
- 6.2 Carbon Fiber Composite Market Share Analysis –
- 6.2.1 Global Revenue Share by Company
- 6.2.2 Global Volume Share by Company
- 6.2.3 Regional Revenue Share
- 6.2.4 Market Share Evolution ( vs. )
- 6.2.5 OEM Segment Share by Company
- 6.2.6 Replacement Segment Share by Company
- 6.3 Production/Delivery Capacity & Facility Analysis
- 6.3.1 Global Installed Capacity
- 6.3.2 Capacity Utilization Rates
- 6.3.3 Production/Output Volume
- 6.3.4 Facility Locations & Capacity Map
- 6.3.5 Planned Capacity Additions
- 6.4 Carbon Fiber Composite Competitive Benchmarking Matrix
- 6.4.1 Revenue, Volume, CAGR & Profitability Comparison
- 6.4.2 Channel Revenue Mix
- 6.4.3 Geographic Revenue Exposure
- 6.4.4 R&D Intensity
- 6.4.5 Sustainability Maturity
- 6.5 Strategic Developments in Carbon Fiber Composite (Last 24 Months)
- 6.5.1 Mergers, Acquisitions & Divestments
- 6.5.2 New Carbon Fiber Composite Launches
- 6.5.3 Facility Expansions
- 6.5.4 Strategic Alliances, Joint Ventures & Partnerships
- 6.5.5 Distribution Expansion & Market Entry
- 6.5.6 Sustainability & ESG Initiatives
- 6.6 Competitive Strategy Mapping
- 6.6.1 Leader, Challenger, Follower & Niche Classification
- 6.6.2 Pricing Strategy Comparison
- 6.6.3 Channel Strategy Matrix
Note: Strategic developments are included based on their materiality and the availability of reliable information.
Chapter 7. Global Carbon Fiber Composite Market – By Distribution Channel
- 7.1 Segment Overview
- 7.1.1 Volume & Revenue Split by Channel ( & 2032)
- 7.1.2 Channel Mix Evolution (2032)
Chapter 8. Regional Market Analysis – Global Overview
- 8.1 Global Regional Overview
- 8.1.1 Regional Volume Share
- 8.1.2 Regional Revenue Share
- 8.1.3 Regional Volume by Region
- 8.1.4 Regional Revenue by Region
- 8.1.5 Regional Forecast Through 2032
- 8.2 Cross-Regional Segment Analysis
- 8.2.1 By Distribution Channel
- 8.2.2 By Brand/Price Tier
Chapter 9. North America Carbon Fiber Composite Market
- 9.1 United States
- 9.2 Canada
- 9.3 Mexico
Chapter 10. Europe Carbon Fiber Composite Market
- 10.1 Germany
- 10.2 France
- 10.3 Italy
- 10.4 United Kingdom
- 10.5 Spain
- 10.6 Poland
- 10.7 Russia
- 10.8 Netherlands
- 10.9 Belgium
- 10.10 Sweden
- 10.11 Denmark
- 10.12 Norway
- 10.13 Rest of Europe
Chapter 11. Asia Pacific Carbon Fiber Composite Market
- 11.1 China
- 11.2 India
- 11.3 Japan
- 11.4 South Korea
- 11.5 Thailand
- 11.6 Indonesia
- 11.7 Vietnam
- 11.8 Malaysia
- 11.9 Australia
- 11.10 Rest of Asia Pacific
Chapter 12. Latin America Carbon Fiber Composite Market
- 12.1 Brazil
- 12.2 Argentina
- 12.3 Colombia
- 12.4 Chile
- 12.5 Rest of Latin America
Chapter 13. Middle East Carbon Fiber Composite Market
- 13.1 Saudi Arabia
- 13.2 United Arab Emirates
- 13.3 Turkey
- 13.4 Israel
- 13.5 Iran
- 13.6 Rest of the Middle East
Chapter 14. Africa Carbon Fiber Composite Market
- 14.1 South Africa
- 14.2 Egypt
- 14.3 Nigeria
- 14.4 Morocco
- 14.5 Rest of Africa
Chapter 15. Carbon Fiber Composite Company Profiles
- 15.1 [Company 01]
- 15.1.1 Company Overview
- 15.1.2 Key Management Personnel
- 15.1.3 Products & Services Portfolio
- 15.1.4 Financial Performance
- 15.1.5 Key Market Focus & Geographic Presence
- 15.1.6 Recent Developments & Strategic Initiatives
Note: The company profile list is preliminary and may change based on research findings, market developments, data availability, and client requirements.
Chapter 16. Appendices
- Appendix A – List of Abbreviations & Acronyms
- Appendix B – Industry Classification Code Reference – Full Series
- Appendix C – Production & Capacity Data Tables
- Appendix D – End-Use & Demand Base Tables
- Appendix E – Consumption & Replacement Rate Assumptions
- Appendix F – ASP Reference Tables
- Appendix G – Manufacturing & Facility Database
- Appendix H – Import-Export Data Tables
- Appendix I – Regulatory Summary Tables
- Appendix J – Primary Research Participant List (Anonymized)
- Appendix K – Primary Research Questionnaire Framework
- Appendix L – Data Sources & Bibliography
- Appendix M – Market Size Divergence & Source Comparison
Chapter 17. Research Methodology
- 17.1 Research Framework & Philosophy
- 17.2 Secondary Research – Sources, Hierarchy & Data Extraction
- 17.3 Data Modeling – Bottom-Up & Top-Down Market Sizing
- 17.4 Primary Research – Stakeholder Framework, LOI & Sample Sizes
- 17.5 Forecast Methodology – Regression, Scenario & Sensitivity Analysis
- 17.6 Quality Control – Four-Layer Validation Framework
- 17.7 Limitations & Standard Assumptions
- 17.8 Disclaimer
