Market Overview:
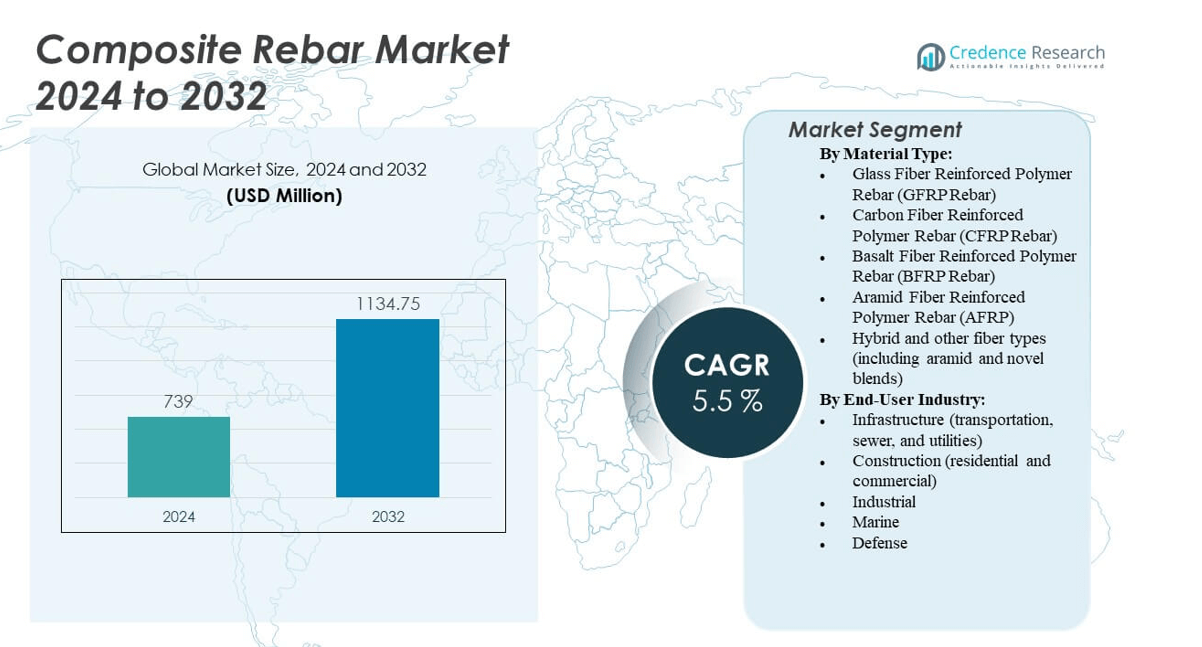
The Composite Rebar Market is projected to grow from USD 739 million in 2024 to an estimated USD 1,134.75 million by 2032, with a compound annual growth rate (CAGR) of 5.5% from 2024 to 2032.
| REPORT ATTRIBUTE |
DETAILS |
| Historical Period |
2020-2023 |
| Base Year |
2024 |
| Forecast Period |
2025-2032 |
| Composite Rebar Market Size 2024 |
USD 739 million |
| Composite Rebar Market, CAGR |
5.5% |
| Composite Rebar Market Size 2032 |
USD 1,134.75 million |
The growth of the Composite Rebar Market is driven by increasing demand for sustainable construction materials. Composite rebar offers superior corrosion resistance and longevity compared to traditional steel, making it an attractive choice for infrastructure projects. It is particularly in demand for use in harsh environments such as coastal regions and industrial areas, where materials are prone to corrosion. Furthermore, regulatory shifts towards greener construction practices are pushing the adoption of composite rebar in large-scale projects.
Regionally, North America leads the Composite Rebar Market due to a strong focus on infrastructure renewal and strict environmental regulations. Europe follows with steady growth, driven by demand for durable, low-maintenance materials in marine and transportation infrastructure. The Asia-Pacific region is emerging as a significant market, particularly in countries like China and India, where rapid urbanization and infrastructure expansion drive the need for corrosion-resistant materials. These regions present significant opportunities for composite rebar as governments invest in long-lasting, eco-friendly construction solutions.
Market Insights:
- The Composite Rebar Market is projected to grow from USD 739 million in 2024 to an estimated USD 1,134.75 million by 2032, with a CAGR of 5.5% from 2024 to 2032.
- Increasing demand for sustainable construction materials is a key driver of market growth, particularly for projects requiring long-lasting, corrosion-resistant solutions.
- Strict regulations on environmental sustainability and the adoption of green building standards are pushing the use of composite rebar in major infrastructure projects.
- Composite rebar offers superior durability and corrosion resistance, making it ideal for use in harsh environments like coastal regions and industrial settings.
- The higher initial cost of composite rebar compared to traditional materials remains a restraint for widespread adoption, especially in cost-sensitive markets.
- North America leads the market due to infrastructure renewal projects and environmental regulations, with significant growth in Europe driven by marine and transport infrastructure.
- Asia-Pacific is emerging as a key market, with China and India driving demand due to rapid urbanization and infrastructure expansion.
Access crucial information at unmatched prices!
Request your sample report today & start making informed decisions powered by Credence Research Inc.!
Download Sample
Market Drivers:
Demand for Sustainable Construction Solutions
The Composite Rebar Market benefits from the increasing emphasis on sustainability in construction. It provides a solution to corrosion issues that affect traditional steel reinforcement. The demand for long‑lasting infrastructure is growing, especially in regions with harsh environmental conditions like coastal and industrial zones. Its superior corrosion resistance reduces maintenance costs, contributing to the overall efficiency of construction projects. This makes it a preferred choice for high‑performance structures such as bridges, tunnels, and marine applications. The environmental benefits also appeal to green building certifications, fueling further market demand.
- For instance, a U.S. Army Corps of Engineers demonstration project in McKinleyville, West Virginia replaced an entire bridge deck using fiber-reinforced plastic (FRP) composite rebar. The project verified that FRP rebar offers non-corrosive performance in aggressive environments and extended expected service life compared to steel reinforcement.
Expansion of Infrastructure Projects
Infrastructure development projects worldwide fuel the adoption of composite rebar. Governments are investing heavily in infrastructure renewal, especially in urban areas. The composite material is ideal for projects that require long‑lasting durability, such as roads and bridges. Its use helps extend the life of infrastructure while minimizing the need for frequent repairs. The ongoing trend toward urbanization also increases the demand for efficient construction materials. As cities grow, the need for stronger and more resilient building materials continues to rise.
Technological Advancements in Composite Rebar Manufacturing
Technological advancements in the production of composite rebar have made it more cost‑effective. Innovations in materials science have led to better manufacturing processes, improving product quality. These advancements have reduced the overall cost of composite rebar, making it more accessible to a broader range of construction projects. Enhanced manufacturing techniques also ensure the material meets higher performance standards, such as increased strength and reduced weight. These improvements are attracting greater attention from construction companies seeking durable and cost‑efficient reinforcement materials.
- For instance, Composite-Tech utilizes a patented polymerization process, where FRP rebar is cured from the inside outward in their production facilities, resulting in uniformly high mechanical strength and enhanced durability. Their self-contained manufacturing systems allow customization of surface ribbing and gradual cooling to prevent thermal damage, as detailed in industry and technical documentation on advanced composite rebar processes.
Growing Focus on Durability in Construction
The Composite Rebar Market is also driven by the growing demand for durable construction materials. Builders increasingly recognize the need for materials that can withstand extreme weather conditions, particularly in regions subject to heavy rainfall or coastal environments. The inherent strength and durability of composite rebar make it ideal for these applications. Its resistance to rust and degradation ensures longer‑lasting structures with reduced maintenance requirements. This long lifespan directly contributes to cost savings over time, making it an appealing option for large‑scale construction projects.
Market Trends:
Adoption of Composite Rebar in Sustainable Infrastructure
The Composite Rebar Market is seeing an uptick in the adoption of sustainable infrastructure solutions. Governments and private sectors alike are integrating environmental sustainability into their construction practices. With stricter environmental regulations, there is an increasing shift toward materials like composite rebar that reduce environmental impact. The demand for low‑maintenance, long‑life construction materials is driving this trend. As projects focus on energy efficiency and reducing carbon footprints, composite rebar becomes an essential material for achieving sustainability goals in large‑scale projects.
- For instance, Owens Corning, in collaboration with leading U.S. universities, conducted durability studies on glass fiber reinforced polymer (GFRP) rebar extracted from 11 bridges in service for 15–20 years. The tensile strength of the GFRP bars showed a negligible reduction (2.13%) over 17 years, while visual and microscopic inspection confirmed no significant deterioration or corrosion, validating long-term sustainability and durability.
Integration of Smart Construction Technologies
Smart construction technologies are gradually making their way into the Composite Rebar Market. With the rise of Industry 4.0, construction projects are incorporating advanced sensors and digital monitoring systems. These technologies help track the performance of composite rebar within the structure, offering real‑time insights into structural integrity. This trend supports predictive maintenance strategies, enabling earlier detection of potential issues. The integration of these technologies further enhances the performance and longevity of structures that utilize composite rebar.
Preference for Lightweight and High‑Strength Materials
In the Composite Rebar Market, there is a growing preference for lightweight yet high‑strength materials. Composite rebar offers this advantage over traditional steel, making it easier to handle and install, especially in projects requiring tight schedules. Its reduced weight contributes to overall structural efficiency and reduces the load on supporting frameworks. This trend is particularly relevant in the construction of high‑rise buildings, bridges, and other large structures where weight and strength are critical factors in design and safety.
Shift Toward More Cost‑Effective Solutions
A trend in the Composite Rebar Market is the growing shift towards more cost‑effective construction solutions. With increased competition in the construction industry, companies are looking for materials that offer high performance at a lower overall cost. Composite rebar, though traditionally more expensive, is becoming more affordable due to advances in manufacturing. As a result, construction companies are opting for composite rebar to reduce long‑term operational costs. These factors are making it a more attractive alternative to conventional reinforcement materials.
- For instance, Armastek’s GFRP rebar is seven times lighter than steel, which directly led to cost reductions in transportation and faster installation in U.S. and global construction projects. Manufacturer documentation and project case studies confirm its corrosion resistance and high tensile strength in comparison to steel, resulting in lower lifecycle costs for companies that adopted Armastek’s solution.
Market Challenges:
High Initial Cost and Limited Awareness
The primary challenge facing the Composite Rebar Market is its relatively high initial cost compared to traditional steel rebar. While composite rebar offers long‑term benefits in terms of durability and reduced maintenance, the upfront investment can be a barrier, especially in regions where cost control is critical. Many construction companies remain unaware of the advantages of composite rebar, focusing primarily on the immediate costs. This lack of knowledge inhibits its widespread adoption, especially in emerging markets where budget constraints are a priority.
Limited Availability and Production Capacity
The limited availability and production capacity of composite rebar present challenges to meeting growing market demand. As the Composite Rebar Market expands, there is a need for increased manufacturing capabilities to produce high volumes of rebar. However, scaling production to meet demand has been slow due to the specialized nature of the manufacturing process. This shortage impacts project timelines, particularly in regions experiencing rapid infrastructure development. The lack of widespread suppliers in certain markets also limits the accessibility of composite rebar for large‑scale construction projects.
Market Opportunities:
Growing Demand for Resilient Infrastructure in Emerging Markets
Emerging markets present significant opportunities for the Composite Rebar Market. As infrastructure development accelerates in countries like India, China, and Brazil, the demand for durable and cost‑efficient materials is increasing. Composite rebar offers significant advantages in these regions, where traditional steel reinforcement faces challenges such as corrosion and high maintenance costs. This demand for long‑lasting and corrosion‑resistant materials presents a growing market opportunity. The ongoing push for infrastructure upgrades and new construction projects in these regions positions composite rebar as a key material in future development.
Government Initiatives Supporting Sustainable Building Practices
Governments globally are implementing policies that promote the use of sustainable materials in construction. These initiatives create a favorable environment for the Composite Rebar Market, as the material aligns with green building standards and sustainability goals. Regulations mandating the use of eco‑friendly materials are pushing construction companies to adopt composite rebar in their projects. In regions where sustainable construction is a priority, composite rebar is emerging as the material of choice, offering an opportunity for manufacturers to expand their reach and cater to the growing demand for eco‑conscious building solutions.
Market Segmentation Analysis:
By Material Type:
he Composite Rebar Market sees diverse demand across various material types, with Glass Fiber Reinforced Polymer (GFRP) leading due to its corrosion resistance and lightweight nature, which makes it ideal for harsh environments. GFRP rebar is particularly popular in coastal and industrial zones, as it reduces the overall weight of structures while improving durability. Carbon Fiber Reinforced Polymer (CFRP) is also gaining traction, especially in high-performance applications where high strength and reduced weight are crucial, such as in bridges, high-rise buildings, and industrial infrastructure. It offers excellent resistance to corrosion and high temperatures, making it suitable for critical projects. Meanwhile, Basalt Fiber Reinforced Polymer (BFRP) is emerging as a cost-effective alternative, valued for its mechanical strength, seismic resistance, and environmental sustainability. Aramid Fiber Reinforced Polymer (AFRP) is used more sparingly, mainly in defense and aerospace applications, due to its superior tensile strength and lightweight characteristics. The market is also witnessing a rise in demand for hybrid and novel fiber types, combining the benefits of multiple materials to meet the specific needs of industrial, marine, and defense sectors, particularly in extreme conditions.
- For instance, Owens Corning’s ASLAN 100 GFRP rebar has been used in bridge decks, median barriers, seawalls, and facilities exposed to marine salts, with a documented tensile strength greater than 1,000 MPa and weighing approximately one-fourth that of steel rebar. Technical datasheets confirm its use in projects across the U.S. and its capability to mitigate chloride and chemical attack-related corrosion.
By End-User Industry:
In the Composite Rebar Market, the infrastructure sector represents a key demand driver, especially in transportation, sewer, and utilities, where composite rebar’s resistance to corrosion and high durability make it ideal for roads, bridges, and tunnels. This segment is growing rapidly due to the global focus on long-term infrastructure development. The construction industry, both residential and commercial, follows closely, driven by composite rebar’s ability to reduce structural weight without compromising strength. This is particularly important for high-rise buildings and sustainable construction practices. The industrial sector adopts composite rebar for its resistance to chemicals and extreme stress, which is crucial in factories and manufacturing facilities. The marine sector continues to experience growth, with composite rebar providing solutions to seawater corrosion in port structures, piers, and waterfront buildings. Lastly, the defense sector represents a specialized but growing niche, as composite rebar’s strength-to-weight ratio and environmental resistance make it suitable for military infrastructure, such as bunkers and bases, requiring materials that can withstand extreme conditions.
- For instance, in Thetford Mines, Quebec, Canada, a reinforced concrete water chlorination tank was constructed entirely with GFRP bars—foundation, vertical walls, and cover slab. The project demonstrated no corrosion-related issues during the first 10 months of service and withstood all structural and leakage tests, confirming that GFRP rebar installation was efficient, and tank performance met CAN/CSA S806-12 and ACI 440.1R-06 standards.
Segmentation:
By Material Type:
- Glass Fiber Reinforced Polymer Rebar (GFRP Rebar)
- Carbon Fiber Reinforced Polymer Rebar (CFRP Rebar)
- Basalt Fiber Reinforced Polymer Rebar (BFRP Rebar)
- Aramid Fiber Reinforced Polymer Rebar (AFRP)
- Hybrid and other fiber types (including aramid and novel blends)
By End-User Industry:
- Infrastructure (transportation, sewer, and utilities)
- Construction (residential and commercial)
- Industrial
- Marine
- Defense
By Region:
- North America
- Europe
- Germany
- France
- U.K.
- Italy
- Spain
- Rest of Europe
- Asia Pacific
- China
- Japan
- India
- South Korea
- South-east Asia
- Rest of Asia Pacific
- Latin America
- Brazil
- Argentina
- Rest of Latin America
- Middle East & Africa
- GCC Countries
- South Africa
- Rest of the Middle East and Africa
Regional Analysis:
The Asia-Pacific region commands a dominant position within the Composite Rebar Market, holding approximately 35% of global market share in 2024. Rapid urbanisation in countries such as China, India and Southeast Asia drives infrastructure expansion and adoption of corrosion‑resistant rebar solutions. It benefits from abundant construction projects in marine, bridge and coastal infrastructure where steel reinforcement shows vulnerability to rust and chemical attack. Manufacturers of composite rebar emphasise presence in this region to leverage lower labour costs and favourable government policies promoting sustainable building materials.
North America registers a sizeable share of around 30%, driven by large‑scale renewal of ageing infrastructure and stringent durability requirements for highways, water treatment plants and tunnels. Projects in the U.S. and Canada emphasise long life span and reduced maintenance costs, which make composite rebar attractive. It enjoys high regulatory acceptance and established supply chains in North America, which supports growth despite higher initial cost of composite materials.
Europe holds an estimated 25% share and shows steady growth tied to green construction regulations and refurbishment initiatives across the EU. Countries in Western Europe push for replacement of steel with non‑corroding reinforcement in marine and transport infrastructure. Emerging markets in Eastern Europe and the Middle East & Africa pick up share gradually, but cost sensitivity and limited awareness hinder faster penetration.
Shape Your Report to Specific Countries or Regions & Enjoy 30% Off!
Key Player Analysis:
- Aslan FRP (Owens Corning) (U.S.)
- Armastek (Russia/UAE/global)
- Schock Bauteile GmbH (Germany)
- Pultron Composites (New Zealand)
- Pultrall Inc. (V‑ROD, Canada)
- Dextra Group (Thailand)
- Marshall Composite Technologies LLC (U.S.)
- Technobasalt‑Invest LLC (Ukraine)
- Kodiak Fiberglass Rebar LLC (U.S.)
- Neuvokas Corporation (U.S.)
- Fiberline Building Profiles A/S (Denmark)
- Sireg Geotech S.r.l. (Italy)
- FIBROLUX GmbH (Germany)
- Composite Group Chelyabinsk (Russia)
- BP Composites Ltd. (Canada)
Competitive Analysis:
The Composite Rebar Market features a fragmented competitive landscape where several specialty players lead. Companies such as Armastek (Turkey), Marshall Composite Technologies (USA) and Dextra Group (Thailand) dominate by virtue of technology portfolios, certifications, and extensive project references. It faces barriers such as high initial material cost and entrenched steel‑rebar supply chains, which new entrants must overcome through innovation or cost reduction. Competitors focus on product differentiation such as higher bond strength or custom resin systems to gain advantage. Strategic partnerships and regional manufacturing expansions mark key growth patterns, enabling companies to reduce logistics cost and respond more quickly to local demand.
Recent Developments:
- In October 2025, Dextra Group announced the pilot deployment of its patented Durabar GFRP (Glass Fiber Reinforced Polymer) carpet at its Thailand manufacturing facility, a milestone toward bringing innovative GFRP reinforcement solutions to the global construction market.
- In November 2024, GFRP Tech initiated a new manufacturing facility in Linbro Park, Gauteng, South Africa, dedicated to producing GFRP rebar, mesh, and bends — including flagship EnviraBar and EnviraMesh products. This facility, having passed international testing by the FRP Institute in the U.S., signifies GFRP Tech’s commitment to serving the South African and wider African infrastructure market where corrosion-resistant rebar is increasingly critical.
- In July 2024, Marshall secured a major contract to manufacture advanced composite torpedo launcher tubes for SEA (a Cohort PLC company), reinforcing the company’s reputation for robust, lightweight, and corrosion-resistant GRP solutions for defense applications.
Report Coverage:
The research report offers an in-depth analysis based on Material Type, Application, End-User Industry. It details leading market players, providing an overview of their business, product offerings, investments, revenue streams, and key applications. Additionally, the report includes insights into the competitive environment, SWOT analysis, current market trends, as well as the primary drivers and constraints. Furthermore, it discusses various factors that have driven market expansion in recent years. The report also explores market dynamics, regulatory scenarios, and technological advancements that are shaping the industry. It assesses the impact of external factors and global economic changes on market growth. Lastly, it provides strategic recommendations for new entrants and established companies to navigate the complexities of the market.
Future Outlook:
- The Composite Rebar Market is expected to grow significantly due to increasing infrastructure development worldwide.
- Growing demand for sustainable construction materials will continue to drive adoption of composite rebar in various industries.
- Technological advancements in manufacturing processes will lower production costs, making composite rebar more accessible.
- Rising infrastructure renewal projects, especially in North America and Europe, will fuel market demand for long-lasting materials.
- Government regulations focusing on corrosion-resistant and eco-friendly construction materials will benefit the composite rebar sector.
- Increased investment in emerging markets, particularly in Asia-Pacific, will open new growth avenues for composite rebar manufacturers.
- The demand for composite rebar in marine infrastructure will rise, driven by the need for corrosion-resistant solutions in coastal regions.
- Construction companies will increasingly turn to composite rebar for high-rise buildings and urban development projects.
- Composite rebar’s appeal in defense and aerospace applications will expand as governments invest in specialized, high-strength materials.
- Hybrid and novel fiber types will gain prominence, offering tailored solutions to meet specific performance requirements in extreme environments.


