Market Overview:
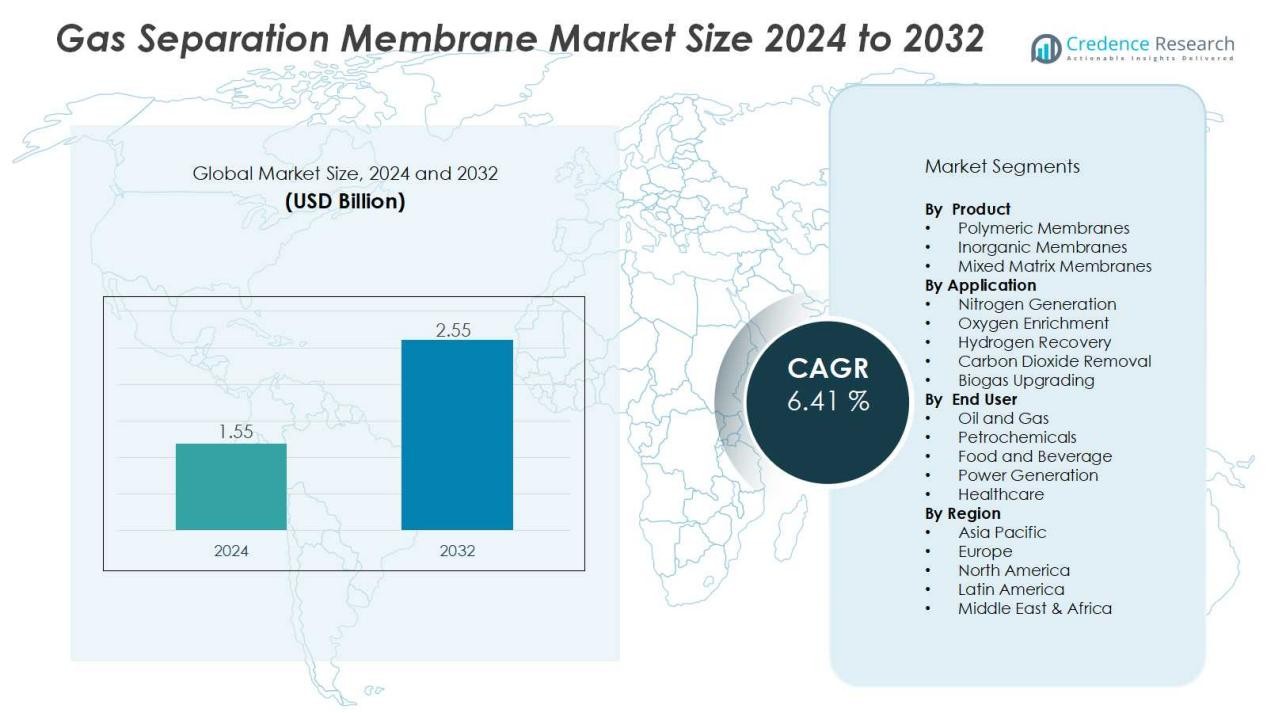
The gas separation membrane market size was valued at USD 1.55 billion in 2024 and is anticipated to reach USD 2.55 billion by 2032, at a CAGR of 6.41 % during the forecast period (2024-2032).
| REPORT ATTRIBUTE |
DETAILS |
| Historical Period |
2020-2023 |
| Base Year |
2024 |
| Forecast Period |
2025-2032 |
| Gas Separation Membrane Market Size 2024 |
USD 1.55 Billion |
| Gas Separation Membrane Market, CAGR |
6.41 % |
| Gas Separation Membrane Market Size 2032 |
USD 2.55 Billion |
Market growth is supported by several drivers, including the growing need for energy-efficient separation solutions compared to conventional methods such as cryogenic distillation and absorption. Heightened environmental concerns, combined with stricter emission regulations, are boosting adoption in carbon dioxide removal and natural gas treatment. Technological advancements in polymeric and composite membranes are enhancing selectivity, permeability, and operational stability, making them suitable for large-scale deployment in diverse industries such as petrochemicals, food processing, and power generation.
Regionally, North America holds a dominant share due to strong industrial gas processing infrastructure and supportive policies for carbon capture and utilization. Europe follows closely, propelled by stringent climate targets and adoption of clean energy solutions. Asia-Pacific is expected to be the fastest-growing region, fueled by rapid industrialization, increasing natural gas consumption, and rising investments in renewable energy and biogas projects, particularly in China and India. Emerging markets in Latin America and the Middle East & Africa are also presenting growth opportunities with expanding petrochemical and energy sectors.
Access crucial information at unmatched prices!
Request your sample report today & start making informed decisions powered by Credence Research Inc.!
Download Sample
Market Insights:
- The gas separation membrane market was valued at USD 1.55 billion in 2024 and is projected to reach USD 2.55 billion by 2032 at a CAGR of 6.41%.
- Rising demand for energy-efficient gas separation technologies is supporting growth, with membranes offering lower energy use and cost advantages compared to traditional methods.
- Stricter environmental regulations and carbon reduction goals are driving adoption of membrane-based systems for carbon dioxide removal, natural gas processing, and biogas upgrading.
- Technological advancements in polymeric, inorganic, and mixed matrix membranes are improving selectivity, durability, and scalability across multiple applications.
- Expanding industrial usage in oil and gas, petrochemicals, power generation, and food and beverage sectors ensures steady long-term demand.
- High operational limitations in harsh conditions and strong competition from cryogenic distillation and pressure swing adsorption remain key challenges.
- North America led the market with 34% share in 2024, followed by Europe at 28%, while Asia-Pacific held 25% and is forecast to grow at the fastest pace due to industrialization and energy demand.
Market Drivers:
Rising Demand for Energy-Efficient Gas Separation Technologies:
The gas separation membrane market benefits from the growing need for cost-effective and energy-efficient alternatives to conventional separation methods. Membranes require less energy than processes such as cryogenic distillation and chemical absorption. Their compact design and lower operating costs make them attractive for large-scale deployment. Industries facing rising energy costs are adopting these solutions to improve operational efficiency while reducing expenses.
- For instance, in September 2024, Evonik introduced its SEPURAN® Green G5X 11” membrane, which delivers double the capacity compared to previous models and enables the production of biomethane with over 99% purity at large landfill and agricultural biogas facilities, supporting more than 1,000 installations globally.
Increasing Role of Environmental Regulations and Carbon Reduction Goals:
Stricter environmental norms are pushing industries to adopt advanced gas separation systems. The gas separation membrane market is expanding as governments enforce tighter emission control measures to address climate change. Membrane-based systems are effective in capturing carbon dioxide from industrial exhausts, natural gas processing, and biogas upgrading. These capabilities align with global carbon reduction targets and encourage wider adoption across heavy industries.
- For instance, in June 2024, Air Liquide commissioned a membrane-based CO₂ capture unit at its Antwerp site, capable of capturing 250 tons of CO₂ per day, supporting industrial decarbonization initiatives.
Technological Advancements in Polymeric and Composite Membranes:
Continuous improvements in membrane materials are expanding application potential across multiple industries. Innovations in polymeric, inorganic, and mixed matrix membranes have improved gas selectivity and permeability. The gas separation membrane market gains from these advancements, which enhance durability, chemical resistance, and scalability. It allows industries to achieve higher separation efficiency in applications such as nitrogen generation, oxygen enrichment, and hydrogen recovery.
Expanding Industrial Applications Across Energy, Chemicals, and Food Sectors:
The increasing use of membranes in diverse industries supports strong market growth. The gas separation membrane market is witnessing demand from oil and gas, petrochemicals, and renewable energy sectors. Food and beverage companies also utilize membranes for packaging and preservation processes requiring controlled atmospheres. Its flexibility across end uses ensures consistent demand and long-term adoption in both developed and emerging markets.
Market Trends:
Growing Integration of Gas Separation Membranes in Carbon Capture and Renewable Energy Projects:
The gas separation membrane market is witnessing strong growth through integration with carbon capture and renewable energy initiatives. Industries are turning to membranes for efficient carbon dioxide removal from power plants, refineries, and natural gas facilities. Their adaptability supports biogas upgrading, which is crucial for renewable energy expansion. Governments are promoting carbon-neutral goals, and industries are aligning investments with these policies. It is helping create opportunities in large-scale deployment, particularly in energy transition projects. Rising demand for cleaner fuels and sustainable practices is positioning membranes as a preferred choice in emission control and renewable gas production.
- For instance, Membrane Technology & Research (MTR) demonstrated its Polaris™ membrane modules at the National Carbon Capture Center, achieving over 95% purity liquid CO2 at a rate of up to 40 lb/hr during pilot operations in 2013.
Advancements in Hybrid Membrane Systems and Expanding Role of Industrial Applications:
Continuous innovations are reshaping market dynamics, with hybrid membrane systems gaining traction. These systems combine membranes with adsorption or cryogenic techniques, offering higher efficiency and flexibility in gas separation. The gas separation membrane market is expanding due to broader adoption in petrochemicals, hydrogen recovery, and air separation units. Food and pharmaceutical industries are also adopting membranes for controlled atmosphere packaging and process safety. It demonstrates versatility in applications beyond traditional gas processing. Increasing investment in advanced manufacturing and chemical processing highlights the growing role of membranes across both established and emerging industrial sectors.
- For instance, researchers developed a hybrid layered double hydroxide (LDH)/polymer membrane that achieved a carbon dioxide transmission rate of 7,748 GPU with CO22/N22selectivity as high as 86, surpassing most commercial systems.
Market Challenges Analysis:
High Operational Limitations and Performance Constraints in Harsh Environments:
The gas separation membrane market faces challenges due to technical and operational limitations in demanding conditions. Membranes often struggle with high-pressure or high-temperature environments, reducing their effectiveness compared to traditional methods. Selectivity and permeability trade-offs limit efficiency for certain gas mixtures, which impacts adoption in specialized industries. It also faces issues such as fouling and degradation when exposed to contaminants, requiring frequent maintenance. These limitations increase operational costs and discourage some end users from large-scale deployment. Industries handling corrosive gases or complex feed streams remain cautious about complete reliance on membrane systems.
Intense Competition from Established Separation Technologies and High Initial Costs:
The gas separation membrane market encounters strong competition from well-established separation techniques such as cryogenic distillation and pressure swing adsorption. These alternatives are widely adopted, particularly in industries that prioritize proven reliability and scale. High initial investment in advanced membrane systems further restrains adoption in cost-sensitive markets. It requires continuous improvements to match the scalability and performance of existing technologies. Limited awareness among small and medium enterprises about the long-term benefits of membranes also restricts growth. Competitive pricing pressure and long payback periods continue to challenge manufacturers aiming for broader global acceptance.
Market Opportunities:
Rising Demand for Clean Energy and Sustainable Industrial Practices:
The gas separation membrane market holds strong opportunities from the global shift toward clean energy and sustainability. Membranes play a critical role in carbon capture, hydrogen recovery, and biogas upgrading, aligning with climate goals. Governments are supporting low-carbon technologies through incentives and stricter emission policies, which creates favorable conditions for adoption. It is also benefiting from the rising demand for natural gas purification in energy and industrial applications. Industries aiming to reduce environmental footprints see membranes as cost-effective and scalable solutions. Growing focus on decarbonization ensures long-term growth prospects in both developed and emerging economies.
Expanding Use in Emerging Industries and Technological Advancements in Membranes:
Emerging applications in pharmaceuticals, food processing, and electronics are creating fresh opportunities for membrane adoption. The gas separation membrane market is advancing through innovations in mixed matrix and inorganic membranes that enhance selectivity and durability. These advancements enable broader industrial usage, including oxygen enrichment, nitrogen generation, and controlled-atmosphere packaging. It also creates potential in sectors requiring high-performance separation under varied conditions. Expanding infrastructure investments in Asia-Pacific and the Middle East are opening new regional markets. Increasing R&D investments and industry collaborations are expected to accelerate commercialization of next-generation membrane technologies.
Market Segmentation Analysis:
By Product:
The gas separation membrane market is segmented into polymeric membranes, inorganic membranes, and mixed matrix membranes. Polymeric membranes dominate due to cost-effectiveness, scalability, and wide industrial usage. Inorganic membranes are gaining traction for their durability and high selectivity under harsh operating conditions. Mixed matrix membranes are emerging as a strong alternative, combining polymer flexibility with inorganic stability. It is driving innovation toward higher performance and long-term efficiency.
- For instance, SK Innovation developed a thin-film composite (TFC) membrane with a CO₂ permeance of 1140 gas permeation units (GPU), using 2wt% 2,4,6-triaminopyrimidine (TAP) as an organic additive to achieve high selectivity over nitrogen and methane.
By Application:
Applications include nitrogen generation, oxygen enrichment, hydrogen recovery, carbon dioxide removal, and biogas upgrading. Carbon dioxide removal leads, supported by growing demand for emission control and natural gas treatment. Hydrogen recovery is expanding with global investments in clean energy and fuel cell technologies. Nitrogen generation remains vital for food packaging, electronics, and chemical industries. It also finds use in oxygen enrichment processes for healthcare and industrial applications.
- For Instance, In May 2024, Climeworks AG commissioned its Mammoth DAC plant in Iceland, designed to capture up to 36,000 metric tons of CO₂ annually using solid sorbent technology
By End-Use:
End-use industries include oil and gas, petrochemicals, food and beverage, power generation, and healthcare. Oil and gas hold the largest share due to high reliance on natural gas purification. Petrochemicals and power generation are increasing adoption for process efficiency and sustainability. Food and beverage industries use membranes for packaging safety and quality preservation. It continues to expand in healthcare for medical oxygen supply and controlled environments.
Segmentations:
By Product:
- Polymeric Membranes
- Inorganic Membranes
- Mixed Matrix Membranes
By Application:
- Nitrogen Generation
- Oxygen Enrichment
- Hydrogen Recovery
- Carbon Dioxide Removal
- Biogas Upgrading
By End-Use:
- Oil and Gas
- Petrochemicals
- Food and Beverage
- Power Generation
- Healthcare
By Region:
- North America
- Europe
- Asia-Pacific
- Latin America
- Middle East & Africa
Regional Analysis:
North America:
North America held 34% market share in 2024, leading the global gas separation membrane market. The region benefits from advanced industrial infrastructure, widespread adoption in natural gas processing, and strict emission control measures. Industries are using membranes for carbon dioxide removal and hydrogen recovery, supporting clean energy goals. It is also driven by U.S. government initiatives promoting carbon capture and storage technologies. Canada’s growing investments in renewable energy further strengthen regional adoption. The presence of key manufacturers and steady R&D spending continues to enhance technological competitiveness.
Europe:
Europe accounted for 28% market share in 2024, ranking as the second-largest market globally. Strong climate targets and renewable energy policies across the European Union drive membrane deployment in carbon capture and biogas upgrading. The gas separation membrane market benefits from the region’s robust petrochemical and chemical industries. It is supported by countries such as Germany, France, and the U.K., which emphasize decarbonization. Growing investments in hydrogen economy projects further support demand for advanced membranes. The region’s well-established manufacturing base and strict regulatory environment ensure consistent market growth.
Asia-Pacific:
Asia-Pacific held 25% market share in 2024 and is projected to grow at the fastest pace. Rapid industrialization and rising energy demand in China, India, and Southeast Asia drive adoption of membrane technologies. The gas separation membrane market in this region benefits from government-backed programs promoting renewable energy and cleaner fuels. It is expanding with investments in natural gas processing, petrochemicals, and biogas projects. Growing environmental awareness and stricter regional regulations support long-term deployment. Increasing collaborations with global players and local production capabilities further enhance market penetration.
Shape Your Report to Specific Countries or Regions & Enjoy 30% Off!
Key Player Analysis:
- Air Liquide Advanced Separations
- Atlas Copco AB
- Air Products and Chemicals, Inc.
- DIC CORPORATION
- FUJIFILM Corporation
- GENERON
- Evonik Industries AG
- GMT Membrantechnik GmbH
- Honeywell International Inc.
- Mahler AGS GmbH
- Parker Hannifin Corp
- JSC Grasys.
- SLB
- UBE Corporation
Competitive Analysis:
The gas separation membrane market is highly competitive, shaped by global players focusing on innovation and strategic expansion. Key companies include Air Liquide Advanced Separations, Atlas Copco AB, Air Products and Chemicals, Inc., DIC Corporation, FUJIFILM Corporation, GENERON, Evonik Industries AG, GMT Membrantechnik GmbH, and Honeywell International Inc. Leading firms emphasize advanced membrane materials to improve selectivity, permeability, and durability across industrial applications. It is also characterized by strong investments in research and development to expand capabilities in carbon capture, hydrogen recovery, and biogas upgrading. Strategic partnerships, acquisitions, and regional expansions are central to strengthening global market presence. Companies are targeting emerging markets in Asia-Pacific and the Middle East to leverage growing energy demand and regulatory support. The competitive landscape reflects a balance of established multinationals and specialized technology providers working to deliver scalable, efficient, and sustainable solutions for industrial and environmental applications.
Recent Developments:
- In July 2025, Air Liquide expanded operations in Gujarat, India, with the launch of a new air separation unit to enhance its specialty gas production capacity.
- In February 2025, Atlas Copco AB acquired the operating assets of Compressed Air Products, Inc. (CAP), a distributor in Newnan, Georgia, USA, integrating the CAP team as a direct branch of Atlas Copco Compressors.
Report Coverage:
The research report offers an in-depth analysis based on Product, Application, End-Use and Region. It details leading Market players, providing an overview of their business, product offerings, investments, revenue streams, and key applications. Additionally, the report includes insights into the competitive environment, SWOT analysis, current Market trends, as well as the primary drivers and constraints. Furthermore, it discusses various factors that have driven Market expansion in recent years. The report also explores Market dynamics, regulatory scenarios, and technological advancements that are shaping the industry. It assesses the impact of external factors and global economic changes on Market growth. Lastly, it provides strategic recommendations for new entrants and established companies to navigate the complexities of the Market.
Future Outlook:
- The gas separation membrane market will see rising adoption in carbon capture projects supporting global decarbonization efforts.
- Growing demand for hydrogen recovery will strengthen its role in clean fuel production and energy transition.
- Technological advancements in mixed matrix and inorganic membranes will enhance efficiency and durability.
- Industrial sectors such as petrochemicals and power generation will expand their reliance on membrane-based systems.
- Biogas upgrading will create new opportunities as governments push for renewable energy integration.
- Food, beverage, and pharmaceutical industries will increase adoption for controlled atmosphere and safety applications.
- Regional expansion in Asia-Pacific will accelerate growth, supported by industrialization and energy infrastructure investments.
- Collaborations between research institutes and manufacturers will drive commercialization of next-generation membrane solutions.
- Rising environmental regulations will push industries to replace traditional separation methods with energy-efficient membranes.
- Digital integration with monitoring and predictive maintenance tools will improve system performance and reduce operational costs.


