
Market Overview
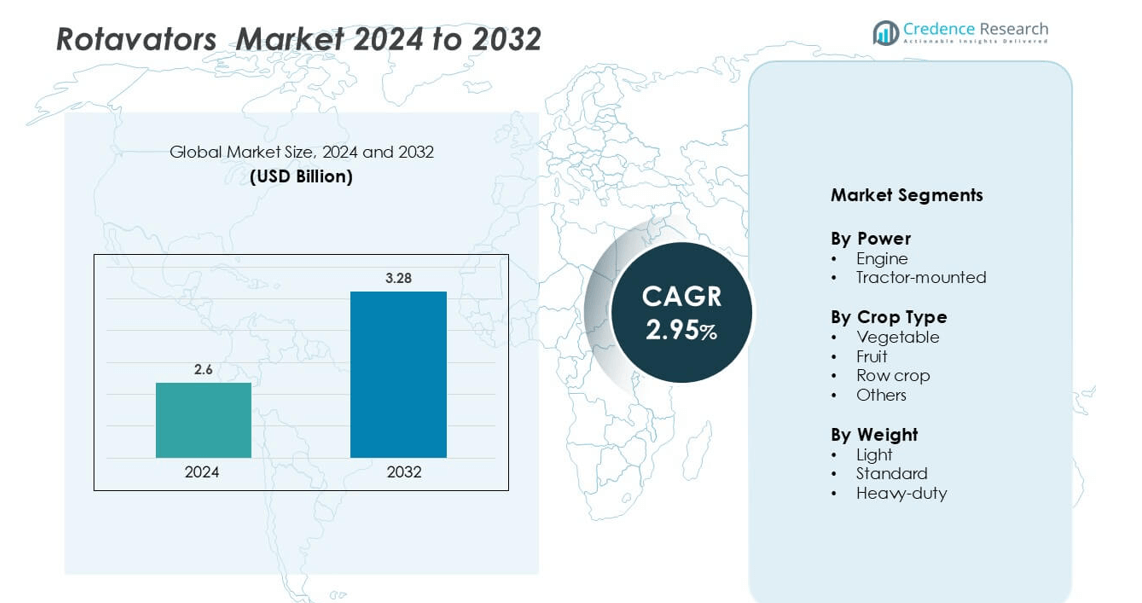
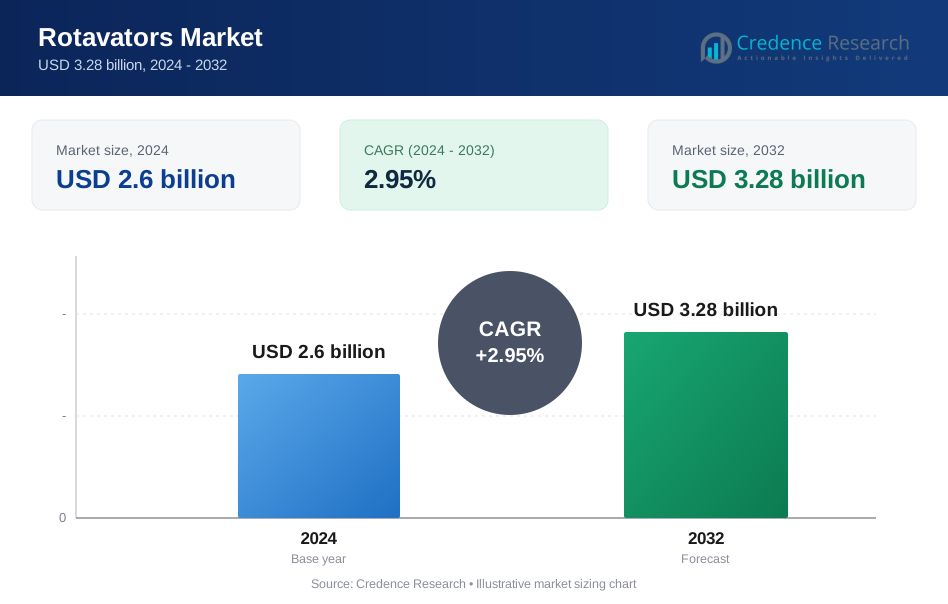
Rotavators Market system market size was valued USD 2.6 billion in 2024 and is anticipated to reach USD 3.28 billion by 2032, at a CAGR of 2.95 % during the forecast period.
| REPORT ATTRIBUTE | DETAILS |
|---|---|
| Historical Period | 2020-2023 |
| Base Year | 2024 |
| Forecast Period | 2025-2032 |
| Rotavators Market Size 2024 | USD 2.6 billion |
| Rotavators Market, CAGR | 2.95% |
| Rotavators Market Size 2032 | USD 3.28 billion |
The rotavators market features strong competition among key players such as Lemken, CNH Industrial (New Holland), Tirth Agro Technology Pvt. Ltd., Mahindra & Mahindra, Kuhn Group, SDF Group (SAME Deutz-Fahr), Preet Agro Industries, Deere & Company (John Deere), Kubota Corporation, and AGCO Corporation. These companies focus on innovation, durable construction, and energy-efficient designs to meet global farming needs. Asia-Pacific leads the global market with a 37.8% share in 2024, supported by rapid mechanization and favorable government initiatives in India and China. Major players are expanding product portfolios and integrating smart technologies such as GPS-enabled control systems to enhance tillage precision and fuel efficiency. Strategic alliances, regional expansion, and after-sales support are key factors shaping competitiveness in the global rotavators industry.
Market Insights
- The Rotavators Market was valued at USD 2.6 billion in 2024 and is projected to grow at a CAGR of 2.95 % during 2024–2032, driven by increasing farm mechanization worldwide.
- Rising demand for efficient soil preparation tools and supportive government schemes promoting agricultural equipment subsidies are key growth drivers across developing regions.
- Technological advancements such as GPS integration, adjustable blade systems, and energy-efficient gear mechanisms are shaping market trends and enhancing operational efficiency.
- Leading companies including Mahindra & Mahindra, CNH Industrial, and John Deere focus on strategic collaborations and innovation, while high initial costs and maintenance challenges restrain adoption among small farmers.
- Asia-Pacific dominates with a 37.8% share, followed by North America and Europe, while the tractor-mounted segment leads the market with a 61.4% share due to its suitability for large-scale farming and superior power efficiency.
Market Segmentation Analysis:
By Power
The tractor-mounted segment held the dominant share in the rotavators market in 2024. This segment’s growth is driven by its suitability for large-scale farming and ability to handle diverse soil conditions efficiently. Farmers prefer tractor-mounted rotavators for their higher power output, fuel efficiency, and adaptability to various field sizes. The growing adoption of medium and high horsepower tractors across developing regions further strengthens this segment’s demand. Manufacturers continue to introduce advanced models with adjustable blades and reduced maintenance costs, supporting widespread usage among commercial and small-scale farmers.
- For instance, The John Deere 6105E tractor's PTO can be set to either 540 or 1,000 RPM. A multi-speed gear box on the tiller then reduces the speed to the appropriate range for tilling.
By Crop Type
Row crop cultivation accounted for the largest market share under this segment. Farmers rely on rotavators to prepare uniform seedbeds and enhance soil aeration for crops like maize, cotton, and soybean. The segment benefits from precision tillage requirements and growing mechanization in intensive farming regions. Rotavators improve nutrient mixing and soil texture, leading to higher yields. Increased government support for farm mechanization and subsidies on agricultural equipment also promote adoption. Demand continues to rise as farmers shift toward mechanized tools for time-efficient land preparation in seasonal cropping cycles.
- For instance, the Kubota L4508 tractor delivers a PTO speed of 540 and 750 revolutions per minute (RPM), powering an attached implement like a rotary tiller for soil pulverization.
By Weight
The standard-weight rotavator segment led the market with a notable share. These models provide an optimal balance between performance and maneuverability, making them suitable for medium-sized farms and diverse soil conditions. Standard rotavators offer higher fuel efficiency and lower operational costs compared to heavy-duty variants. Their versatility in both dry and wet fields attracts farmers aiming for multipurpose use. The growing trend toward compact tractors and small farm mechanization in Asia-Pacific and Latin America drives steady demand for standard-weight rotavators across commercial and individual farming operations.
Key Growth Drivers
Rising Mechanization in Agriculture
The growing shift toward agricultural mechanization is a major driver of the rotavators market. Farmers across developing economies are adopting mechanized equipment to increase productivity and reduce labor dependency. Rotavators enable faster land preparation, uniform soil mixing, and improved seedbed quality, making them essential in modern farming. Government initiatives such as subsidies, farm equipment financing, and mechanization schemes further boost adoption. For instance, India’s Sub-Mission on Agricultural Mechanization (SMAM) has increased small and medium farmers’ access to tillage equipment. Additionally, increasing awareness of soil health management through proper tillage techniques is encouraging farmers to invest in high-performance rotavators designed for various soil condition.
- For instance, a John Deere 2.05-meter rotary tiller (model 2421RT) uses a multi-speed gearbox, but its operating speeds are far lower than 2,000 RPM. For comparison, other John Deere tillers like the 3417 RT and 3419 RT operate with a rotor speed of 215 RPM when connected to a 540 PTO RPM tractor.
Expansion of Row and Vegetable Crop Cultivation
The expansion of row and vegetable crop farming significantly drives rotavator demand. These crops require precise seedbed preparation, which rotavators provide through consistent soil pulverization and residue management. Rising consumption of vegetables and row crops such as maize, soybean, and pulses is increasing the need for efficient tillage solutions. Rotavators help reduce soil compaction and promote better root development, supporting higher yields. In countries like China and India, smallholder farmers increasingly adopt compact rotavators for inter-row tillage and weed control. The push toward high-value crop production under sustainable agriculture programs also contributes to market growth. Manufacturers are launching rotavators compatible with low-horsepower tractors to cater to the needs of small and mid-sized farms.
- For instance, the Zirkon 12 power harrow has a DUAL-Shift transmission that allows for two-speed adjustment of the tine, from 330 to 440 rpm.
Technological Advancements and Product Innovation
Continuous technological development and innovation in tillage equipment are key growth enablers for the rotavator market. Manufacturers focus on introducing models with improved durability, adjustable blade angles, and energy-efficient transmission systems. The integration of precision farming technology, such as GPS-enabled operation and smart depth control, enhances productivity and ease of use. Companies are also investing in lightweight materials to reduce fuel consumption and improve handling efficiency. For instance, advanced gearboxes and multi-speed drives allow operators to adjust working depth and soil mixing according to field conditions. Electric and hybrid-powered variants are gaining traction as part of sustainable farming practices. These innovations collectively enhance operational efficiency, reduce maintenance costs, and increase farmer adoption worldwide.
Key Trends and Opportunities
Rising Demand for Compact and Multi-Purpose Rotavators
Compact and multi-purpose rotavators are witnessing growing demand due to their versatility across small and medium farms. These models are compatible with low-horsepower tractors and offer high maneuverability in narrow fields and orchards. The trend aligns with the increasing adoption of small-scale mechanization in developing regions where farm sizes are limited. Manufacturers are designing modular rotavators that can perform multiple tasks such as tilling, weeding, and residue management. This multifunctionality reduces equipment costs for farmers and supports efficient crop rotation. Growing interest in horticultural and greenhouse farming further strengthens demand for compact units. Additionally, the integration of quick-attach systems and lightweight materials enhances convenience and portability for smallholder operations.
Growing Adoption of Sustainable and Energy-Efficient Equipment
The shift toward sustainability in agriculture is driving demand for energy-efficient and eco-friendly rotavators. Farmers are seeking equipment that minimizes fuel consumption and reduces soil degradation. Manufacturers are responding by using high-strength, low-weight alloys and designing optimized blade geometries to reduce draft force. Electric and hybrid rotavators are emerging as a future opportunity, aligning with global emission reduction goals. The growing use of renewable-powered machinery under sustainable farming initiatives provides new avenues for innovation. The trend toward conservation tillage and organic farming also encourages the use of rotavators that maintain soil structure while minimizing erosion. These developments create a strong foundation for environmentally responsible product advancement in the sector.
- For instance, Maschio Gaspardo offers a rotary tiller range that supports tractors from 10 to 380 hp, enabling broader deployment of lighter machines that demand less draft force.
Key Challenges
High Initial Cost and Limited Access for Small Farmers
The high upfront investment required for purchasing rotavators poses a major barrier, especially in developing economies. Small and marginal farmers often lack access to affordable financing options, making ownership difficult. Even with government subsidies, the overall cost, including tractor compatibility and maintenance expenses, remains a constraint. Rental and custom hiring models have emerged as partial solutions, but rural accessibility and availability are inconsistent. Additionally, fluctuating raw material prices affect equipment costs, impacting affordability further. Manufacturers face the challenge of balancing cost-effectiveness with technological advancement. Expanding credit schemes, cooperatives, and leasing programs will be essential to improve accessibility for low-income farming communities.
- For instance, Mahindra & Mahindra’s Rotavator Gyrovator ZLX requires tractors with a minimum power of 35 HP and integrates hardened blades with a working width of 1.25 meters, increasing precision but also raising capital costs.
Maintenance and Skill Deficiency Among Operators
Another significant challenge is the lack of skilled operators and awareness regarding equipment maintenance. Improper handling and irregular servicing lead to faster wear and reduced lifespan of rotavators. In several regions, farmers lack training on blade adjustment, depth control, and lubrication practices. This results in suboptimal performance and higher repair costs over time. Manufacturers and agricultural departments are addressing this through training programs and digital tutorials. However, the adoption of advanced features like GPS or variable-speed drives still requires technical expertise. The limited availability of service centers and spare parts in remote agricultural areas further compounds the issue, affecting market expansion potential.
Regional Analysis
North America
North America held a 24.6% share of the rotavators market in 2024, driven by widespread farm mechanization and technological adoption. The United States leads due to large-scale commercial farming and precision agriculture practices. Demand for high-efficiency tillage equipment is rising, supported by government programs promoting sustainable soil management. Canada’s focus on energy-efficient agricultural machinery further supports market expansion. Leading manufacturers emphasize GPS-integrated and multi-speed rotavators designed for diverse soil conditions. The growing adoption of advanced tractors with compatible rotary tillage attachments continues to strengthen North America’s position in the global market.
Europe
Europe accounted for a 22.1% share of the rotavators market, supported by strong mechanization in countries like Germany, France, and Italy. Stringent environmental regulations encourage the use of energy-efficient and soil-conserving equipment. Farmers prefer rotavators for precision tillage in organic and sustainable farming systems. Demand is high in horticultural and vineyard applications, where soil aeration and residue management are crucial. Government-backed modernization programs and farm subsidies promote equipment upgrades. Technological innovation and the integration of electric and hybrid systems are key trends contributing to Europe’s consistent market growth.
Asia-Pacific
Asia-Pacific dominated the global rotavators market with a 37.8% share in 2024. Rapid agricultural mechanization in India, China, and Japan fuels strong demand. Government initiatives such as equipment subsidies and low-interest financing support adoption among small and medium farmers. Rotavators are increasingly used for paddy, wheat, and vegetable cultivation due to their soil preparation efficiency. Manufacturers introduce lightweight, cost-effective models tailored for small farms and low-horsepower tractors. Growing emphasis on time-saving and fuel-efficient farming tools strengthens regional growth. Asia-Pacific remains the most dynamic market due to its vast agricultural base and continuous technological improvements.
Latin America
Latin America held a 9.4% share of the rotavators market, led by Brazil, Argentina, and Mexico. Expanding row crop cultivation and rising agricultural exports drive market demand. Farmers prefer tractor-mounted rotavators for their reliability and low maintenance in large fields. Regional governments promote farm modernization through financing programs and technology-driven farming initiatives. Manufacturers focus on durable designs suitable for tropical and semi-arid soils. Increasing mechanization in sugarcane and soybean farming strengthens equipment adoption. Latin America’s focus on improving productivity and reducing manual labor supports consistent growth across key agricultural economies.
Middle East & Africa
The Middle East & Africa region accounted for a 6.1% share of the global rotavators market in 2024. Growth is driven by expanding irrigation projects and rising demand for modern tillage solutions. Countries such as South Africa, Egypt, and Saudi Arabia invest in farm mechanization to enhance food security. Lightweight and standard rotavators are gaining traction among smallholder farmers for soil preparation and residue management. Manufacturers are forming partnerships with local distributors to improve accessibility and after-sales support. Government initiatives promoting sustainable farming and efficient land utilization continue to drive moderate but steady market expansion.
Market Segmentations:
By Power
- Engine
- Tractor-mounted
By Crop Type
- Vegetable
- Fruit
- Row crop
- Others
By Weight
- Light
- Standard
- Heavy-duty
By Geography
- North America
- U.S.
- Canada
- Mexico
- Europe
- Germany
- France
- U.K.
- Italy
- Spain
- Rest of Europe
- Asia Pacific
- China
- Japan
- India
- South Korea
- South-east Asia
- Rest of Asia Pacific
- Latin America
- Brazil
- Argentina
- Rest of Latin America
- Middle East & Africa
- GCC Countries
- South Africa
- Rest of the Middle East and Africa
Competitive Landscape
The rotavators market is moderately consolidated, with major players focusing on expanding their technological and geographic presence. Deere & Company, Mahindra & Mahindra, and CNH Industrial lead the industry through wide product portfolios and strong dealer networks. Companies like Tirth Agro Technology, Lemken, and Kuhn Group emphasize precision farming solutions and energy-efficient designs to enhance soil preparation efficiency. Kubota Corporation and SDF Group leverage advanced power transmission systems to improve fuel economy and operational performance. Preet Agro Industries and AGCO Corporation focus on localized product development and cost-effective models to address smallholder farmers’ needs in emerging markets. Leading players are also investing in automation, GPS-enabled implements, and smart tillage technologies to support sustainable agriculture. Partnerships with distribution networks and aftersales service expansion are key strategies to strengthen market penetration, particularly across Asia-Pacific and Latin America, where mechanized farming adoption is rapidly growing.
Key Player Analysis
- Tirth Agro Technology Pvt. Ltd.
- Lemken
- CNH Industrial (New Holland)
- Mahindra & Mahindra
- Kuhn Group
- SDF Group (SAME Deutz-Fahr)
- Preet Agro Industries
- Deere & Company (John Deere)
- Kubota Corporation
- AGCO Corporation
Recent Developments
- In February 2025, Farmtrac introduced the Promaxx Tractor series, launching seven new models in India. These tractors, ranging from 39 HP to 47 HP, are designed to deliver high performance, comfort, and safety. The lineup includes 39 Promaxx, 42 Promaxx 2WD, 45 Promaxx 4WD, 47 Promaxx 2WD, 47 Promaxx 4WD, 45 Promaxx, and 42 Promaxx 4WD, catering to diverse agricultural and commercial needs
- In December 2024, ACE, a leading manufacturer of construction and material handling equipment, unveiled the DI 6565 AV TREM IV tractor at the KISAN Fair 2024. This 60.5 HP tractor is engineered for heavy-duty agricultural and transport applications, making it suitable for large-scale farming operations
- In June 2024, New Holland, a CNH brand, launched the WORKMASTER 105, marking India’s first-ever 100+ HP TREM-IV tractor. This milestone reflects technological advancement in the Indian tractor market, offering superior performance and durability. With over 15,000 units of the WORKMASTER series already sold in North America, New Holland aims to bring its high-horsepower expertise to Indian farmers
- In February 2024, Sonalika introduced 10 new ‘Tiger’ tractors within the 40-75 HP range, featuring five powerful yet fuel-efficient engines, five multi-speed transmissions, and three 5G hydraulics. Designed in Europe, this advanced tractor series has reinforced Sonalika’s position as the No.1 exporter in international markets, offering farmers customizable options to suit their specific agricultural requirements
Report Coverage
The research report offers an in-depth analysis based on Power, Crop Type, Weight and Geography. It details leading market players, providing an overview of their business, product offerings, investments, revenue streams, and key applications. Additionally, the report includes insights into the competitive environment, SWOT analysis, current market trends, as well as the primary drivers and constraints. Furthermore, it discusses various factors that have driven market expansion in recent years. The report also explores market dynamics, regulatory scenarios, and technological advancements that are shaping the industry. It assesses the impact of external factors and global economic changes on market growth. Lastly, it provides strategic recommendations for new entrants and established companies to navigate the complexities of the market.
Future Outlook
- The demand for compact and multi-functional rotavators will rise among small and medium farmers.
- Manufacturers will focus on developing energy-efficient and low-maintenance models for diverse soil conditions.
- Integration of GPS and precision farming technologies will enhance operational efficiency and accuracy.
- Electric and hybrid-powered rotavators will gain traction under sustainable farming initiatives.
- Asia-Pacific will remain the largest regional market due to continued agricultural mechanization.
- Government subsidies and credit schemes will boost adoption in developing economies.
- Companies will strengthen local manufacturing and distribution networks to reduce equipment costs.
- Technological collaborations will drive innovations in blade design and transmission systems.
- Rental and shared farming equipment services will increase accessibility for smallholder farmers.
- Rising focus on soil conservation and organic farming will encourage demand for advanced rotavators.
Request a Free Sample
Fill in your details and we'll send you a free sample report.
- Sample data tables & charts
- Research methodology
Need a Custom Version of This Report?
Tailor the scope, geography, or segments to your exact requirements.
- Custom geography or segment scope
- Direct access to our analyst team
Frequently Asked Questions
What is the current market size for the Rotavators Market, and what is its projected size in 2032?
At what Compound Annual Growth Rate is the Rotavators Market projected to grow between 2025 and 2032?
Which Rotavators Market segment held the largest share in 2024?
What are the primary factors fueling the growth of the Rotavators Market?
Who are the leading companies in the Rotavators Market?
Which region commanded the largest share of the Rotavators Market in 2024?
Table of Content
Chapter 1. Report Introduction
- 1.1 Report Description & Purpose
- 1.1.1 Report Title & Market Definition
- 1.1.2 Unique Selling Propositions (USP) & Key Differentiators
- 1.1.3 Value Proposition for Stakeholders
- 1.2 Research Objectives
- 1.2.1 Market Sizing Objectives (Volume & Revenue)
- 1.2.2 Segmentation Objectives
- 1.2.3 Competitive Intelligence Objectives
- 1.2.4 Forecast & Scenario Objectives
- 1.3 Report Scope
- 1.3.1 Rotavators Scope – Types & Subtypes Covered
- 1.3.2 Geographic Scope – Regions & Countries Covered
- 1.3.3 Historical Period, Base Year & Forecast Period (2024; forecast to 2032)
- 1.3.4 Inclusions & Exclusions
- 1.4 HS Code & Classification Framework
- 1.5 Currency, Units & Pricing Basis
- 1.6 Target Stakeholders
- 1.7 Limitations & Assumptions
Chapter 2. Executive Summary
- 2.1 Global Rotavators Market Snapshot
- 2.1.1 Market Size – Historical (2024) & Forecast (2024-2032) (2024: USD 2.6 billion → 2032: USD 3.28 billion)
- 2.1.2 Volume & Revenue – Global Totals
- 2.1.3 Key Market Highlights – Top Five Facts
- 2.2 Rotavators Market Segmentation Snapshot
- 2.2.1 Market Split by Region – 2024 vs. 2032
- 2.3 Competitive Snapshot
- 2.3.1 Top 10 Players by Revenue Share – 2024
- 2.3.2 Top 10 Players by Volume Share – 2024
- 2.3.3 Recent Strategic Developments (18-Month Summary)
- 2.4 Key Investment Highlights & Strategic Conclusions
Chapter 3. Rotavators Market Dynamics & Industry Analysis
- 3.1 Market Overview & Context
- 3.1.1 Rotavators Market Position in the Broader Automotive Value Chain
- 3.1.2 OEM vs. Replacement Market Dynamics
- 3.1.3 Market Maturity & Development Stage by Region
- 3.2 Rotavators Market Drivers
- 3.3 Rotavators Market Restraints & Challenges
- 3.4 Rotavators Market Opportunities
- 3.5 Porter's Five Forces Analysis
- 3.5.1 Threat of New Entrants
- 3.5.2 Bargaining Power of Suppliers
- 3.5.3 Bargaining Power of Buyers
- 3.5.4 Threat of Substitutes
- 3.5.5 Competitive Rivalry – Intensity Assessment
- 3.6 Rotavators Value Chain Analysis
- 3.6.1 Upstream – Raw Material/Input Suppliers
- 3.6.1.1 Raw Material/Input 1
- 3.6.1.2 Raw Material/Input 2
- 3.6.1.3 Raw Material/Input 3
- 3.6.2 Midstream – Production/Manufacturing/Service Delivery
- 3.6.2.1 Production/Process Overview
- 3.6.2.2 Key Facility Locations & Capacity by Manufacturer
- 3.6.3 Downstream – Distribution & End Consumer
- 3.6.3.1 Primary Channel – B2B/OEM
- 3.6.3.2 Secondary Channels – Dealer, Retail, Online, Direct
- 3.6.4 Value Chain Profitability Analysis
- 3.6.1 Upstream – Raw Material/Input Suppliers
- 3.7 PESTEL Analysis
- 3.7.1 Political Factors
- 3.7.2 Economic Factors
- 3.7.3 Social Factors
- 3.7.4 Technological Factors
- 3.7.5 Environmental Factors
- 3.7.6 Legal Factors
- 3.8 Rotavators Supply Chain Analysis
- 3.8.1 Raw Material/Input Supply Risk Assessment
- 3.8.2 Manufacturing Concentration Risk (Geographic Exposure)
- 3.8.3 Trade Disruption Impact Analysis
- 3.9 Regulatory & Policy Landscape
Note: The regulatory and policy landscape section covers regulations based on their applicability to the market, Rotavators category, geography, and scope of the study. Only regulatory frameworks with a material impact on operations, compliance, trade, sustainability, or market access are analyzed in detail.
Chapter 4. Key Investment Pockets & Opportunity Analysis
- 4.1 Rotavators Market Attractiveness Analysis
- 4.1.1 By Region – Investment Attractiveness Matrix (Volume × CAGR)
- 4.2 Absolute Revenue Growth Opportunity
- 4.2.1 By Region – Absolute USD Growth Through 2032
- 4.3 Incremental Volume Opportunity
- 4.3.1 By Region – Incremental Volume Through 2032
- 4.3.2 Segment – Incremental Volume
- 4.4 Emerging Submarket Opportunity Deep Dive (Subject to Applicability)
- 4.5 Emerging Market Opportunity Scorecards
- 4.5.1 United States
- 4.5.2 Europe
- 4.5.3 Asia
- 4.5.4 Middle East & Africa
Note: Emerging Market Opportunity Scorecards will be included based on relevance and strategic importance. Regions listed are indicative and may vary depending on data availability and market dynamics.
Chapter 5. Rotavators Import-Export Analysis & Trade Flows
- 5.1 Global Trade Overview
- 5.1.1 Global Export Value by Country (2024)
- 5.1.2 Global Export Volume by Country (2024)
- 5.1.3 Global Import Value by Country (2024)
- 5.1.4 Global Import Volume by Country (2024)
- 5.1.5 Net Trade Balance by Country (2024)
- 5.2 Export Analysis – Segment
- 5.2.1 Type 1 (HS Code)
- 5.2.2 Type 2 (HS Code)
- 5.2.3 Type 3 (HS Code)
- 5.2.4 Type 4 (HS Code)
- 5.2.5 Type 5 (HS Code)
- 5.3 Import Analysis – Segment
- 5.3.1 Type 1 (HS Code)
- 5.3.2 Type 2 (HS Code)
- 5.3.3 Type 3 (HS Code)
- 5.3.4 Type 4 (HS Code)
- 5.3.5 Type 5 (HS Code)
- 5.4 Average Unit Trade Prices
- 5.4.1 Average Export Price – Segment & Country
- 5.4.2 Average Import Price – Segment & Source Country
- 5.4.3 Price Trends (2024)
- 5.5 Key Trade Route Analysis
- 5.5.1 Trade Route 1
- 5.5.2 Trade Route 2
- 5.5.3 Trade Route 3
- 5.5.4 Trade Route 4
- 5.5.5 Trade Route 5
- 5.6 Trade Policy Impact Assessment
- 5.6.1 US Anti-Dumping & Section 301 Tariffs
- 5.6.2 EU Customs Union Impact
- 5.6.3 Major Free Trade Agreements
- 5.6.4 USMCA Rules of Origin
Note: Trade policy analysis will be included only where relevant to the Rotavators market.
Chapter 6. Competitive Landscape & Company Benchmarking
- 6.1 Rotavators Market Concentration & Structure
- 6.1.1 Herfindahl-Hirschman Index (HHI) – vs. 2024
- 6.1.2 Tier 1, Tier 2 & Tier 3 Market Structure
- 6.1.3 Global, Regional & Local Player Dynamics
- 6.2 Rotavators Market Share Analysis – 2024
- 6.2.1 Global Revenue Share by Company
- 6.2.2 Global Volume Share by Company
- 6.2.3 Regional Revenue Share
- 6.2.4 Market Share Evolution ( vs. 2024)
- 6.2.5 OEM Segment Share by Company
- 6.2.6 Replacement Segment Share by Company
- 6.3 Production/Delivery Capacity & Facility Analysis
- 6.3.1 Global Installed Capacity
- 6.3.2 Capacity Utilization Rates
- 6.3.3 Production/Output Volume
- 6.3.4 Facility Locations & Capacity Map
- 6.3.5 Planned Capacity Additions
- 6.4 Rotavators Competitive Benchmarking Matrix
- 6.4.1 Revenue, Volume, CAGR & Profitability Comparison
- 6.4.2 Channel Revenue Mix
- 6.4.3 Geographic Revenue Exposure
- 6.4.4 R&D Intensity
- 6.4.5 Sustainability Maturity
- 6.5 Strategic Developments in Rotavators (Last 24 Months)
- 6.5.1 Mergers, Acquisitions & Divestments
- 6.5.2 New Rotavators Launches
- 6.5.3 Facility Expansions
- 6.5.4 Strategic Alliances, Joint Ventures & Partnerships
- 6.5.5 Distribution Expansion & Market Entry
- 6.5.6 Sustainability & ESG Initiatives
- 6.6 Competitive Strategy Mapping
- 6.6.1 Leader, Challenger, Follower & Niche Classification
- 6.6.2 Pricing Strategy Comparison
- 6.6.3 Channel Strategy Matrix
Note: Strategic developments are included based on their materiality and the availability of reliable information.
Chapter 7. Global Rotavators Market – By Distribution Channel
- 7.1 Segment Overview
- 7.1.1 Volume & Revenue Split by Channel (2024 & 2032)
- 7.1.2 Channel Mix Evolution (2024-2032)
Chapter 8. Regional Market Analysis – Global Overview
- 8.1 Global Regional Overview
- 8.1.1 Regional Volume Share
- 8.1.2 Regional Revenue Share
- 8.1.3 Regional Volume by Region
- 8.1.4 Regional Revenue by Region
- 8.1.5 Regional Forecast Through 2032
- 8.2 Cross-Regional Segment Analysis
- 8.2.1 By Distribution Channel
- 8.2.2 By Brand/Price Tier
Chapter 9. North America Rotavators Market
- 9.1 United States
- 9.2 Canada
- 9.3 Mexico
Chapter 10. Europe Rotavators Market
- 10.1 Germany
- 10.2 France
- 10.3 Italy
- 10.4 United Kingdom
- 10.5 Spain
- 10.6 Poland
- 10.7 Russia
- 10.8 Netherlands
- 10.9 Belgium
- 10.10 Sweden
- 10.11 Denmark
- 10.12 Norway
- 10.13 Rest of Europe
Chapter 11. Asia Pacific Rotavators Market
- 11.1 China
- 11.2 India
- 11.3 Japan
- 11.4 South Korea
- 11.5 Thailand
- 11.6 Indonesia
- 11.7 Vietnam
- 11.8 Malaysia
- 11.9 Australia
- 11.10 Rest of Asia Pacific
Chapter 12. Latin America Rotavators Market
- 12.1 Brazil
- 12.2 Argentina
- 12.3 Colombia
- 12.4 Chile
- 12.5 Rest of Latin America
Chapter 13. Middle East Rotavators Market
- 13.1 Saudi Arabia
- 13.2 United Arab Emirates
- 13.3 Turkey
- 13.4 Israel
- 13.5 Iran
- 13.6 Rest of the Middle East
Chapter 14. Africa Rotavators Market
- 14.1 South Africa
- 14.2 Egypt
- 14.3 Nigeria
- 14.4 Morocco
- 14.5 Rest of Africa
Chapter 15. Rotavators Company Profiles
- 15.1 [Company 01]
- 15.1.1 Company Overview
- 15.1.2 Key Management Personnel
- 15.1.3 Products & Services Portfolio
- 15.1.4 Financial Performance
- 15.1.5 Key Market Focus & Geographic Presence
- 15.1.6 Recent Developments & Strategic Initiatives
Note: The company profile list is preliminary and may change based on research findings, market developments, data availability, and client requirements.
Chapter 16. Appendices
- Appendix A – List of Abbreviations & Acronyms
- Appendix B – Industry Classification Code Reference – Full Series
- Appendix C – Production & Capacity Data Tables
- Appendix D – End-Use & Demand Base Tables
- Appendix E – Consumption & Replacement Rate Assumptions
- Appendix F – ASP Reference Tables
- Appendix G – Manufacturing & Facility Database
- Appendix H – Import-Export Data Tables
- Appendix I – Regulatory Summary Tables
- Appendix J – Primary Research Participant List (Anonymized)
- Appendix K – Primary Research Questionnaire Framework
- Appendix L – Data Sources & Bibliography
- Appendix M – Market Size Divergence & Source Comparison
Chapter 17. Research Methodology
- 17.1 Research Framework & Philosophy
- 17.2 Secondary Research – Sources, Hierarchy & Data Extraction
- 17.3 Data Modeling – Bottom-Up & Top-Down Market Sizing
- 17.4 Primary Research – Stakeholder Framework, LOI & Sample Sizes
- 17.5 Forecast Methodology – Regression, Scenario & Sensitivity Analysis
- 17.6 Quality Control – Four-Layer Validation Framework
- 17.7 Limitations & Standard Assumptions
- 17.8 Disclaimer
