
Market Overview
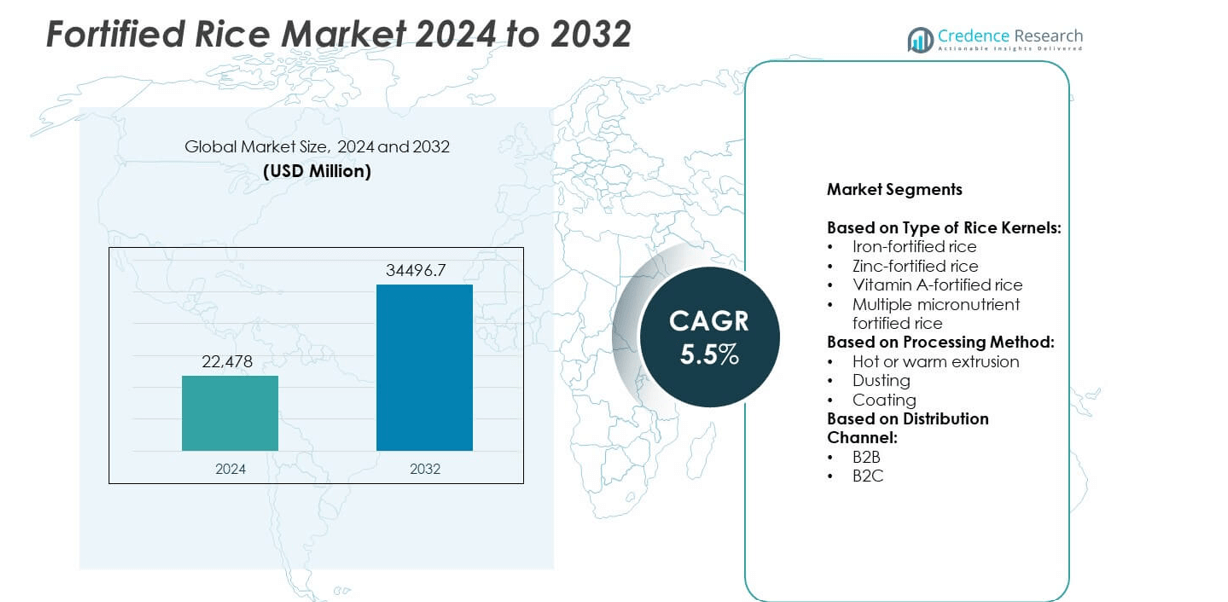
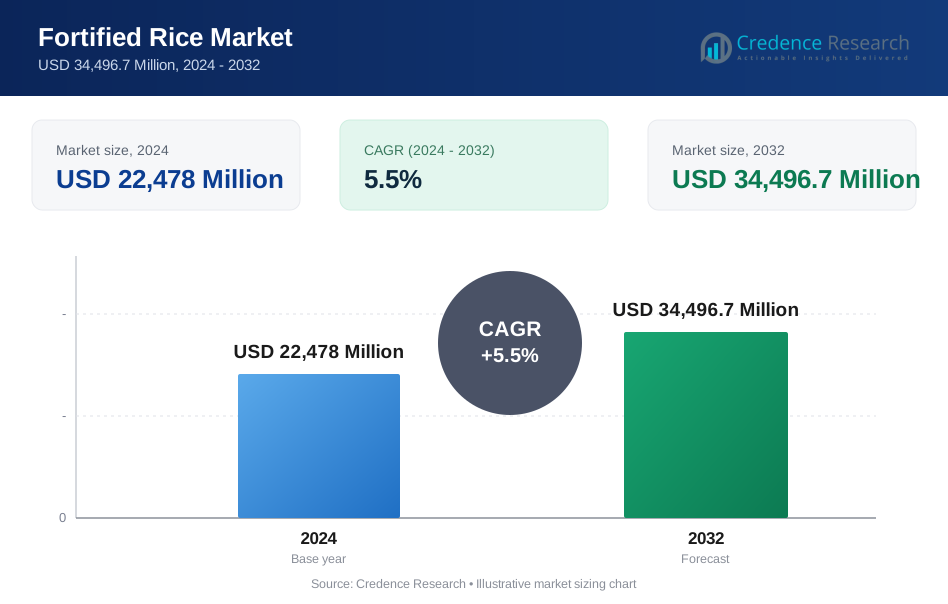
Fortified Rice Market size was valued at USD 22,478 Million in 2024 and is expected to reach USD 34,496.7 Million by 2032, registering a CAGR of 5.5% during the forecast period.
| REPORT ATTRIBUTE | DETAILS |
|---|---|
| Historical Period | 2020-2023 |
| Base Year | 2024 |
| Forecast Period | 2025-2032 |
| Fortified Rice Market Size 2024 | USD 22,478 Million |
| Fortified Rice Market, CAGR | 5.5% |
| Fortified Rice Market Size 2032 | USD 34,496.7 Million |
Fortified Rice market growth is driven by government nutrition programs, rising health awareness, and strong public-private partnerships. Large-scale initiatives address micronutrient deficiencies through mandatory fortification in several countries. Technological advancements in extrusion and coating methods improve nutrient stability and cooking quality. Expanding distribution through retail and e-commerce channels boosts consumer access. Rising disposable incomes in developing economies encourage household adoption. Global organizations and NGOs support fortification efforts, strengthening supply chains and creating long-term opportunities for producers.
North America and Europe show steady demand supported by strong nutrition programs and regulatory frameworks, while Asia Pacific leads with large-scale public distribution initiatives. Latin America focuses on addressing rural malnutrition, and Middle East & Africa present high-growth potential through aid programs. Key players such as BASF SE, KRBL Ltd, Cargill Incorporated, and LT Foods invest in technology, partnerships, and capacity expansion to strengthen their presence and meet growing demand across institutional, retail, and online distribution channels worldwide.
Market Insights
- Fortified Rice market was valued at USD 22,478 Million in 2024 and is projected to reach USD 34,496.7 Million by 2032, growing at a CAGR of 5.5%.
- Market growth is driven by government-led nutrition programs, rising consumer health awareness, and global initiatives targeting hidden hunger.
- Trends include adoption of extrusion and coating technologies, expansion of fortified rice in school feeding programs, and increasing B2C availability through retail and e-commerce channels.
- Competition is marked by players like BASF SE, KRBL Ltd, Cargill Incorporated, LT Foods, and Bunge Ltd investing in capacity expansion and technological improvements.
- High production costs, limited awareness in rural areas, and supply chain complexities act as major restraints for market expansion.
- North America and Europe show steady growth with institutional demand, Asia Pacific leads in adoption due to government mandates, and Latin America and Africa present rising opportunities.
- Partnerships between governments, NGOs, and private companies continue to strengthen distribution networks and create a stable demand base for fortified rice globally.
Market Drivers
Rising Global Focus on Malnutrition and Food Security
Fortified Rice market benefits from increasing government efforts to fight hidden hunger and malnutrition. Many regions face vitamin and mineral deficiencies, prompting large-scale fortification programs. It helps provide essential micronutrients like iron, zinc, and vitamin A to vulnerable populations. Governments and NGOs partner with food producers to integrate fortified rice into public distribution systems. Large-scale school feeding and social welfare programs further accelerate adoption. These initiatives strengthen demand and support long-term growth of fortified rice solutions.
- For instance, DSM in partnership with WFP has helped more than 15 million people annually access fortified rice via social safety nets in 20 countries
Supportive Regulatory Framework and Government Mandates
National and regional regulations encourage mandatory fortification in many rice-consuming countries. Clear policies streamline producer compliance and improve quality standards. It ensures consistent nutrient levels across fortified rice products. Government subsidies and tax incentives lower production costs for suppliers. Policy-driven public procurement of fortified rice increases volumes and stabilizes demand. Such measures make fortified rice a key tool in public health programs.
- For instance, in India the FSSAI requires that 1 kg of fortified rice must contain iron at 28-42.5 mg, folic acid 75-125 µg, and vitamin B12 0.75-1.25 µg
Technological Advancements Enhancing Product Quality
Innovations in fortification technology improve nutrient retention and cooking quality. New coating and extrusion techniques deliver better nutrient stability without changing taste or texture. It allows consumers to adopt fortified rice without altering dietary habits. Manufacturers invest in automation to maintain uniformity across production batches. Improved blending techniques minimize nutrient loss during washing and cooking. These advancements enhance consumer acceptance and strengthen market competitiveness.
Growing Awareness and Consumer Preference for Nutritional Products
Consumers are increasingly focused on balanced diets and nutritional health. Fortified Rice market gains from campaigns promoting fortified staples as a simple solution. It appeals to health-conscious buyers seeking affordable sources of vitamins and minerals. Retailers expand distribution through supermarkets and e-commerce platforms, increasing accessibility. Rising incomes in developing economies boost willingness to spend on nutrient-rich foods. The growing focus on preventive healthcare continues to support market expansion.
Market Trends
Expansion of Public Distribution and Social Welfare Programs
Fortified Rice market experiences strong momentum through government-led food security programs. Public distribution systems include fortified rice to improve population health. It creates stable and recurring demand for producers. School feeding initiatives integrate fortified rice to support child nutrition and development. Partnerships with NGOs and development agencies broaden program reach in rural areas. These initiatives turn fortified rice into a regular part of community diets.
- For instance, AGI Milltec’s FRK (Fortified Rice Kernel) manufacturing line has a production capacity of 500 kg/hour and uses installed power of 425 kW, real power 320 kW.
Shift Toward Extrusion and Coating-Based Fortification Techniques
Manufacturers adopt advanced extrusion and coating technologies to improve nutrient delivery. These methods maintain nutrient stability during washing and cooking. It ensures higher bioavailability of vitamins and minerals for consumers. Production processes become more efficient, enabling large-scale adoption. Use of cost-effective fortificants makes fortified rice more affordable. Technological progress drives product standardization across regions.
- For instance, in Uttar Pradesh, the government is distributing fortified rice to 15.05 crore beneficiaries under NFSA via 46.10 lakh metric tonnes annual allocation.
Rising Participation of Private Sector and Global Players
Large food companies and millers invest in fortified rice production capacity. Strategic partnerships with governments and aid agencies secure long-term supply contracts. It allows businesses to scale operations while meeting nutrition goals. Multinational firms expand presence in high-burden regions through joint ventures. Brand campaigns promote fortified rice as a premium yet accessible staple. This trend boosts competition and encourages innovation in nutrient formulations.
Growth of Retail and E-Commerce Distribution Channels
Modern retail and online grocery platforms increase availability of fortified rice for urban consumers. Direct-to-consumer models help educate buyers on health benefits. It expands reach beyond institutional programs into household consumption. Supermarkets dedicate shelf space to fortified products, boosting visibility. E-commerce platforms offer subscription models for regular supply. This trend helps convert fortified rice into a mainstream dietary choice.
Market Challenges Analysis
High Production Costs and Supply Chain Limitations
Fortified Rice market faces pressure from high production costs linked to fortificant ingredients and technology. Specialized equipment and blending processes raise capital requirements for small millers. It creates a cost gap between regular and fortified rice, limiting adoption in price-sensitive markets. Logistics add complexity, as fortified kernels need careful handling to maintain nutrient integrity. Supply chain disruptions affect consistent availability in remote areas. Rising energy and transport costs further strain producers, affecting profit margins and affordability for end users.
Low Consumer Awareness and Acceptance Barriers
Limited awareness about the benefits of fortified rice slows household-level adoption. Many consumers remain unaware of its role in addressing micronutrient deficiencies. It can face resistance due to perceptions of altered taste, color, or cooking quality. Education campaigns are required to build trust and encourage regular consumption. Rural areas face challenges in distribution and last-mile delivery. Weak communication channels reduce exposure to health messages, leaving fortified rice underutilized despite government programs.
Market Opportunities
Rising Government Support and Global Nutrition Initiatives
Fortified Rice market has strong growth prospects with expanding government nutrition programs. Public procurement of fortified rice for welfare schemes continues to rise. It benefits from partnerships with international bodies like WHO and UNICEF promoting large-scale fortification. Funding from development agencies supports infrastructure upgrades and training for millers. Policies encouraging private sector participation increase production capacity. These initiatives create a favorable environment for long-term adoption and market expansion.
Innovation in Product Development and New Distribution Channels
Advances in technology allow development of fortified rice that matches taste and texture preferences. New nutrient blends target specific deficiencies in different regions. It enables customization and higher acceptance across diverse populations. Growth of modern retail and e-commerce channels opens access to urban and semi-urban buyers. Subscription models and direct-to-consumer campaigns promote regular consumption. These opportunities help shift fortified rice from program-based use to mainstream dietary choice.
Market Segmentation Analysis:
By Type of Rice Kernels:
Iron-fortified rice holds the dominant share due to widespread government programs targeting anemia reduction. It is widely distributed through public distribution systems and school meal schemes. Zinc-fortified rice is gaining attention for its role in immune support and child growth. Vitamin A-fortified rice serves markets with high prevalence of night blindness and vision-related deficiencies. Multiple micronutrient fortified rice is emerging as a comprehensive solution to address several deficiencies simultaneously, making it popular for large-scale welfare programs.
- For instance, Indian FRK standards specify blending at 1-2% of fortified rice kernels to ensure required iron, folic acid, and B12 levels, with the specific ratio given by FSSAI 1:100.
By Processing Method:
Hot or warm extrusion accounts for a major share due to its ability to ensure uniform nutrient blending and higher stability during cooking. It delivers consistent quality, which is preferred for bulk government procurement. Dusting is a lower-cost method but faces limitations in nutrient retention during washing. Coating remains a popular option where rapid production and cost efficiency are required. It helps meet demand in price-sensitive markets while balancing nutrient delivery.
- For instance, in the extruded kernel technique, iron retention in cooked fortified rice kernels is more than 90%, per Indian standard IS 17782.
By Distribution Channel:
B2B dominates with strong demand from government contracts, aid agencies, and institutional buyers. It secures long-term volume commitments and ensures fortified rice reaches low-income populations through welfare programs. B2C is witnessing steady growth driven by rising awareness among urban consumers and availability through supermarkets and e-commerce. It enables direct access to health-conscious households, gradually shifting fortified rice from institutional supply toward mainstream retail consumption.
Segments:
Based on Type of Rice Kernels:
- Iron-fortified rice
- Zinc-fortified rice
- Vitamin A-fortified rice
- Multiple micronutrient fortified rice
Based on Processing Method:
- Hot or warm extrusion
- Dusting
- Coating
Based on Distribution Channel:
- B2B
- B2C
Based on the Geography:
- North America
- U.S.
- Canada
- Mexico
- Europe
- UK
- France
- Germany
- Italy
- Spain
- Russia
- Belgium
- Netherlands
- Austria
- Sweden
- Poland
- Denmark
- Switzerland
- Rest of Europe
- Asia Pacific
- China
- Japan
- South Korea
- India
- Australia
- Thailand
- Indonesia
- Vietnam
- Malaysia
- Philippines
- Taiwan
- Rest of Asia Pacific
- Latin America
- Brazil
- Argentina
- Peru
- Chile
- Colombia
- Rest of Latin America
- Middle East
- UAE
- KSA
- Israel
- Turkey
- Iran
- Rest of Middle East
- Africa
- Egypt
- Nigeria
- Algeria
- Morocco
- Rest of Africa
Regional Analysis
North America
North America holds 22% of the fortified rice market share, supported by strong nutrition programs and rising health awareness. The region benefits from government initiatives such as the USDA’s food assistance programs, which promote micronutrient-rich diets for low-income households. It is witnessing growing adoption of fortified staples in school feeding programs and food banks. Major producers focus on supplying fortified rice to institutional buyers while expanding B2C availability through retail chains. Consumers in the United States and Canada prefer rice varieties with enhanced nutritional profiles, supporting premium offerings. Rising immigrant populations from Asia and Latin America create consistent demand for rice, which further drives fortified rice integration into mainstream consumption patterns. Strategic partnerships between government bodies and private millers continue to strengthen the supply network and ensure quality compliance.
Europe
Europe accounts for 18% of the fortified rice market, driven by strong food safety regulations and emphasis on public health. The European Union supports fortification initiatives under its nutritional deficiency reduction programs. It encourages food manufacturers to maintain strict nutrient composition standards, increasing consumer trust. Growing health-conscious populations in Germany, France, and the UK show higher acceptance of fortified rice. Retail penetration is strong, with supermarkets and hypermarkets playing a key role in distribution. Product innovation in multiple micronutrient blends attracts consumers seeking comprehensive health benefits. Public health campaigns on hidden hunger and vitamin deficiencies further promote fortified rice consumption across the region.
Asia Pacific
Asia Pacific dominates the market with 44% share, making it the largest contributor to global fortified rice demand. The region’s high rice consumption provides a natural platform for large-scale fortification. It benefits from government-led initiatives in India, China, and the Philippines that target malnutrition through mandatory fortification programs. It experiences strong participation from NGOs and global organizations, which support public distribution schemes and school feeding programs. Technological adoption, such as extrusion-based fortification, ensures cost-effective production at scale. Growing middle-class populations in Southeast Asia and rising urbanization drive B2C demand for packaged fortified rice. This region continues to be the primary focus for industry investments and capacity expansion projects.
Latin America
Latin America holds 10% market share, with Brazil and Mexico leading adoption through government-supported social welfare programs. It relies on fortified rice to combat iron and vitamin A deficiencies prevalent in rural communities. Key players collaborate with local governments to expand production capacity and improve distribution networks. Retail adoption is increasing in urban centers, supported by campaigns promoting fortified foods. It benefits from partnerships with international health agencies working to reduce child malnutrition. Rising disposable incomes enable wider household-level purchases of fortified rice products. Institutional demand remains a strong driver due to school nutrition and feeding programs.
Middle East and Africa
Middle East and Africa account for 6% of the fortified rice market share, but represent high potential for future growth. The region faces a significant micronutrient deficiency burden, making fortification a key public health priority. Governments and NGOs are collaborating to introduce fortified rice in national food assistance programs. It faces challenges related to distribution infrastructure and cost barriers, especially in low-income countries. However, urban centers show growing acceptance of fortified foods through supermarkets and modern retail. Investments in local milling facilities and technology transfer projects are expected to enhance production capacity. Long-term opportunities lie in integrating fortified rice into humanitarian aid programs and food security initiatives across sub-Saharan Africa and the Gulf states.
Key Player Analysis
- BASF SE
- KRBL Ltd
- Cargill Incorporated
- LT Foods
- Willmar International Ltd
- Bunge Ltd
- General Mills Inc
- Hain Celestial (Tida Rice)
- Aroma Fields
- REI Agro Ltd
Competitive Analysis
The leading players in the fortified rice market include BASF SE, KRBL Ltd, Cargill Incorporated, LT Foods, Willmar International Ltd, Bunge Ltd, General Mills Inc, Hain Celestial (Tida Rice), Aroma Fields, and REI Agro Ltd. These companies focus on expanding fortified rice production capacity and strengthening supply chains to meet growing institutional and retail demand. They invest in advanced extrusion and coating technologies to ensure consistent nutrient delivery and improve cooking quality. Strategic collaborations with governments and international agencies allow them to secure long-term procurement contracts and participate in large-scale food security programs. Players also emphasize research and development to create nutrient blends tailored to regional health needs and consumer preferences. Marketing efforts highlight fortified rice’s role in combating micronutrient deficiencies, helping build awareness and trust among consumers. Expanding distribution through supermarkets, online platforms, and direct-to-consumer channels ensures broader accessibility. Competition is intensifying as multinational corporations and regional millers enter the market, driving innovation and price competitiveness. Strong focus on quality compliance, certifications, and sustainability initiatives positions these companies as key contributors to global nutrition improvement efforts.
Recent Developments
- In 2025, KRBL announced its entry into the health-oriented FMCG segment with its new India Gate Uplife range, including functional blended edible oils, and said it plans exploring fortified staples among its future portfolio.
- In 2024, BASF and IRRI launched a research collaboration called “OPTIMA Rice” in Laguna, Philippines to reduce greenhouse gas emissions in rice production.
- In 2024, Cargill and HarvestPlus launched the NutriHarvest project, a 36-month initiative to improve food security and support farmers in India, Kenya, Tanzania, and Guatemala, delivering over 17 million nutritious meals
Report Coverage
The research report offers an in-depth analysis based on Type of Rice Kernels, Processing Method, Distribution Channel and Geography. It details leading market players, providing an overview of their business, product offerings, investments, revenue streams, and key applications. Additionally, the report includes insights into the competitive environment, SWOT analysis, current market trends, as well as the primary drivers and constraints. Furthermore, it discusses various factors that have driven market expansion in recent years. The report also explores market dynamics, regulatory scenarios, and technological advancements that are shaping the industry. It assesses the impact of external factors and global economic changes on market growth. Lastly, it provides strategic recommendations for new entrants and established companies to navigate the complexities of the market.
Future Outlook
- The market is expected to grow steadily with rising demand for fortified staples worldwide.
- Government-backed nutrition programs will continue to drive large-scale procurement of fortified rice.
- Adoption of extrusion technology will improve product consistency and nutrient retention.
- Private sector investment will expand production capacity and strengthen supply chains.
- Consumer awareness campaigns will boost household-level acceptance of fortified rice.
- Retail and e-commerce channels will increase product availability in urban markets.
- Customized micronutrient blends will address region-specific health deficiencies.
- Partnerships between global organizations and local producers will enhance reach in developing regions.
- Focus on sustainable production methods will attract health-conscious and eco-aware consumers.
- Long-term growth will be supported by integration of fortified rice into public health strategies.
Request a Free Sample
Fill in your details and we'll send you a free sample report.
- Sample data tables & charts
- Research methodology
Need a Custom Version of This Report?
Tailor the scope, geography, or segments to your exact requirements.
- Custom geography or segment scope
- Direct access to our analyst team
Frequently Asked Questions
What is the current market size for Fortified Rice market, and what is its projected size in 2032?
At what Compound Annual Growth Rate is the Fortified Rice Market projected to grow between 2025 and 2032?
Which Fortified Rice market segment held the largest share in 2024?
What are the primary factors fueling the growth of the Fortified Rice market?
Who are the leading companies in the Fortified Rice Market?
Which region commanded the largest share of the Fortified Rice market in 2024?
Table of Content
Chapter 1. Report Introduction
- 1.1 Report Description & Purpose
- 1.1.1 Report Title & Market Definition
- 1.1.2 Unique Selling Propositions (USP) & Key Differentiators
- 1.1.3 Value Proposition for Stakeholders
- 1.2 Research Objectives
- 1.2.1 Market Sizing Objectives (Volume & Revenue)
- 1.2.2 Segmentation Objectives
- 1.2.3 Competitive Intelligence Objectives
- 1.2.4 Forecast & Scenario Objectives
- 1.3 Report Scope
- 1.3.1 Fortified Rice Scope – Types & Subtypes Covered
- 1.3.2 Geographic Scope – Regions & Countries Covered
- 1.3.3 Historical Period, Base Year & Forecast Period (2024; forecast to 2032)
- 1.3.4 Inclusions & Exclusions
- 1.4 HS Code & Classification Framework
- 1.5 Currency, Units & Pricing Basis
- 1.6 Target Stakeholders
- 1.7 Limitations & Assumptions
Chapter 2. Executive Summary
- 2.1 Global Fortified Rice Market Snapshot
- 2.1.1 Market Size – Historical (2024) & Forecast (2024-2032) (2024: USD 22,478 Million → 2032: USD 34,496.7 Million)
- 2.1.2 Volume & Revenue – Global Totals
- 2.1.3 Key Market Highlights – Top Five Facts
- 2.2 Fortified Rice Market Segmentation Snapshot
- 2.2.1 Market Split by Region – 2024 vs. 2032
- 2.3 Competitive Snapshot
- 2.3.1 Top 10 Players by Revenue Share – 2024
- 2.3.2 Top 10 Players by Volume Share – 2024
- 2.3.3 Recent Strategic Developments (18-Month Summary)
- 2.4 Key Investment Highlights & Strategic Conclusions
Chapter 3. Fortified Rice Market Dynamics & Industry Analysis
- 3.1 Market Overview & Context
- 3.1.1 Fortified Rice Market Position in the Broader Automotive Value Chain
- 3.1.2 OEM vs. Replacement Market Dynamics
- 3.1.3 Market Maturity & Development Stage by Region
- 3.2 Fortified Rice Market Drivers
- 3.3 Fortified Rice Market Restraints & Challenges
- 3.4 Fortified Rice Market Opportunities
- 3.5 Porter's Five Forces Analysis
- 3.5.1 Threat of New Entrants
- 3.5.2 Bargaining Power of Suppliers
- 3.5.3 Bargaining Power of Buyers
- 3.5.4 Threat of Substitutes
- 3.5.5 Competitive Rivalry – Intensity Assessment
- 3.6 Fortified Rice Value Chain Analysis
- 3.6.1 Upstream – Raw Material/Input Suppliers
- 3.6.1.1 Raw Material/Input 1
- 3.6.1.2 Raw Material/Input 2
- 3.6.1.3 Raw Material/Input 3
- 3.6.2 Midstream – Production/Manufacturing/Service Delivery
- 3.6.2.1 Production/Process Overview
- 3.6.2.2 Key Facility Locations & Capacity by Manufacturer
- 3.6.3 Downstream – Distribution & End Consumer
- 3.6.3.1 Primary Channel – B2B/OEM
- 3.6.3.2 Secondary Channels – Dealer, Retail, Online, Direct
- 3.6.4 Value Chain Profitability Analysis
- 3.6.1 Upstream – Raw Material/Input Suppliers
- 3.7 PESTEL Analysis
- 3.7.1 Political Factors
- 3.7.2 Economic Factors
- 3.7.3 Social Factors
- 3.7.4 Technological Factors
- 3.7.5 Environmental Factors
- 3.7.6 Legal Factors
- 3.8 Fortified Rice Supply Chain Analysis
- 3.8.1 Raw Material/Input Supply Risk Assessment
- 3.8.2 Manufacturing Concentration Risk (Geographic Exposure)
- 3.8.3 Trade Disruption Impact Analysis
- 3.9 Regulatory & Policy Landscape
Note: The regulatory and policy landscape section covers regulations based on their applicability to the market, Fortified Rice category, geography, and scope of the study. Only regulatory frameworks with a material impact on operations, compliance, trade, sustainability, or market access are analyzed in detail.
Chapter 4. Key Investment Pockets & Opportunity Analysis
- 4.1 Fortified Rice Market Attractiveness Analysis
- 4.1.1 By Region – Investment Attractiveness Matrix (Volume × CAGR)
- 4.2 Absolute Revenue Growth Opportunity
- 4.2.1 By Region – Absolute USD Growth Through 2032
- 4.3 Incremental Volume Opportunity
- 4.3.1 By Region – Incremental Volume Through 2032
- 4.3.2 Segment – Incremental Volume
- 4.4 Emerging Submarket Opportunity Deep Dive (Subject to Applicability)
- 4.5 Emerging Market Opportunity Scorecards
- 4.5.1 United States
- 4.5.2 Europe
- 4.5.3 Asia
- 4.5.4 Middle East & Africa
Note: Emerging Market Opportunity Scorecards will be included based on relevance and strategic importance. Regions listed are indicative and may vary depending on data availability and market dynamics.
Chapter 5. Fortified Rice Import-Export Analysis & Trade Flows
- 5.1 Global Trade Overview
- 5.1.1 Global Export Value by Country (2024)
- 5.1.2 Global Export Volume by Country (2024)
- 5.1.3 Global Import Value by Country (2024)
- 5.1.4 Global Import Volume by Country (2024)
- 5.1.5 Net Trade Balance by Country (2024)
- 5.2 Export Analysis – Segment
- 5.2.1 Type 1 (HS Code)
- 5.2.2 Type 2 (HS Code)
- 5.2.3 Type 3 (HS Code)
- 5.2.4 Type 4 (HS Code)
- 5.2.5 Type 5 (HS Code)
- 5.3 Import Analysis – Segment
- 5.3.1 Type 1 (HS Code)
- 5.3.2 Type 2 (HS Code)
- 5.3.3 Type 3 (HS Code)
- 5.3.4 Type 4 (HS Code)
- 5.3.5 Type 5 (HS Code)
- 5.4 Average Unit Trade Prices
- 5.4.1 Average Export Price – Segment & Country
- 5.4.2 Average Import Price – Segment & Source Country
- 5.4.3 Price Trends (2024)
- 5.5 Key Trade Route Analysis
- 5.5.1 Trade Route 1
- 5.5.2 Trade Route 2
- 5.5.3 Trade Route 3
- 5.5.4 Trade Route 4
- 5.5.5 Trade Route 5
- 5.6 Trade Policy Impact Assessment
- 5.6.1 US Anti-Dumping & Section 301 Tariffs
- 5.6.2 EU Customs Union Impact
- 5.6.3 Major Free Trade Agreements
- 5.6.4 USMCA Rules of Origin
Note: Trade policy analysis will be included only where relevant to the Fortified Rice market.
Chapter 6. Competitive Landscape & Company Benchmarking
- 6.1 Fortified Rice Market Concentration & Structure
- 6.1.1 Herfindahl-Hirschman Index (HHI) – vs. 2024
- 6.1.2 Tier 1, Tier 2 & Tier 3 Market Structure
- 6.1.3 Global, Regional & Local Player Dynamics
- 6.2 Fortified Rice Market Share Analysis – 2024
- 6.2.1 Global Revenue Share by Company
- 6.2.2 Global Volume Share by Company
- 6.2.3 Regional Revenue Share
- 6.2.4 Market Share Evolution ( vs. 2024)
- 6.2.5 OEM Segment Share by Company
- 6.2.6 Replacement Segment Share by Company
- 6.3 Production/Delivery Capacity & Facility Analysis
- 6.3.1 Global Installed Capacity
- 6.3.2 Capacity Utilization Rates
- 6.3.3 Production/Output Volume
- 6.3.4 Facility Locations & Capacity Map
- 6.3.5 Planned Capacity Additions
- 6.4 Fortified Rice Competitive Benchmarking Matrix
- 6.4.1 Revenue, Volume, CAGR & Profitability Comparison
- 6.4.2 Channel Revenue Mix
- 6.4.3 Geographic Revenue Exposure
- 6.4.4 R&D Intensity
- 6.4.5 Sustainability Maturity
- 6.5 Strategic Developments in Fortified Rice (Last 24 Months)
- 6.5.1 Mergers, Acquisitions & Divestments
- 6.5.2 New Fortified Rice Launches
- 6.5.3 Facility Expansions
- 6.5.4 Strategic Alliances, Joint Ventures & Partnerships
- 6.5.5 Distribution Expansion & Market Entry
- 6.5.6 Sustainability & ESG Initiatives
- 6.6 Competitive Strategy Mapping
- 6.6.1 Leader, Challenger, Follower & Niche Classification
- 6.6.2 Pricing Strategy Comparison
- 6.6.3 Channel Strategy Matrix
Note: Strategic developments are included based on their materiality and the availability of reliable information.
Chapter 7. Global Fortified Rice Market – By Distribution Channel
- 7.1 Segment Overview
- 7.1.1 Volume & Revenue Split by Channel (2024 & 2032)
- 7.1.2 Channel Mix Evolution (2024-2032)
Chapter 8. Regional Market Analysis – Global Overview
- 8.1 Global Regional Overview
- 8.1.1 Regional Volume Share
- 8.1.2 Regional Revenue Share
- 8.1.3 Regional Volume by Region
- 8.1.4 Regional Revenue by Region
- 8.1.5 Regional Forecast Through 2032
- 8.2 Cross-Regional Segment Analysis
- 8.2.1 By Distribution Channel
- 8.2.2 By Brand/Price Tier
Chapter 9. North America Fortified Rice Market
- 9.1 United States
- 9.2 Canada
- 9.3 Mexico
Chapter 10. Europe Fortified Rice Market
- 10.1 Germany
- 10.2 France
- 10.3 Italy
- 10.4 United Kingdom
- 10.5 Spain
- 10.6 Poland
- 10.7 Russia
- 10.8 Netherlands
- 10.9 Belgium
- 10.10 Sweden
- 10.11 Denmark
- 10.12 Norway
- 10.13 Rest of Europe
Chapter 11. Asia Pacific Fortified Rice Market
- 11.1 China
- 11.2 India
- 11.3 Japan
- 11.4 South Korea
- 11.5 Thailand
- 11.6 Indonesia
- 11.7 Vietnam
- 11.8 Malaysia
- 11.9 Australia
- 11.10 Rest of Asia Pacific
Chapter 12. Latin America Fortified Rice Market
- 12.1 Brazil
- 12.2 Argentina
- 12.3 Colombia
- 12.4 Chile
- 12.5 Rest of Latin America
Chapter 13. Middle East Fortified Rice Market
- 13.1 Saudi Arabia
- 13.2 United Arab Emirates
- 13.3 Turkey
- 13.4 Israel
- 13.5 Iran
- 13.6 Rest of the Middle East
Chapter 14. Africa Fortified Rice Market
- 14.1 South Africa
- 14.2 Egypt
- 14.3 Nigeria
- 14.4 Morocco
- 14.5 Rest of Africa
Chapter 15. Fortified Rice Company Profiles
- 15.1 [Company 01]
- 15.1.1 Company Overview
- 15.1.2 Key Management Personnel
- 15.1.3 Products & Services Portfolio
- 15.1.4 Financial Performance
- 15.1.5 Key Market Focus & Geographic Presence
- 15.1.6 Recent Developments & Strategic Initiatives
Note: The company profile list is preliminary and may change based on research findings, market developments, data availability, and client requirements.
Chapter 16. Appendices
- Appendix A – List of Abbreviations & Acronyms
- Appendix B – Industry Classification Code Reference – Full Series
- Appendix C – Production & Capacity Data Tables
- Appendix D – End-Use & Demand Base Tables
- Appendix E – Consumption & Replacement Rate Assumptions
- Appendix F – ASP Reference Tables
- Appendix G – Manufacturing & Facility Database
- Appendix H – Import-Export Data Tables
- Appendix I – Regulatory Summary Tables
- Appendix J – Primary Research Participant List (Anonymized)
- Appendix K – Primary Research Questionnaire Framework
- Appendix L – Data Sources & Bibliography
- Appendix M – Market Size Divergence & Source Comparison
Chapter 17. Research Methodology
- 17.1 Research Framework & Philosophy
- 17.2 Secondary Research – Sources, Hierarchy & Data Extraction
- 17.3 Data Modeling – Bottom-Up & Top-Down Market Sizing
- 17.4 Primary Research – Stakeholder Framework, LOI & Sample Sizes
- 17.5 Forecast Methodology – Regression, Scenario & Sensitivity Analysis
- 17.6 Quality Control – Four-Layer Validation Framework
- 17.7 Limitations & Standard Assumptions
- 17.8 Disclaimer
