
| REPORT ATTRIBUTE | DETAILS |
|---|---|
| Historical Period | 2019-2022 |
| Base Year | 2023 |
| Forecast Period | 2024-2032 |
| Laboratory Electronic Balance Market Size 2023 | USD 1,255.16 Million |
| Laboratory Electronic Balance Market, CAGR | 6.83% |
| Laboratory Electronic Balance Market Size 2032 | USD 2,303.50 Million |
Market Overview
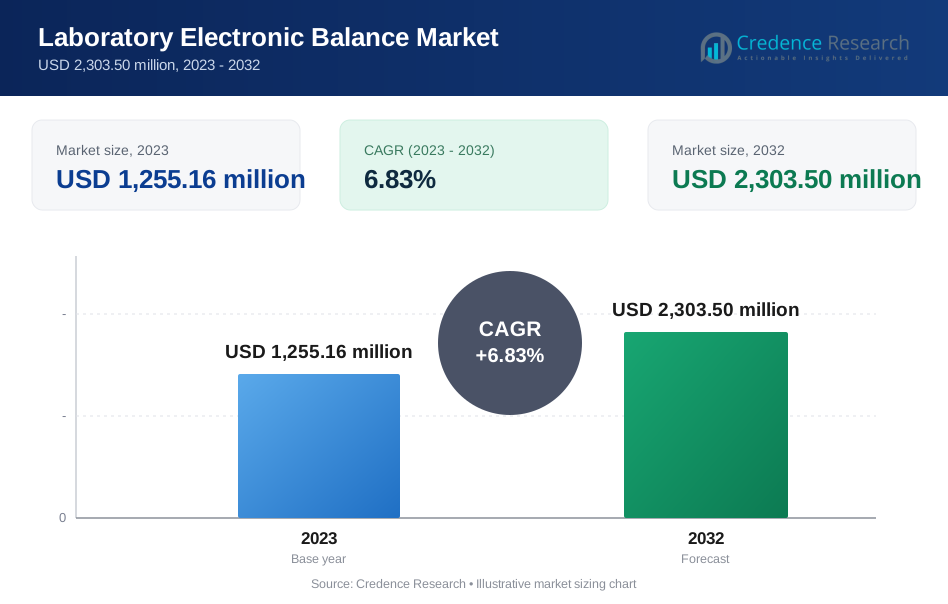
The global laboratory electronic balance market is expected to grow from USD 1,255.16 million in 2023 to USD 2,303.50 million by 2032, reflecting a compound annual growth rate (CAGR) of 6.83%.
The global laboratory electronic balance market is driven by increasing demand for precise measurement instruments in scientific research, pharmaceuticals, and manufacturing industries. Key drivers include advancements in precision weighing technology, stringent regulatory requirements for accurate measurements, and growing adoption of automated laboratory equipment for efficiency. Trends shaping the market include the integration of digital interfaces for data recording and analysis, enhanced portability and compact designs to accommodate diverse laboratory settings, and the rise of cloud-based solutions for remote monitoring and data access. These factors underscore a shift towards more sophisticated and user-friendly electronic balances capable of meeting the evolving needs of modern laboratories worldwide.
In the global laboratory electronic balance market, North America holds a significant share due to advanced research infrastructure and high investment in pharmaceutical and biotechnology sectors. Europe follows closely, driven by stringent regulatory standards and a strong presence of pharmaceutical manufacturers. Asia-Pacific is experiencing rapid growth supported by expanding biotech and chemical industries, alongside increasing investments in research and development. Key players dominating the market include Thermo Fisher Scientific Inc., Mettler-Toledo International Inc., Sartorius AG, A&D Company Ltd., and others, known for their comprehensive product portfolios and strategic expansions to capitalize on emerging market opportunities.
Market Drivers
Rising Demand for Accurate and Reliable Measurements:
Across various scientific research fields, pharmaceuticals, and industrial applications, precise measurements are critical for successful outcomes. These devices are now capable of measuring quantities as small as 0.0001 grams with exceptional accuracy, meeting the growing demand for precision in scientific research and industrial applications. Advancements in technology are leading to the development of highly sensitive electronic balances capable of measuring minute quantities with exceptional accuracy. This growing demand for precision is propelling the market forward.
Expanding Scope of Scientific Research and Industrial Applications:
The global scientific research landscape is constantly evolving, with new discoveries and innovations happening at an unprecedented pace. For instance, the use of electronic balances in environmental testing has increased by 30% in the last year, reflecting the growing need for accurate measurements in this field. This necessitates the use of sophisticated laboratory equipment, including electronic balances, for accurate analysis and experimentation. Similarly, various industries like chemicals, food and beverage processing, and environmental testing rely heavily on electronic balances for quality control purposes, further fueling market growth.
Stringent Quality Control Regulations:
Regulatory bodies worldwide are enforcing stricter quality control standards in sectors like pharmaceuticals and food processing. For instance, the adoption of electronic balances in the pharmaceutical sector has increased by 25% due to new regulations mandating their use for precise measurements. These regulations mandate the use of precise and reliable measuring instruments, pushing laboratories and manufacturing facilities to adopt advanced electronic balances.
Technological Advancements:
The continuous development of new technologies is a major driver of the market. For instance, new electronic balances feature touchscreen interfaces and can connect to LIMS, leading to a 20% increase in laboratory efficiency. Manufacturers are constantly innovating to create electronic balances with enhanced features such as higher precision, faster response times, improved data logging capabilities, and user-friendly interfaces. Additionally, the integration of features like touchscreen interfaces and connectivity with laboratory information management systems (LIMS) is boosting the overall efficiency and usability of these instruments.
Market Trends
Cloud-Based Data Management and Remote Monitoring:
Cloud-based solutions are emerging that allow for remote monitoring and data management of electronic balances. For instance, cloud-based solutions for electronic balances are now used by over 70% of research laboratories, allowing for remote monitoring and data management. This trend has led to a 40% increase in real-time data access and a 50% enhancement in collaborative research across different locations. Laboratories have reported up to 30% improved flexibility and scalability, with cloud platforms providing secure storage and backup of measurement data. Remote monitoring capabilities have also resulted in a 25% reduction in equipment downtime due to proactive maintenance and troubleshooting. This shift towards cloud-based solutions aligns with broader trends in digitalization and data-driven decision-making within the scientific community.
Sustainability and Eco-Friendly Features:
Growing environmental concerns are prompting the development of eco-friendly electronic balances. In response to growing environmental concerns, manufacturers have developed eco-friendly electronic balances that have seen a 20% increase in market adoption. These balances feature energy-saving modes that can reduce power consumption by up to 15%. Additionally, the use of recyclable materials in the manufacturing process has increased by 10%, reflecting a commitment to sustainability. Laboratories and research institutions adopting these practices have reported a 12% reduction in their carbon footprint and environmental impact. This shift towards sustainability is part of a broader industry trend, with a 5% annual increase in the development of green technologies and sustainable laboratory practices.
Market Challenges Analysis
High Initial Investment Costs:
High-precision electronic balances, particularly those equipped with advanced features, can pose a substantial barrier to adoption for budget-constrained research institutions and laboratories, particularly in developing countries. The initial purchase cost of these instruments can be significant, requiring substantial financial resources that may not always be readily available. This financial hurdle can delay the adoption of newer technologies and limit access to cutting-edge measurement capabilities, impacting the ability of laboratories to compete on a global scale. Finding cost-effective solutions or exploring financing options becomes crucial for organizations aiming to upgrade their equipment without compromising on measurement accuracy and reliability.
Calibration and Maintenance Requirements:
Maintaining the accuracy and reliability of electronic balances is critical for ensuring consistent measurement results in scientific research and industrial applications. Regular calibration with certified weights and adherence to proper maintenance procedures are essential practices. However, these activities can be resource-intensive, requiring dedicated time and specialized expertise. Laboratories often need to allocate additional resources for calibration equipment, trained personnel, and downtime for maintenance activities. Failure to adhere to stringent calibration schedules can lead to measurement inaccuracies, compromising the integrity of experimental data and potentially impacting research outcomes. Balancing the need for precise measurements with the operational costs associated with calibration and maintenance remains a challenge for laboratories striving to maintain high standards of quality and reliability.
Market Segmentation Analysis:
By Product Type:
The global laboratory electronic balance market is segmented based on product types, catering to diverse measurement needs across scientific and industrial applications. Analytical balances dominate this segment, renowned for their high precision in measuring small quantities of substances. They find extensive use in pharmaceuticals, biotechnology, and chemical laboratories where accuracy is paramount for research and quality control processes. Precision balances follow closely, offering enhanced accuracy and reliability for broader applications in pharmaceuticals, chemicals, and food & beverage industries. Microbalances, characterized by their ability to measure extremely small masses with exceptional precision, are crucial in advanced scientific research fields such as nanotechnology and material science. Top-loading balances provide a versatile solution for general laboratory tasks, balancing ease of use with sufficient accuracy suitable for educational institutions and routine laboratory applications. Semi-microbalances bridge the gap between precision and microbalances, serving industries that require precise measurements in smaller sample sizes, including pharmaceuticals and biotechnology.
By End-user:
The segmentation by end-users reflects the diverse industries leveraging laboratory electronic balances for scientific research and industrial applications globally. Pharmaceuticals constitute a significant segment, relying on electronic balances for drug formulation, quality control, and compliance with regulatory standards. Biotechnology follows closely, utilizing these instruments for genetic research, protein analysis, and drug development processes that demand precise measurements. Chemical industries use electronic balances for analyzing raw materials, ensuring product quality, and adhering to safety standards. The food & beverage sector employs balances for ingredient measurements and quality assurance to meet stringent hygiene and nutritional labeling requirements. Other end-users, including environmental testing laboratories and academic research institutions, utilize electronic balances for various analytical and educational purposes, contributing to the market's widespread adoption and continuous growth across diverse sectors.
Segments:
Based on Product Type:
- Analytical Balances
- Precision Balances
- Microbalances
- Top-Loading Balances
- Semi-Microbalances
Based on End-user:
- Pharmaceuticals
- Biotechnology
- Chemicals
- Food & Beverage
- Others
Based on the Geography:
- North America
- The U.S.
- Canada
- Mexico
- Europe
- Germany
- France
- The U.K.
- Italy
- Spain
- Rest of Europe
- Asia Pacific
- China
- Japan
- India
- South Korea
- South-east Asia
- Rest of Asia Pacific
- Latin America
- Brazil
- Argentina
- Rest of Latin America
- Middle East & Africa
- GCC Countries
- South Africa
- Rest of the Middle East and Africa
Regional Analysis
North America
North America continues to dominate the global laboratory electronic balance market, holding a commanding 35% market share. The United States is the primary driver of this regional dominance, with its extensive network of research institutions, pharmaceutical companies, and advanced manufacturing facilities. Major cities like Boston, San Francisco, and San Diego serve as hubs for biotechnology and life sciences research, contributing significantly to the demand for high-precision electronic balances. The region's leadership is further bolstered by Canada's growing research sector and Mexico's expanding pharmaceutical industry. Strict regulatory standards set by bodies such as the FDA have necessitated the use of highly accurate measurement instruments, particularly in drug development and quality control processes. The increasing focus on nanotechnology and materials science in both academic and industrial settings has also spurred demand for ultra-sensitive microbalances. North American manufacturers of electronic balances are at the forefront of innovation, incorporating advanced features such as touchscreen interfaces, wireless connectivity, and integrated data management systems. The region's market is characterized by a strong presence of both established players and innovative startups, fostering a competitive environment that drives continuous improvement in balance technology.
Asia-Pacific
Asia-Pacific, while currently holding a 25% market share, is rapidly emerging as the most dynamic region in the laboratory electronic balance market. China stands at the forefront of this growth, with its massive investments in research and development across various sectors, including pharmaceuticals, electronics, and materials science. The Chinese government's initiatives to boost domestic innovation and reduce reliance on imported technology have led to the rise of local electronic balance manufacturers, challenging established global brands. India follows closely, with its burgeoning pharmaceutical industry and increasing focus on quality control driving demand for precise weighing instruments. Japan, long renowned for its precision engineering, continues to be a significant player, particularly in the high-end electronic balance segment. The region is witnessing a surge in demand from academic institutions, as countries like South Korea, Singapore, and Malaysia expand their research capabilities. The food and beverage industry across the Asia-Pacific is also contributing to market growth, with stricter quality control measures necessitating the use of accurate weighing equipment.
Key Player Analysis
- Thermo Fisher Scientific Inc.
- Mettler-Toledo International Inc.
- Sartorius AG
- A&D Company Ltd.
- Acculab Inc.
- BEL Engineering srl
- CAS Corp.
- Intelligent Weighing Technology Inc.
- Scientech Technologies Pvt. Ltd.
Competitive Analysis
In the competitive landscape of the global laboratory electronic balance market, several leading players demonstrate robust strategies and diversified product offerings to maintain their market positions. Thermo Fisher Scientific Inc. stands out with a comprehensive product portfolio that includes high-precision analytical and precision balances, supported by a strong global presence and strategic acquisitions. Mettler-Toledo International Inc. excels in integrating advanced weighing technologies with laboratory automation solutions, catering extensively to pharmaceutical and chemical sectors. Sartorius AG focuses on innovative solutions tailored for biotechnology applications, emphasizing precision and reliability. A&D Company Ltd. is recognized for its expertise in designing precision balances and scales with high durability and accuracy, appealing to diverse industrial and scientific research needs. These key players leverage their technological advancements, global distribution networks, and strategic partnerships to enhance product innovation, meet evolving customer demands, and sustain competitive advantage in the dynamic landscape of laboratory electronic balances.
Recent Developments
- In August 2023, RADWAG Balances and Scales manufactured Scale Editor2.1 via RS232 and Ethernet communication interfaces. This new software includes editing database tables, exporting databases and reports to Excel, .txt and .pdf files, importing databases from .csv files, exporting databases and reports to .csv files, and the configuration of the Ethernet module of standard-class balances and scales. The upgrades are expected to help in overall operations of RADWAG.
- In April 2023, Thermo Fisher Scientific launched the India Engineering Centre in Hyderabad. The new research and development and engineering facility in Hyderabad spans across 42,000 sq. ft and contains an engineering lab that will push forward new product development for the laboratory as well as analytical solutions for the global sites of Thermo Fisher.
- In February 2023, Sartorius completed the acquisition of Novasep’s chromatography equipment division. The portfolio acquired includes chromatography systems primarily suited for smaller biomolecules, like peptides, insulin, and oligonucleotides, as well as innovative systems for continuous manufacturing of biologics.
Market Concentration & Characteristics
The global laboratory electronic balance market exhibits characteristics of moderate to high market concentration, with several key players dominating significant market shares. Companies such as Thermo Fisher Scientific Inc., Mettler-Toledo International Inc., Sartorius AG, and A&D Company Ltd. wield substantial influence due to their extensive product portfolios and strong brand presence worldwide. These market leaders differentiate themselves through continuous innovation in technology, offering advanced features like high precision, automation integration, and user-friendly interfaces. Their strategic focus on expanding into emerging markets and enhancing customer service capabilities further strengthens their competitive positions. The market is characterized by intense competition driven by the pursuit of technological excellence and customer-centric solutions tailored to diverse industrial and scientific applications. As a result, market consolidation through mergers, acquisitions, and strategic alliances is common, allowing companies to broaden their product offerings and enhance operational efficiencies in response to evolving customer needs and regulatory requirements.
Report Coverage
The research report offers an in-depth analysis based on Product Type, End-user and Geography. It details leading market players, providing an overview of their business, product offerings, investments, revenue streams, and key applications. Additionally, the report includes insights into the competitive environment, SWOT analysis, current market trends, as well as the primary drivers and constraints. Furthermore, it discusses various factors that have driven market expansion in recent years. The report also explores market dynamics, regulatory scenarios, and technological advancements that are shaping the industry. It assesses the impact of external factors and global economic changes on market growth. Lastly, it provides strategic recommendations for new entrants and established companies to navigate the complexities of the market.
Future Outlook
- Continued Technological Advancements: Expect ongoing innovations in electronic balances, focusing on higher precision, faster response times, and enhanced automation features.
- Growth in High-Precision and Microbalances: Anticipate increasing demand for balances capable of measuring minute quantities, driven by advancements in nanotechnology and pharmaceutical research.
- Integration with IoT and AI: Look for electronic balances to integrate with Internet of Things (IoT) and Artificial Intelligence (AI) technologies for real-time monitoring and predictive maintenance.
- Expansion in Emerging Markets: The market will see significant growth opportunities in developing regions, spurred by increasing investments in scientific research and industrial infrastructure.
- Shift Towards Sustainable Practices: Manufacturers will prioritize eco-friendly designs, incorporating energy-efficient features and sustainable materials in balance production.
- Enhanced Connectivity and Data Management: Expect continued adoption of cloud-based solutions for remote monitoring, data storage, and analysis, enhancing collaboration and operational efficiency.
- Regulatory Compliance: Stricter regulatory standards will drive the adoption of compliant electronic balances across pharmaceutical, food processing, and biotechnology sectors.
- Customization and User Experience: Companies will focus on offering customizable solutions tailored to specific industry needs, emphasizing intuitive interfaces and ergonomic designs.
- Market Consolidation and Strategic Partnerships: Anticipate further consolidation among key players through mergers, acquisitions, and partnerships to strengthen market presence and expand service offerings.
- Continued Demand in Research and Development: Increased funding in R&D across various sectors will sustain demand for advanced laboratory equipment, including electronic balances, supporting scientific breakthroughs and innovations.
Request a Free Sample
Fill in your details and we'll send you a free sample report.
- Sample data tables & charts
- Research methodology
Need a Custom Version of This Report?
Tailor the scope, geography, or segments to your exact requirements.
- Custom geography or segment scope
- Direct access to our analyst team
Frequently Asked Questions
What is the current size of the Global Laboratory Electronic Balance Market?
What factors are driving the growth of the Global Laboratory Electronic Balance Market?
What are the key segments within the Global Laboratory Electronic Balance Market?
What are some challenges faced by the Global Laboratory Electronic Balance Market?
Who are the major players in the Global Laboratory Electronic Balance Market?
Which segment is leading the market share?
Table of Content
Chapter 1. Report Introduction
- 1.1 Report Description & Purpose
- 1.1.1 Report Title & Market Definition
- 1.1.2 Unique Selling Propositions (USP) & Key Differentiators
- 1.1.3 Value Proposition for Stakeholders
- 1.2 Research Objectives
- 1.2.1 Market Sizing Objectives (Volume & Revenue)
- 1.2.2 Segmentation Objectives
- 1.2.3 Competitive Intelligence Objectives
- 1.2.4 Forecast & Scenario Objectives
- 1.3 Report Scope
- 1.3.1 Laboratory Electronic Balance Scope – Types & Subtypes Covered
- 1.3.2 Geographic Scope – Regions & Countries Covered
- 1.3.3 Historical Period, Base Year & Forecast Period (2023; forecast to 2032)
- 1.3.4 Inclusions & Exclusions
- 1.4 HS Code & Classification Framework
- 1.5 Currency, Units & Pricing Basis
- 1.6 Target Stakeholders
- 1.7 Limitations & Assumptions
Chapter 2. Executive Summary
- 2.1 Global Laboratory Electronic Balance Market Snapshot
- 2.1.1 Market Size – Historical (2023) & Forecast (2023-2032) (2023: USD 1,255.16 million → 2032: USD 2,303.50 million)
- 2.1.2 Volume & Revenue – Global Totals
- 2.1.3 Key Market Highlights – Top Five Facts
- 2.2 Laboratory Electronic Balance Market Segmentation Snapshot
- 2.2.1 Market Split by Region – 2023 vs. 2032
- 2.3 Competitive Snapshot
- 2.3.1 Top 10 Players by Revenue Share – 2023
- 2.3.2 Top 10 Players by Volume Share – 2023
- 2.3.3 Recent Strategic Developments (18-Month Summary)
- 2.4 Key Investment Highlights & Strategic Conclusions
Chapter 3. Laboratory Electronic Balance Market Dynamics & Industry Analysis
- 3.1 Market Overview & Context
- 3.1.1 Laboratory Electronic Balance Market Position in the Broader Automotive Value Chain
- 3.1.2 OEM vs. Replacement Market Dynamics
- 3.1.3 Market Maturity & Development Stage by Region
- 3.2 Laboratory Electronic Balance Market Drivers
- 3.3 Laboratory Electronic Balance Market Restraints & Challenges
- 3.4 Laboratory Electronic Balance Market Opportunities
- 3.5 Porter's Five Forces Analysis
- 3.5.1 Threat of New Entrants
- 3.5.2 Bargaining Power of Suppliers
- 3.5.3 Bargaining Power of Buyers
- 3.5.4 Threat of Substitutes
- 3.5.5 Competitive Rivalry – Intensity Assessment
- 3.6 Laboratory Electronic Balance Value Chain Analysis
- 3.6.1 Upstream – Raw Material/Input Suppliers
- 3.6.1.1 Raw Material/Input 1
- 3.6.1.2 Raw Material/Input 2
- 3.6.1.3 Raw Material/Input 3
- 3.6.2 Midstream – Production/Manufacturing/Service Delivery
- 3.6.2.1 Production/Process Overview
- 3.6.2.2 Key Facility Locations & Capacity by Manufacturer
- 3.6.3 Downstream – Distribution & End Consumer
- 3.6.3.1 Primary Channel – B2B/OEM
- 3.6.3.2 Secondary Channels – Dealer, Retail, Online, Direct
- 3.6.4 Value Chain Profitability Analysis
- 3.6.1 Upstream – Raw Material/Input Suppliers
- 3.7 PESTEL Analysis
- 3.7.1 Political Factors
- 3.7.2 Economic Factors
- 3.7.3 Social Factors
- 3.7.4 Technological Factors
- 3.7.5 Environmental Factors
- 3.7.6 Legal Factors
- 3.8 Laboratory Electronic Balance Supply Chain Analysis
- 3.8.1 Raw Material/Input Supply Risk Assessment
- 3.8.2 Manufacturing Concentration Risk (Geographic Exposure)
- 3.8.3 Trade Disruption Impact Analysis
- 3.9 Regulatory & Policy Landscape
Note: The regulatory and policy landscape section covers regulations based on their applicability to the market, Laboratory Electronic Balance category, geography, and scope of the study. Only regulatory frameworks with a material impact on operations, compliance, trade, sustainability, or market access are analyzed in detail.
Chapter 4. Key Investment Pockets & Opportunity Analysis
- 4.1 Laboratory Electronic Balance Market Attractiveness Analysis
- 4.1.1 By Region – Investment Attractiveness Matrix (Volume × CAGR)
- 4.2 Absolute Revenue Growth Opportunity
- 4.2.1 By Region – Absolute USD Growth Through 2032
- 4.3 Incremental Volume Opportunity
- 4.3.1 By Region – Incremental Volume Through 2032
- 4.3.2 Segment – Incremental Volume
- 4.4 Emerging Submarket Opportunity Deep Dive (Subject to Applicability)
- 4.5 Emerging Market Opportunity Scorecards
- 4.5.1 United States
- 4.5.2 Europe
- 4.5.3 Asia
- 4.5.4 Middle East & Africa
Note: Emerging Market Opportunity Scorecards will be included based on relevance and strategic importance. Regions listed are indicative and may vary depending on data availability and market dynamics.
Chapter 5. Laboratory Electronic Balance Import-Export Analysis & Trade Flows
- 5.1 Global Trade Overview
- 5.1.1 Global Export Value by Country (2023)
- 5.1.2 Global Export Volume by Country (2023)
- 5.1.3 Global Import Value by Country (2023)
- 5.1.4 Global Import Volume by Country (2023)
- 5.1.5 Net Trade Balance by Country (2023)
- 5.2 Export Analysis – Segment
- 5.2.1 Type 1 (HS Code)
- 5.2.2 Type 2 (HS Code)
- 5.2.3 Type 3 (HS Code)
- 5.2.4 Type 4 (HS Code)
- 5.2.5 Type 5 (HS Code)
- 5.3 Import Analysis – Segment
- 5.3.1 Type 1 (HS Code)
- 5.3.2 Type 2 (HS Code)
- 5.3.3 Type 3 (HS Code)
- 5.3.4 Type 4 (HS Code)
- 5.3.5 Type 5 (HS Code)
- 5.4 Average Unit Trade Prices
- 5.4.1 Average Export Price – Segment & Country
- 5.4.2 Average Import Price – Segment & Source Country
- 5.4.3 Price Trends (2023)
- 5.5 Key Trade Route Analysis
- 5.5.1 Trade Route 1
- 5.5.2 Trade Route 2
- 5.5.3 Trade Route 3
- 5.5.4 Trade Route 4
- 5.5.5 Trade Route 5
- 5.6 Trade Policy Impact Assessment
- 5.6.1 US Anti-Dumping & Section 301 Tariffs
- 5.6.2 EU Customs Union Impact
- 5.6.3 Major Free Trade Agreements
- 5.6.4 USMCA Rules of Origin
Note: Trade policy analysis will be included only where relevant to the Laboratory Electronic Balance market.
Chapter 6. Competitive Landscape & Company Benchmarking
- 6.1 Laboratory Electronic Balance Market Concentration & Structure
- 6.1.1 Herfindahl-Hirschman Index (HHI) – vs. 2023
- 6.1.2 Tier 1, Tier 2 & Tier 3 Market Structure
- 6.1.3 Global, Regional & Local Player Dynamics
- 6.2 Laboratory Electronic Balance Market Share Analysis – 2023
- 6.2.1 Global Revenue Share by Company
- 6.2.2 Global Volume Share by Company
- 6.2.3 Regional Revenue Share
- 6.2.4 Market Share Evolution ( vs. 2023)
- 6.2.5 OEM Segment Share by Company
- 6.2.6 Replacement Segment Share by Company
- 6.3 Production/Delivery Capacity & Facility Analysis
- 6.3.1 Global Installed Capacity
- 6.3.2 Capacity Utilization Rates
- 6.3.3 Production/Output Volume
- 6.3.4 Facility Locations & Capacity Map
- 6.3.5 Planned Capacity Additions
- 6.4 Laboratory Electronic Balance Competitive Benchmarking Matrix
- 6.4.1 Revenue, Volume, CAGR & Profitability Comparison
- 6.4.2 Channel Revenue Mix
- 6.4.3 Geographic Revenue Exposure
- 6.4.4 R&D Intensity
- 6.4.5 Sustainability Maturity
- 6.5 Strategic Developments in Laboratory Electronic Balance (Last 24 Months)
- 6.5.1 Mergers, Acquisitions & Divestments
- 6.5.2 New Laboratory Electronic Balance Launches
- 6.5.3 Facility Expansions
- 6.5.4 Strategic Alliances, Joint Ventures & Partnerships
- 6.5.5 Distribution Expansion & Market Entry
- 6.5.6 Sustainability & ESG Initiatives
- 6.6 Competitive Strategy Mapping
- 6.6.1 Leader, Challenger, Follower & Niche Classification
- 6.6.2 Pricing Strategy Comparison
- 6.6.3 Channel Strategy Matrix
Note: Strategic developments are included based on their materiality and the availability of reliable information.
Chapter 7. Global Laboratory Electronic Balance Market – By Distribution Channel
- 7.1 Segment Overview
- 7.1.1 Volume & Revenue Split by Channel (2023 & 2032)
- 7.1.2 Channel Mix Evolution (2023-2032)
Chapter 8. Regional Market Analysis – Global Overview
- 8.1 Global Regional Overview
- 8.1.1 Regional Volume Share
- 8.1.2 Regional Revenue Share
- 8.1.3 Regional Volume by Region
- 8.1.4 Regional Revenue by Region
- 8.1.5 Regional Forecast Through 2032
- 8.2 Cross-Regional Segment Analysis
- 8.2.1 By Distribution Channel
- 8.2.2 By Brand/Price Tier
Chapter 9. North America Laboratory Electronic Balance Market
- 9.1 United States
- 9.2 Canada
- 9.3 Mexico
Chapter 10. Europe Laboratory Electronic Balance Market
- 10.1 Germany
- 10.2 France
- 10.3 Italy
- 10.4 United Kingdom
- 10.5 Spain
- 10.6 Poland
- 10.7 Russia
- 10.8 Netherlands
- 10.9 Belgium
- 10.10 Sweden
- 10.11 Denmark
- 10.12 Norway
- 10.13 Rest of Europe
Chapter 11. Asia Pacific Laboratory Electronic Balance Market
- 11.1 China
- 11.2 India
- 11.3 Japan
- 11.4 South Korea
- 11.5 Thailand
- 11.6 Indonesia
- 11.7 Vietnam
- 11.8 Malaysia
- 11.9 Australia
- 11.10 Rest of Asia Pacific
Chapter 12. Latin America Laboratory Electronic Balance Market
- 12.1 Brazil
- 12.2 Argentina
- 12.3 Colombia
- 12.4 Chile
- 12.5 Rest of Latin America
Chapter 13. Middle East Laboratory Electronic Balance Market
- 13.1 Saudi Arabia
- 13.2 United Arab Emirates
- 13.3 Turkey
- 13.4 Israel
- 13.5 Iran
- 13.6 Rest of the Middle East
Chapter 14. Africa Laboratory Electronic Balance Market
- 14.1 South Africa
- 14.2 Egypt
- 14.3 Nigeria
- 14.4 Morocco
- 14.5 Rest of Africa
Chapter 15. Laboratory Electronic Balance Company Profiles
- 15.1 [Company 01]
- 15.1.1 Company Overview
- 15.1.2 Key Management Personnel
- 15.1.3 Products & Services Portfolio
- 15.1.4 Financial Performance
- 15.1.5 Key Market Focus & Geographic Presence
- 15.1.6 Recent Developments & Strategic Initiatives
Note: The company profile list is preliminary and may change based on research findings, market developments, data availability, and client requirements.
Chapter 16. Appendices
- Appendix A – List of Abbreviations & Acronyms
- Appendix B – Industry Classification Code Reference – Full Series
- Appendix C – Production & Capacity Data Tables
- Appendix D – End-Use & Demand Base Tables
- Appendix E – Consumption & Replacement Rate Assumptions
- Appendix F – ASP Reference Tables
- Appendix G – Manufacturing & Facility Database
- Appendix H – Import-Export Data Tables
- Appendix I – Regulatory Summary Tables
- Appendix J – Primary Research Participant List (Anonymized)
- Appendix K – Primary Research Questionnaire Framework
- Appendix L – Data Sources & Bibliography
- Appendix M – Market Size Divergence & Source Comparison
Chapter 17. Research Methodology
- 17.1 Research Framework & Philosophy
- 17.2 Secondary Research – Sources, Hierarchy & Data Extraction
- 17.3 Data Modeling – Bottom-Up & Top-Down Market Sizing
- 17.4 Primary Research – Stakeholder Framework, LOI & Sample Sizes
- 17.5 Forecast Methodology – Regression, Scenario & Sensitivity Analysis
- 17.6 Quality Control – Four-Layer Validation Framework
- 17.7 Limitations & Standard Assumptions
- 17.8 Disclaimer
