
Research labs anchor demand as factories start buying
The North America terahertz technology market was valued at USD 256.5 million in 2025 and is projected to increase from USD 298.9 million in 2026 to USD 1.19 billion by 2035, registering a CAGR of 16.57% during 2026–2035. Demand comes from university and federal laboratories, from coating and roofing plants that gauge layers without contact, and from 6G groups testing above 100 GHz. The United States held the largest share, 87.5% in 2025, because Charlottesville, Roanoke, Boston and San Jose host much of the regional supply base. Mexico is the fastest-growing country at 17.85% a year, helped by a vehicle export industry that INEGI counted at 3,385,785 light vehicles in 2025. A commercial change arrived on Nov. 12, 2025, when Boston-based Teradar disclosed USD 150 million in Series B funding for a vehicle sensor. Federal rules still frame the band, since the FCC offers ten-year experimental licenses from 95 GHz to 3 THz, and those licenses cannot be renewed.
What does terahertz technology spending cover in this region?
The terahertz technology estimate counts imaging systems, spectroscopy systems, communication systems and standalone components sold to buyers in the United States, Canada and Mexico. Purchases arrive as equipment orders, engineered project contracts and recurring service contracts, and most laboratory orders are tied to a grant or a program budget.
The estimate excludes general microwave instruments that stop below the terahertz range, and it excludes checkpoint X-ray and computed tomography equipment. The value chain runs from diodes, photoconductive antennas and detectors through instruments and gauges to integrators that install them on production lines.
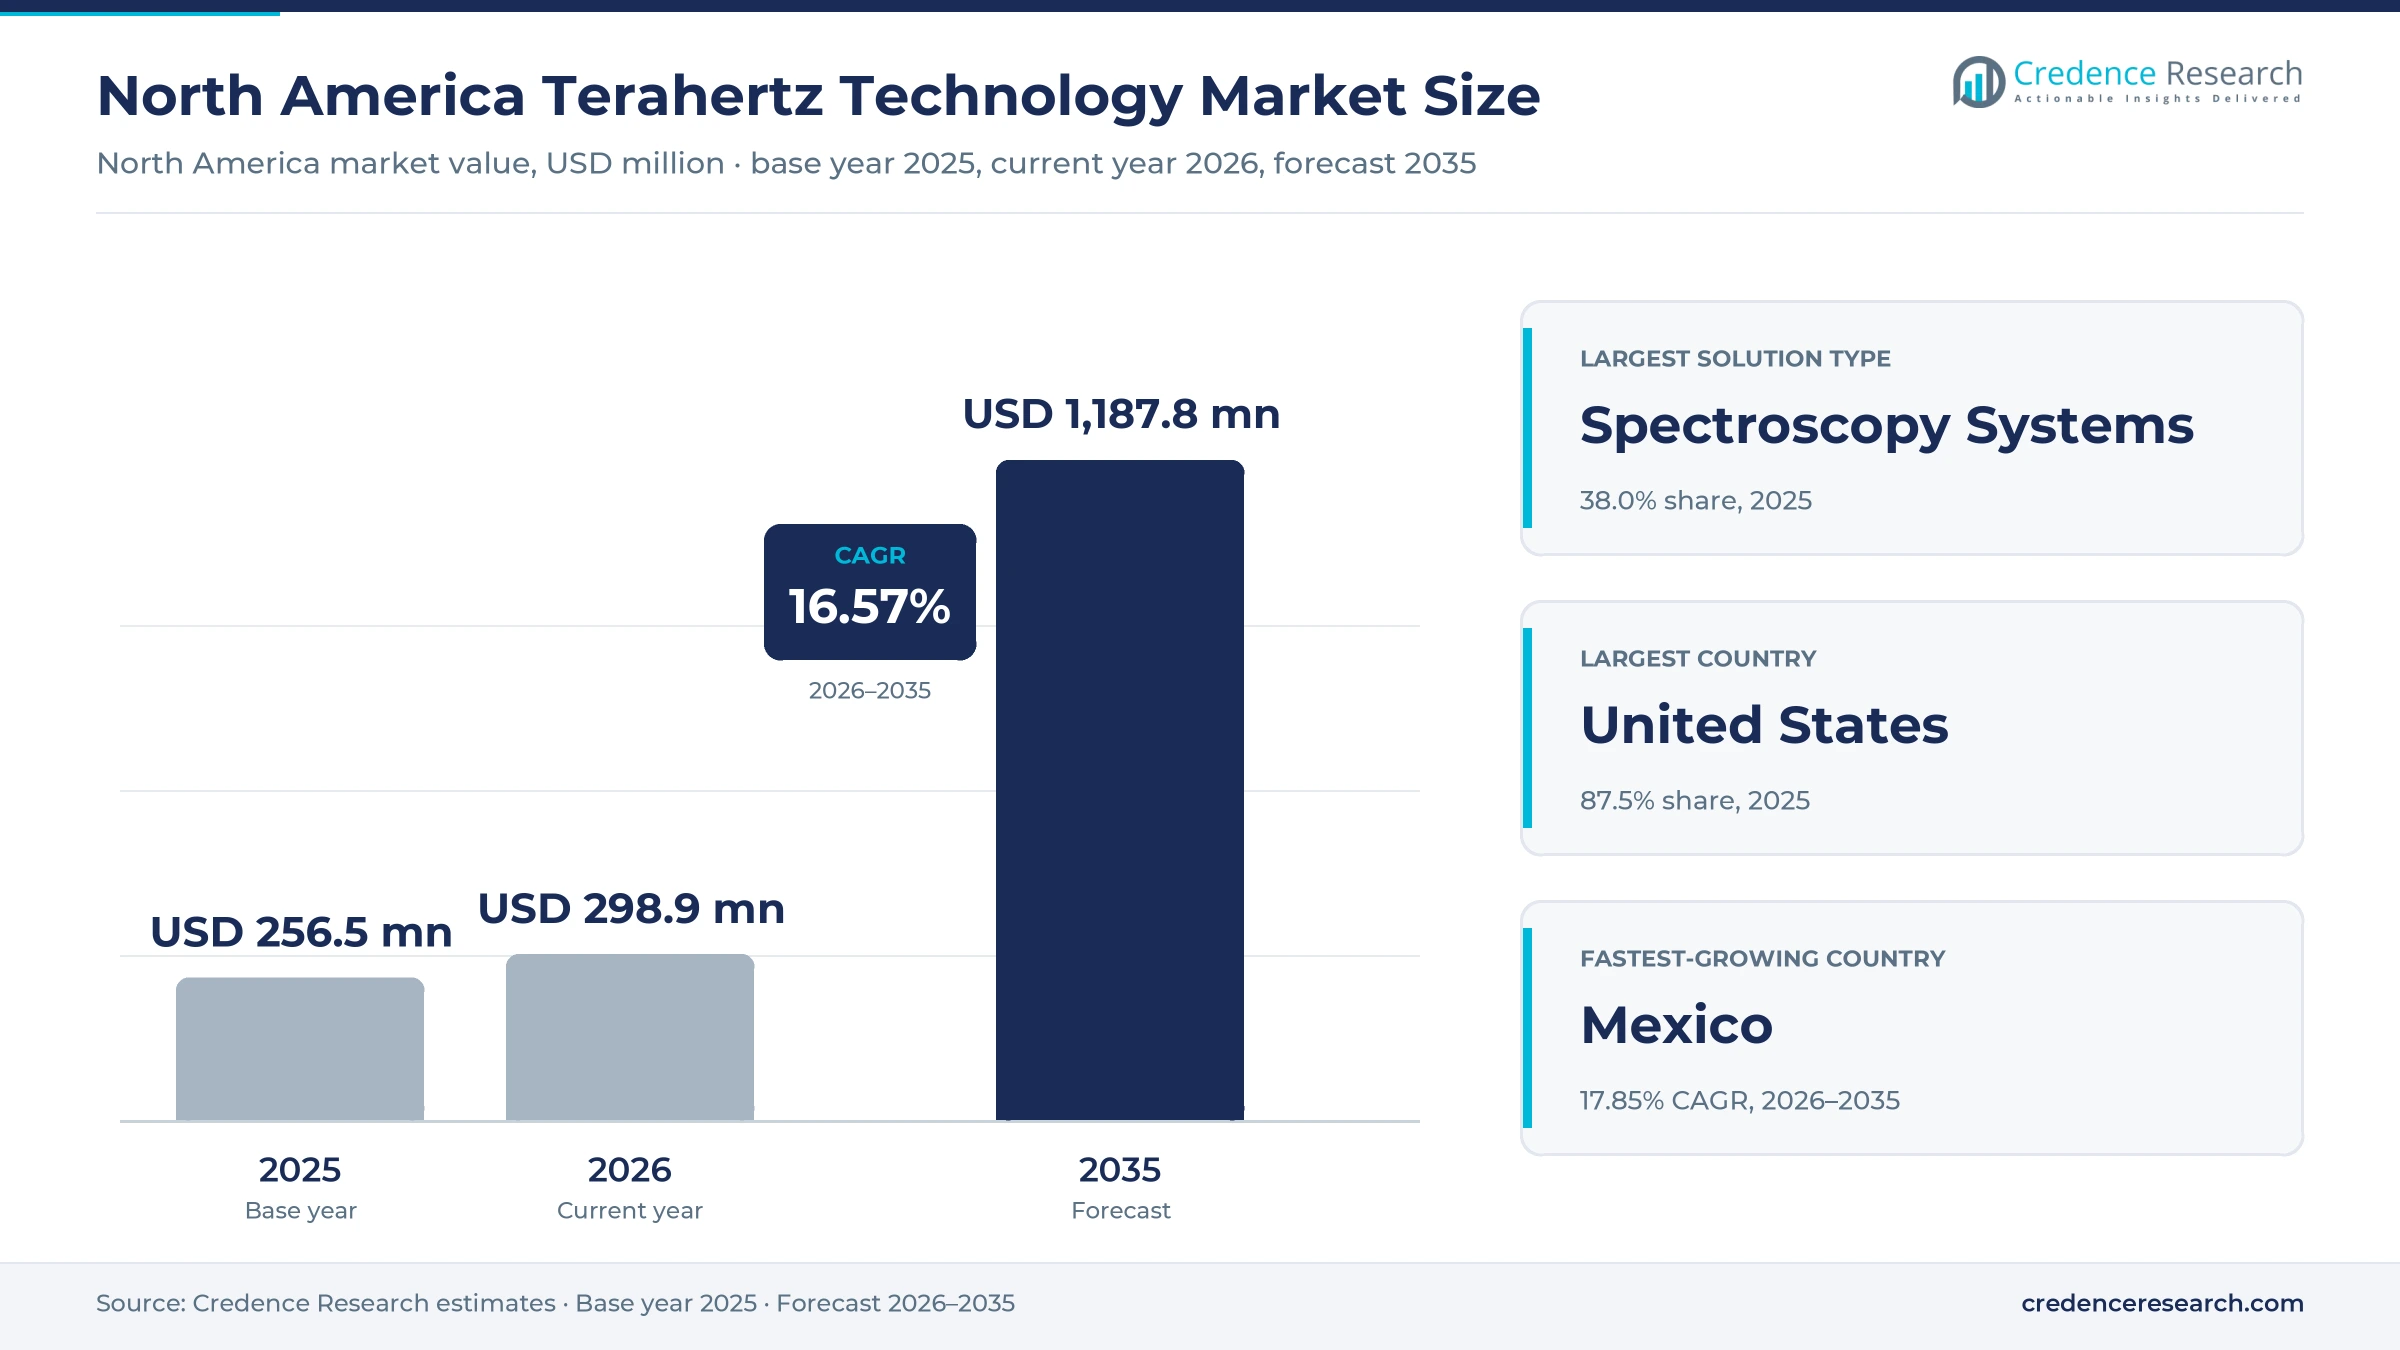
North America Terahertz Technology Market Insights
- The market grows from USD 256.5 million in 2025 to USD 1.19 billion by 2035, a 16.57% CAGR over 2026–2035, as orders widen from laboratories toward factories and radio testbeds.
- The United States held 87.5% of regional value in 2025, supported by domestic suppliers and federal programs at the National Science Foundation, NIH and TSA.
- Spectroscopy Systems led solution types with 38.0% of 2025 value, because laboratories buy broadband time-domain instruments before they buy any dedicated imaging or radio equipment.
- PCI Magazine reported on April 7, 2025, that a robotic terahertz paint cell was installed at a Ford plant in Kentucky, an early sign of line-side buying.
- Teradar disclosed USD 150 million in Series B funding on Nov. 12, 2025, bringing venture money and Lockheed Martin Ventures into a field long funded mainly by grants.
Spectroscopy leads while communication systems scale
Why do spectroscopy systems lead solution type spending?
Based on solution type, the market is categorized into imaging systems, spectroscopy systems, communication systems and standalone components. Spectroscopy Systems led with 38.0% of 2025 value because university and government laboratories buy broadband time-domain instruments first. Photonics Media reported in December 2023 that the TOPTICA TeraFlash Pro reaches 6 THz bandwidth with peak dynamic range above 100 dB, which covers most materials work on one bench. Communication systems grow fastest at 18.94% a year as sub-terahertz radios move into funded testbeds, including the USD 1.3 million National Science Foundation award announced by the University at Albany on June 9, 2026.
How quickly are inline installations gaining on benchtop instruments?
Based on deployment model, the market is categorized into benchtop instruments, inline installations and portable platforms. Benchtop Instruments led with 58.0% of 2025 value because most buyers still characterize samples away from the line. TeraLab at Centro de Investigaciones en Óptica in León, for example, lists a fiber-coupled Menlo Systems Tera K-15 spectrometer and measures dielectric spectra from 20 GHz to 3.5 THz. Inline installations grow fastest at 18.13% a year as factories automate gauging, and PCI Magazine described a TeraView and Indicon robot cell in April 2025 that reads up to 90 critical vehicle-body points.
Which end-use industry buys the most terahertz equipment today?
Based on end-use industry, the market is categorized into defense and security, healthcare and life sciences, industrial and food production, and academic and telecommunications research. Academic and Telecommunications Research led with 36.0% of 2025 value because federal grants fund first purchases, such as the USD 3 million National Science Foundation instrumentation award that NYU reported in August 2022 for sub-THz and THz bands. Industrial and food production grows fastest at 17.79% a year as gauges move from laboratories into plants. Luna Innovations specifies TeraMetrix gauging of TPO roofing top layers to within 0.25 mils, which gives producers a usable control signal.
Why does materials characterization remain the largest application?
Based on application, the market is categorized into concealed threat detection, process quality control, materials characterization and communication testing. Materials Characterization led with 40.0% of 2025 value because laboratories apply one instrument across many material classes, and the 2025 Gentec-EO product guide lists pyroelectric detectors spanning 0.1 to 30 THz for such setups. Communication testing grows fastest at 18.34% a year as 6G groups need instruments above common limits. Microwave Journal reported in June 2023 that Virginia Diodes extenders lift test sets that stop at 67 to 110 GHz up to 1.5 THz, with spending surging from 100 to 300 GHz.
| Segment Group | Leading Sub-segment | Share, 2025 | Fastest-growing Sub-segment | CAGR, 2026–2035 |
|---|---|---|---|---|
| By Solution Type | Spectroscopy Systems | 38.0% | Communication Systems | 18.94% |
| By Deployment Model | Benchtop Instruments | 58.0% | Inline Installations | 18.13% |
| By End-Use Industry | Academic and Telecommunications Research | 36.0% | Industrial and Food Production | 17.79% |
| By Application | Materials Characterization | 40.0% | Communication Testing | 18.34% |
Request a Free Sample
Fill in your details and we'll send you a free sample report.
- Sample data tables & charts
- Research methodology
Inline gauges, drug science and 6G grants lift orders
Industrial thickness and process measurement moves to the line
Plants are buying terahertz gauges because the method reads each coating layer without contact or ionizing radiation. PCI Magazine reported on April 7, 2025, that a TeraView and Indicon robot cell had been installed at a Ford plant in Kentucky, with multilayer tolerances approaching 1 micron. This matters to buyers of automotive coatings, because the cell replaces manual sampling at up to 90 points on a vehicle body. Luna Innovations lists online gauging for continuous manufacturing as well, and it specifies handheld airframe coating measurement at plus or minus 0.15 mils. As a result, inline installations post a CAGR of 18.13%, faster than any other deployment model in the estimate.
Pharmaceutical process characterization gains regulatory footing
Drug makers value terahertz imaging because it links coating structure to dissolution without a wet test. Outsourcing-Pharma reported that an FDA study of Asacol delayed-release tablets found mean dissolution times correlated with average coating thickness, and the agency called the method an attractive replacement for wet testing in development. That same report quoted TeraView naming GlaxoSmithKline, Pfizer, AstraZeneca and Takeda as users. The FDA then finalized its Advanced Manufacturing Technologies Designation Program guidance in December 2024, which encourages early adoption of methods that improve process reliability. This policy supports process spectroscopy and related analytical tools inside drug plants. NIH also funded Bridge12 Technologies with USD 1,388,081 in fiscal 2022 for a 395 GHz gyrotron amplifier aimed at spectroscopy.
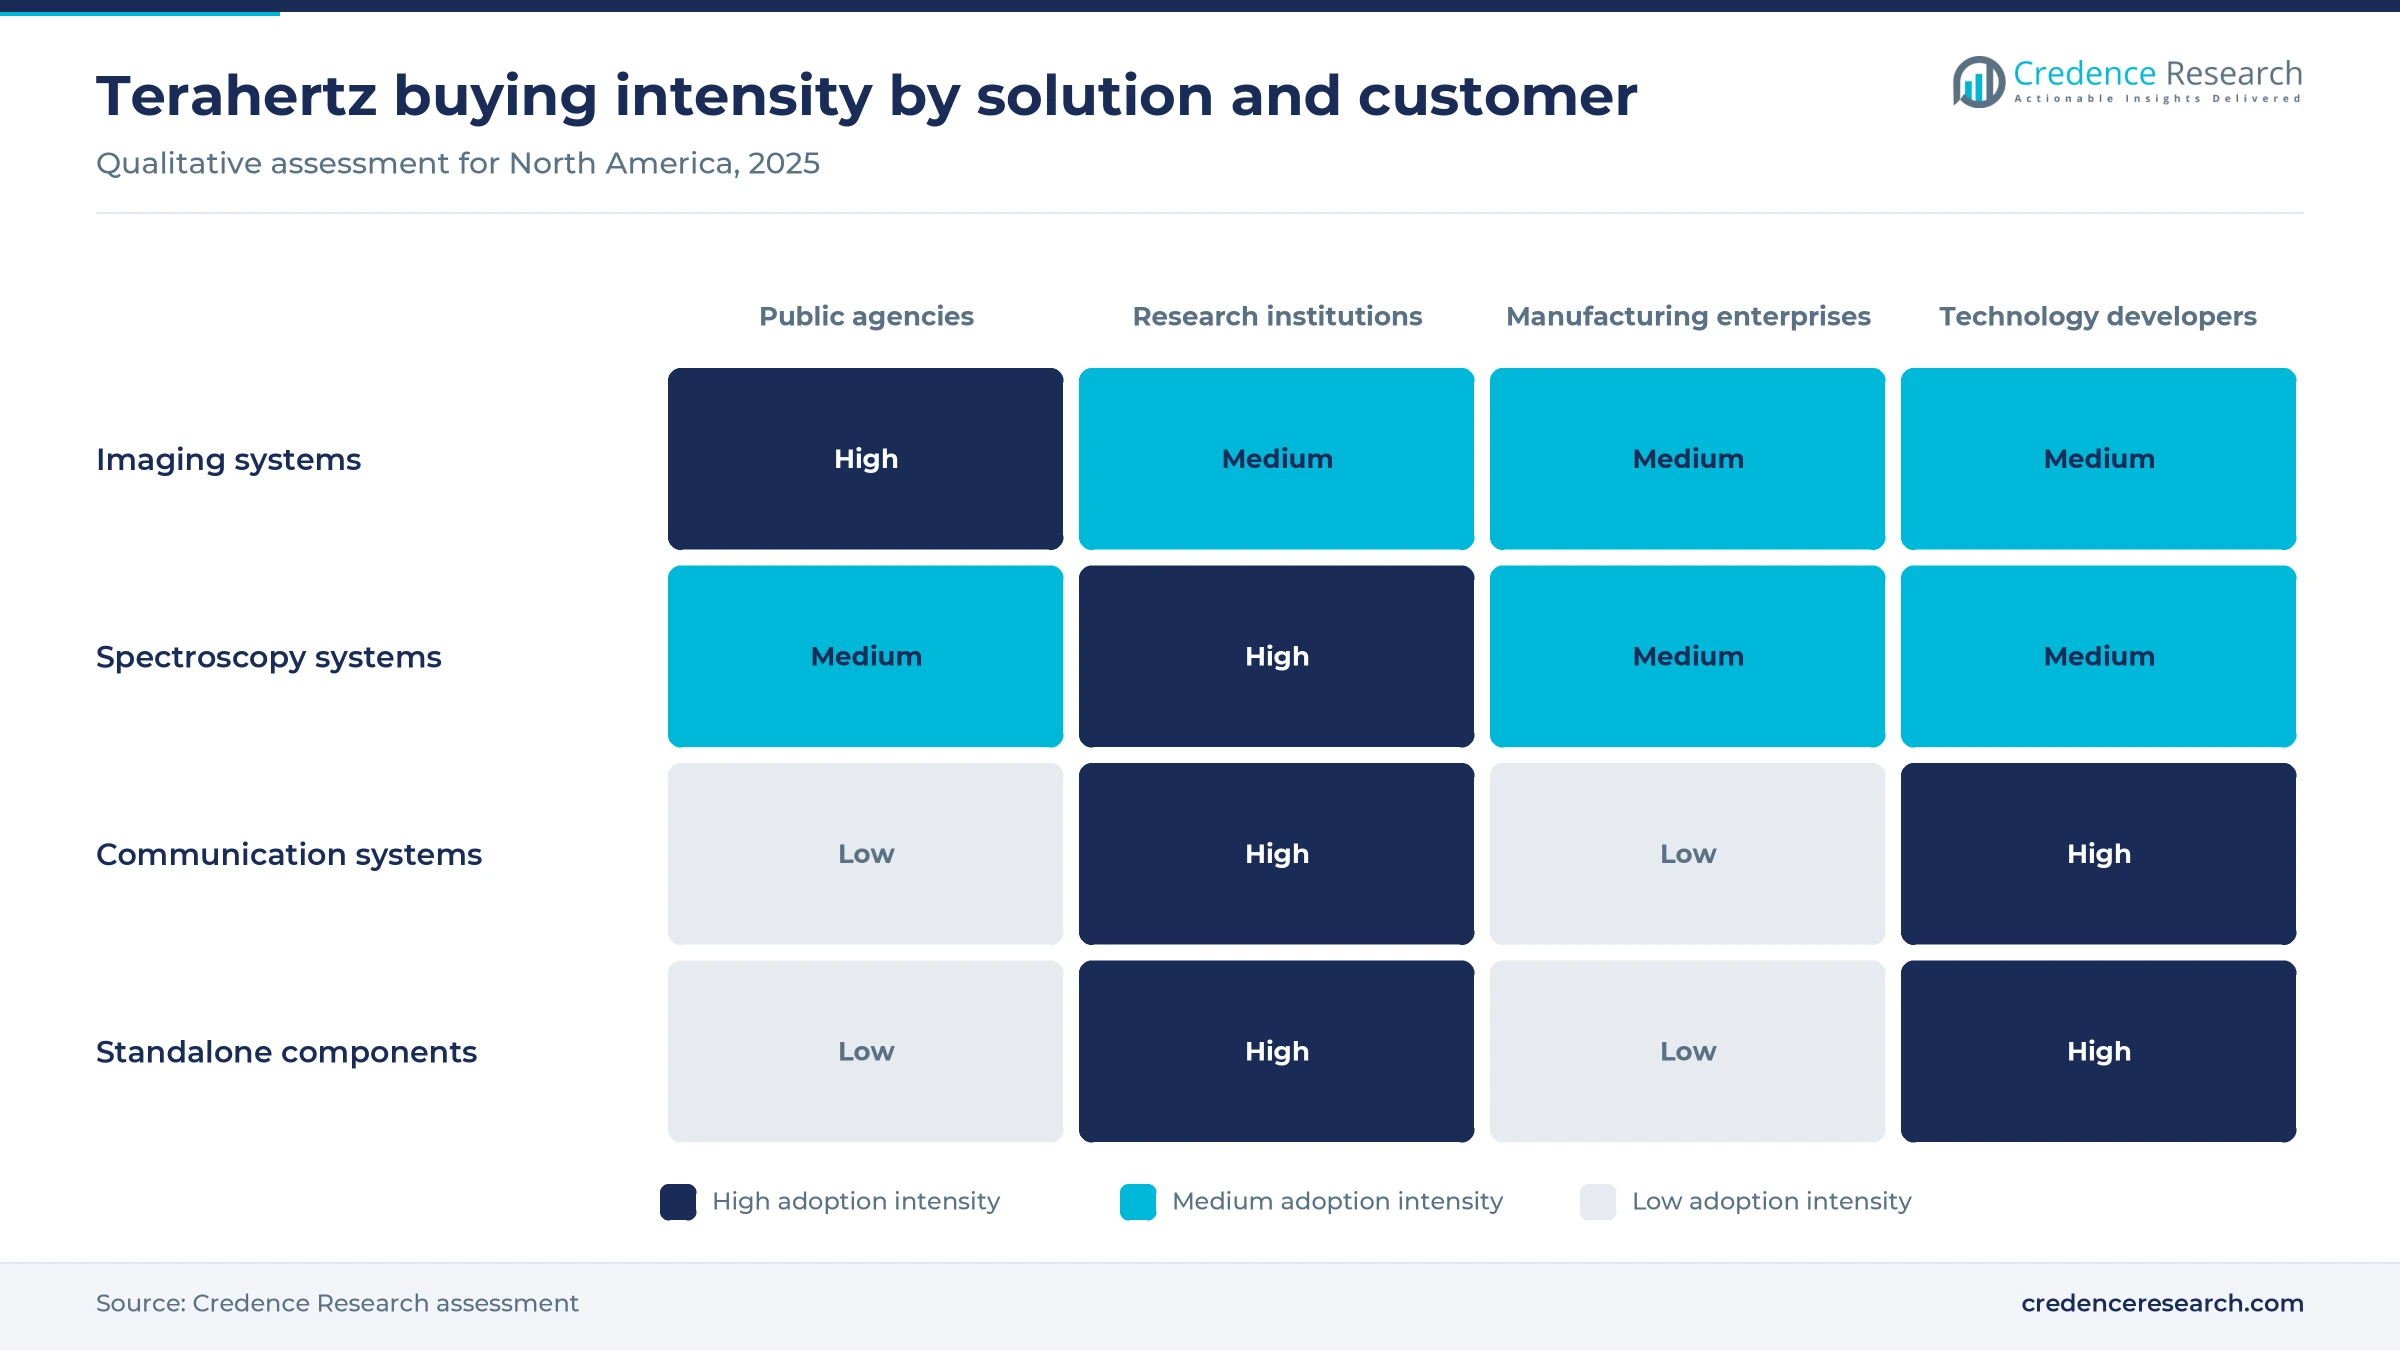
Communication testbeds convert research grants into orders
Radio research turns grants into instrument orders because sub-terahertz experiments cannot run on standard test sets. The FCC created the framework through Spectrum Horizons rules published June 4, 2019, which opened experimental licensing from 95 GHz to 3 THz and 21.2 gigahertz of unlicensed spectrum. Keysight Technologies announced the first such license on March 8, 2022, for 6G development. Grants then pay for hardware, as shown by the USD 1.3 million National Science Foundation award to the University at Albany in June 2026 and a USD 175,000 award to SUNY Poly in August 2025. Virginia Diodes documents a Keysight test bed using its D-band and G-band converters at about 10 GHz of occupied bandwidth, so each funded laboratory becomes a likely buyer.
Federal screening and defense programs keep threat research funded
Concealed threat detection stays relevant because federal screening volumes are large and detection research is funded directly. According to TSA testimony of May 15, 2024, the agency screened more than 858 million passengers in fiscal 2023 and operated nearly 1,000 advanced imaging units. That same request sought USD 18 million for research and development with partners, which keeps new sensing methods under review. Luna Innovations separately lists spectral fingerprinting of explosives and biological agents among its terahertz uses. Buyers of full-body scanners follow this work closely, since detection algorithms and false alarm rates drive replacement decisions. Defense interest is also visible in capital, because Lockheed Martin Ventures joined the Teradar Series B round in November 2025.
Compact converters and vehicle sensors reshape demand
Shift toward compact converters and on-wafer sub-THz test
Test demand is shifting from large optical benches to compact converters that attach to existing analyzers. Everything RF described a joint Keysight, FormFactor, Dominion MicroProbes and Virginia Diodes solution that sweeps continuously to 220 GHz for on-wafer device work, using extenders with installed N5291A systems. Buyers of semiconductor metrology equipment therefore see the band as an extension of familiar wafer test. Microwave Journal reported that Virginia Diodes runs 30,000 square feet of manufacturing space in Charlottesville with 115 employees, which shows domestic capacity behind this shift. Optical platforms are getting faster too, since Photonics Media reported 1,600 pulse traces per second for the TOPTICA TeraFlash smart. As a result, communication systems post a CAGR of 18.94%, the fastest in this segment view.
Rise of terahertz sensors for vehicle perception
Vehicle perception is emerging as a new volume route for a field that has mostly sold laboratory instruments. TechCrunch reported on Nov. 12, 2025, that Boston-based Teradar raised USD 150 million and is validating its sensor with five top automakers from the United States and Europe, plus three Tier 1 suppliers. The same report said the company expects a contract for a 2028-model vehicle, at a sensor cost of a few hundred dollars. FreightWaves reported claimed detection of 200 to 250 meters for passenger cars and about 20 times the data points of a Continental ARS540 unit. This challenges suppliers of automotive radar, although volume orders remain unproven until a production award is announced.
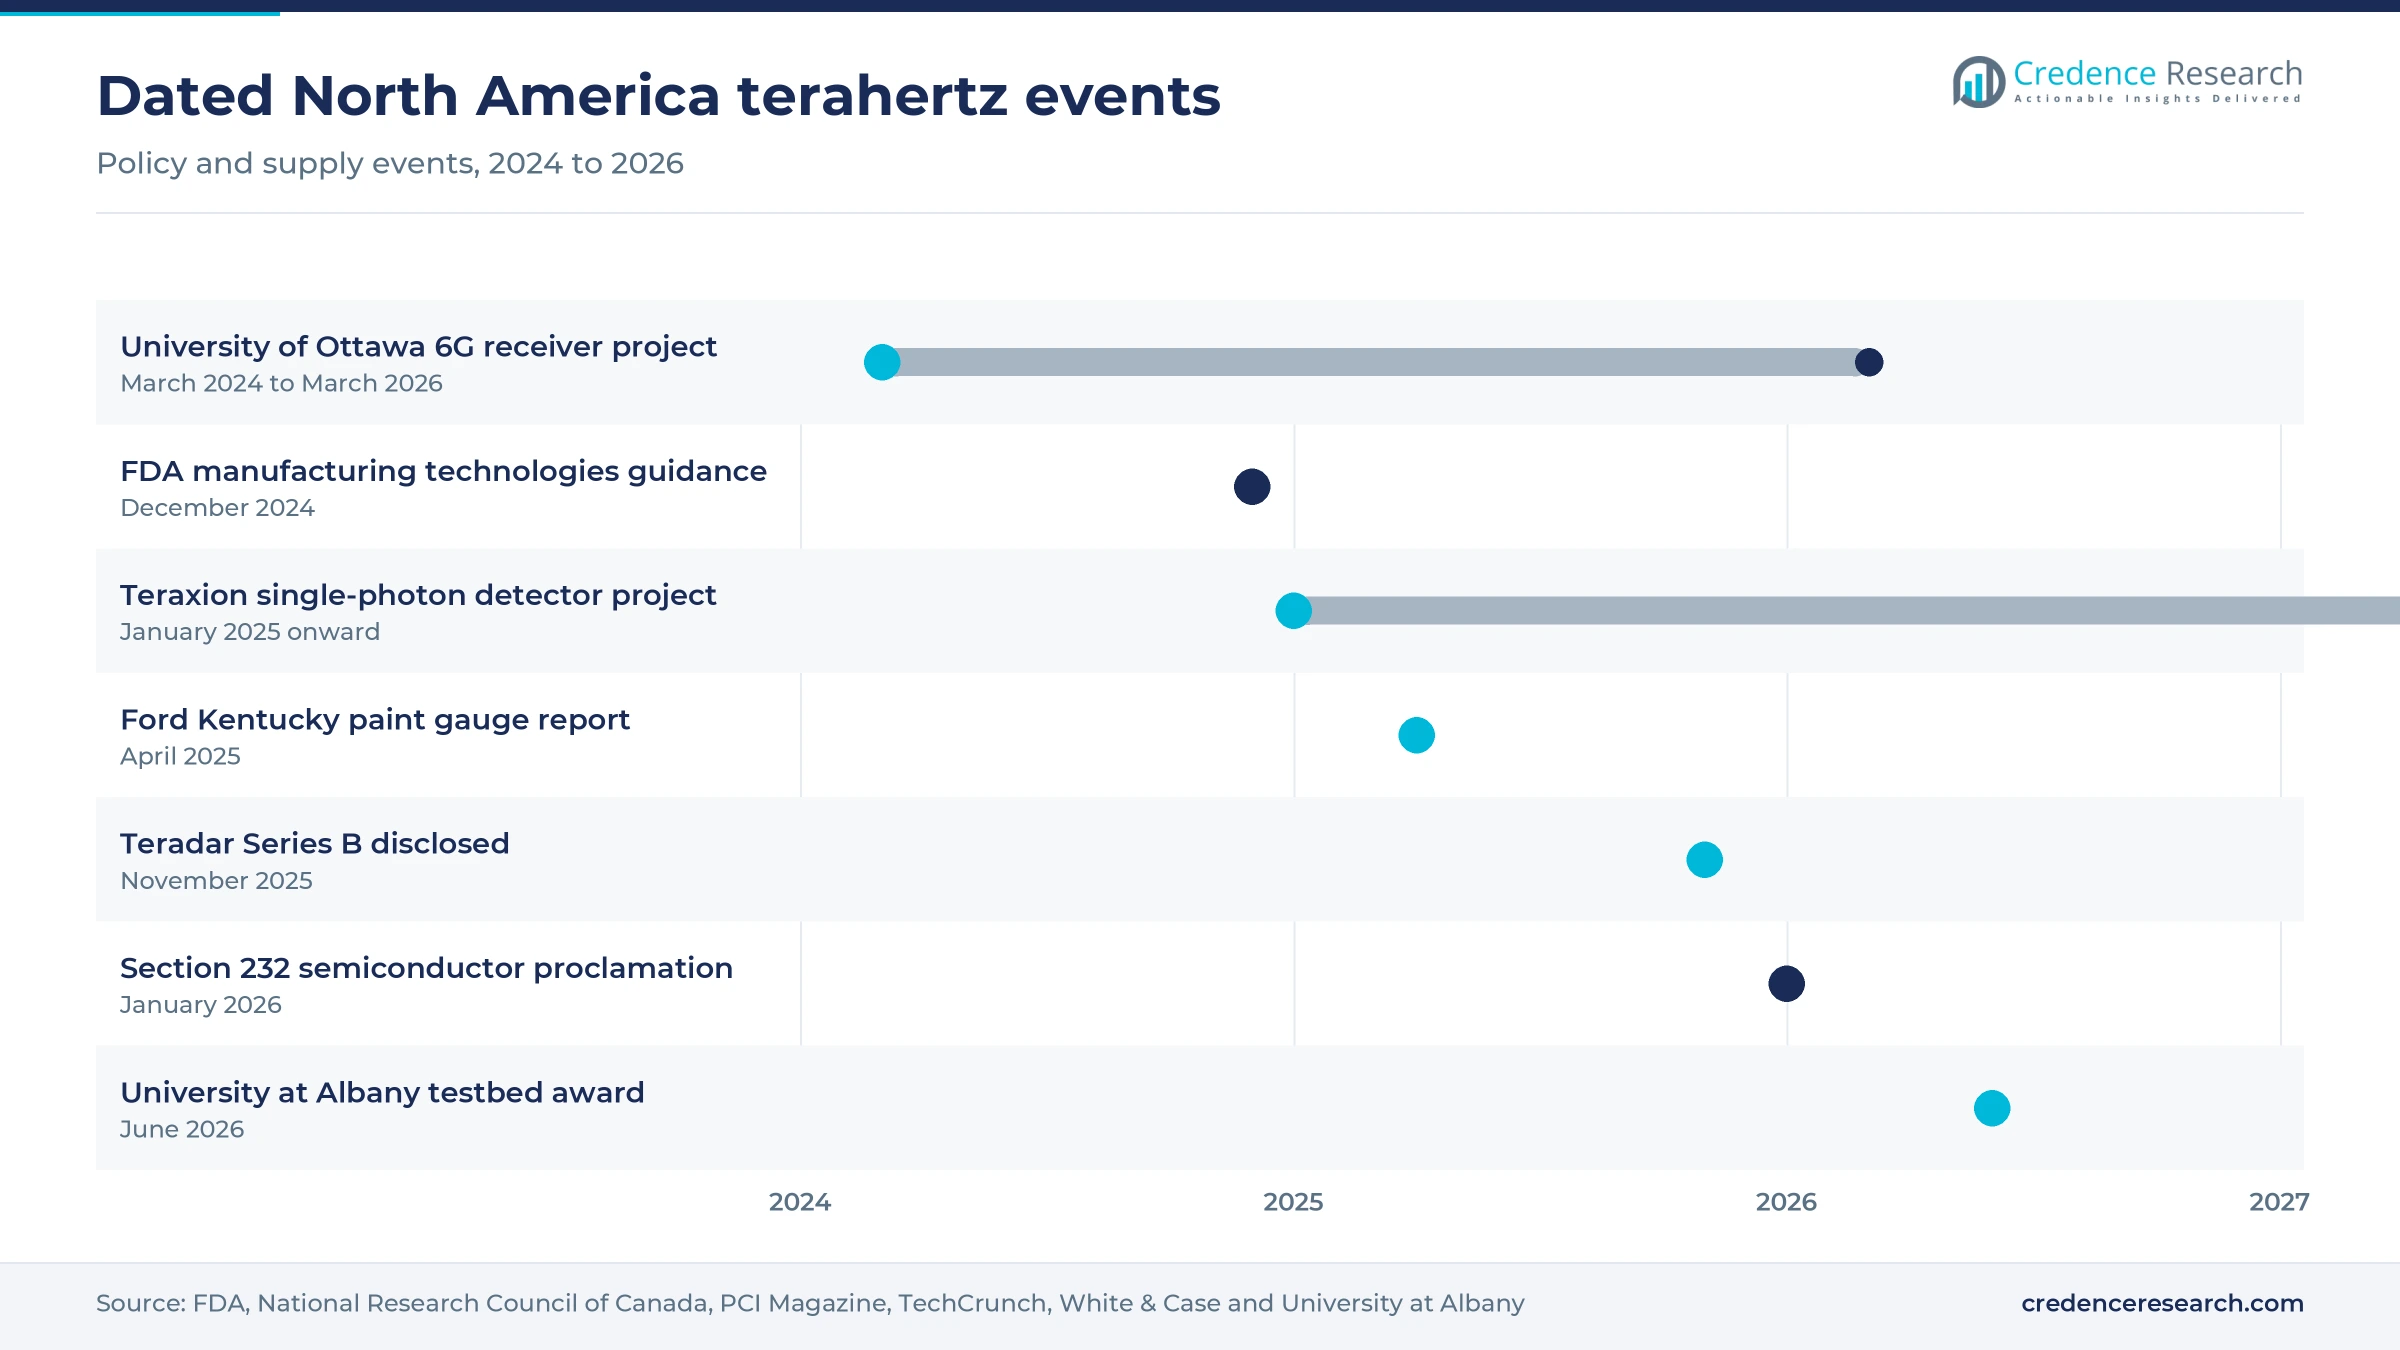
Opportunity for Canadian detector commercialization
Canada offers an opening for suppliers that can turn funded detector research into products. The National Research Council committed C$966,075 to Teraxion from Jan. 13, 2025, to March 31, 2028, for room-temperature detection of terahertz radiation at the single-photon level, working with the University of Ottawa and ÉTS. The council also funded the University of Ottawa with C$330,550 from March 2024 to March 2026 for a compact 6G receiver demonstrator built on a low-cost spectrometer. ÉTS hosts a Canada Research Chair in Spatiotemporal Encryption of Terahertz Light under Dr. François Blanchard, while Mitacs lists a project between Université INRS and OptoElectronic Components for a compact detector above 12 THz. Canada grows at 17.05% a year in the Credence Research estimate.
Opportunity for plant gauging across Mexican vehicle lines
Mexico presents an opening for gauge suppliers because its vehicle plants already run at export scale and a domestic research partner exists. INEGI data reported by Latam Mobility show 3,953,494 light vehicles built in 2025, of which most went abroad, so paint quality carries high warranty and rejection stakes. The Ford installation reported in Kentucky gives integrators a reference design for these lines. Centro de Investigaciones en Óptica in León hosts the spectroscopy unit of the National Laboratory of Terahertz Science and Technology, and it can image areas up to 1 square meter, which suits body panels and trials. Mexico therefore ranks as the fastest-growing of the three countries in the Credence Research estimate, from a share of 5.7%.
Federal budgets, tariffs and license limits slow buyers
Why might federal screening budgets delay concealed threat orders?
Federal screening budgets are tight because fee diversion reduces money for new equipment. Biometric Update reported in November 2025 that more than USD 12 billion has been diverted since 2013, and that a former TSA administrator warned full computed tomography deployment could slip to 2042. Suppliers of concealed threat systems therefore compete with established checkpoint priorities for limited funds. As a result, sales cycles lengthen and pilot programs stay small. Vendors can reduce this exposure by pursuing defense research and private capital.
How could tariffs raise the cost of imported instruments?
Trade policy adds pricing risk because many instruments and components cross borders before installation. White & Case reported that a Jan. 14, 2026, proclamation set a narrow 25% Section 232 tariff on certain advanced semiconductor articles, and it noted that broader tariffs on semiconductors and manufacturing equipment remain possible. Buyers of systems from Munich-based Menlo Systems, along with laboratories on fixed grants, would feel any widening first. Suppliers can mitigate this through regional assembly, local spares and longer quote validity.
What limits do spectrum rules place on commercial radio plans?
Long-term access above 95 GHz is still mostly experimental, which holds back commercial planning by radio makers. FCC rules set Spectrum Horizons experimental licenses at ten years with no renewal, and unlicensed access covers only four bands totaling 21.2 gigahertz. Equipment makers planning products therefore face uncertainty about which bands will carry commercial service. In turn, communication buyers favor flexible test sets over dedicated production hardware. Continued FCC and industry work on specific bands would reduce this risk over the forecast period.
Why do research gaps slow demand outside the United States?
Research spending gaps slow demand outside the United States because laboratories remain the first buyers of these instruments. World Bank data put research and development at 3.45% of GDP in the United States in 2023, against 1.79% in Canada and 0.25% in Mexico in 2024. Mexican and Canadian laboratories therefore have fewer funded equipment lines, and suppliers see thinner distributor volumes. Shared national facilities such as the laboratory in León can partly offset this gap through pooled access.
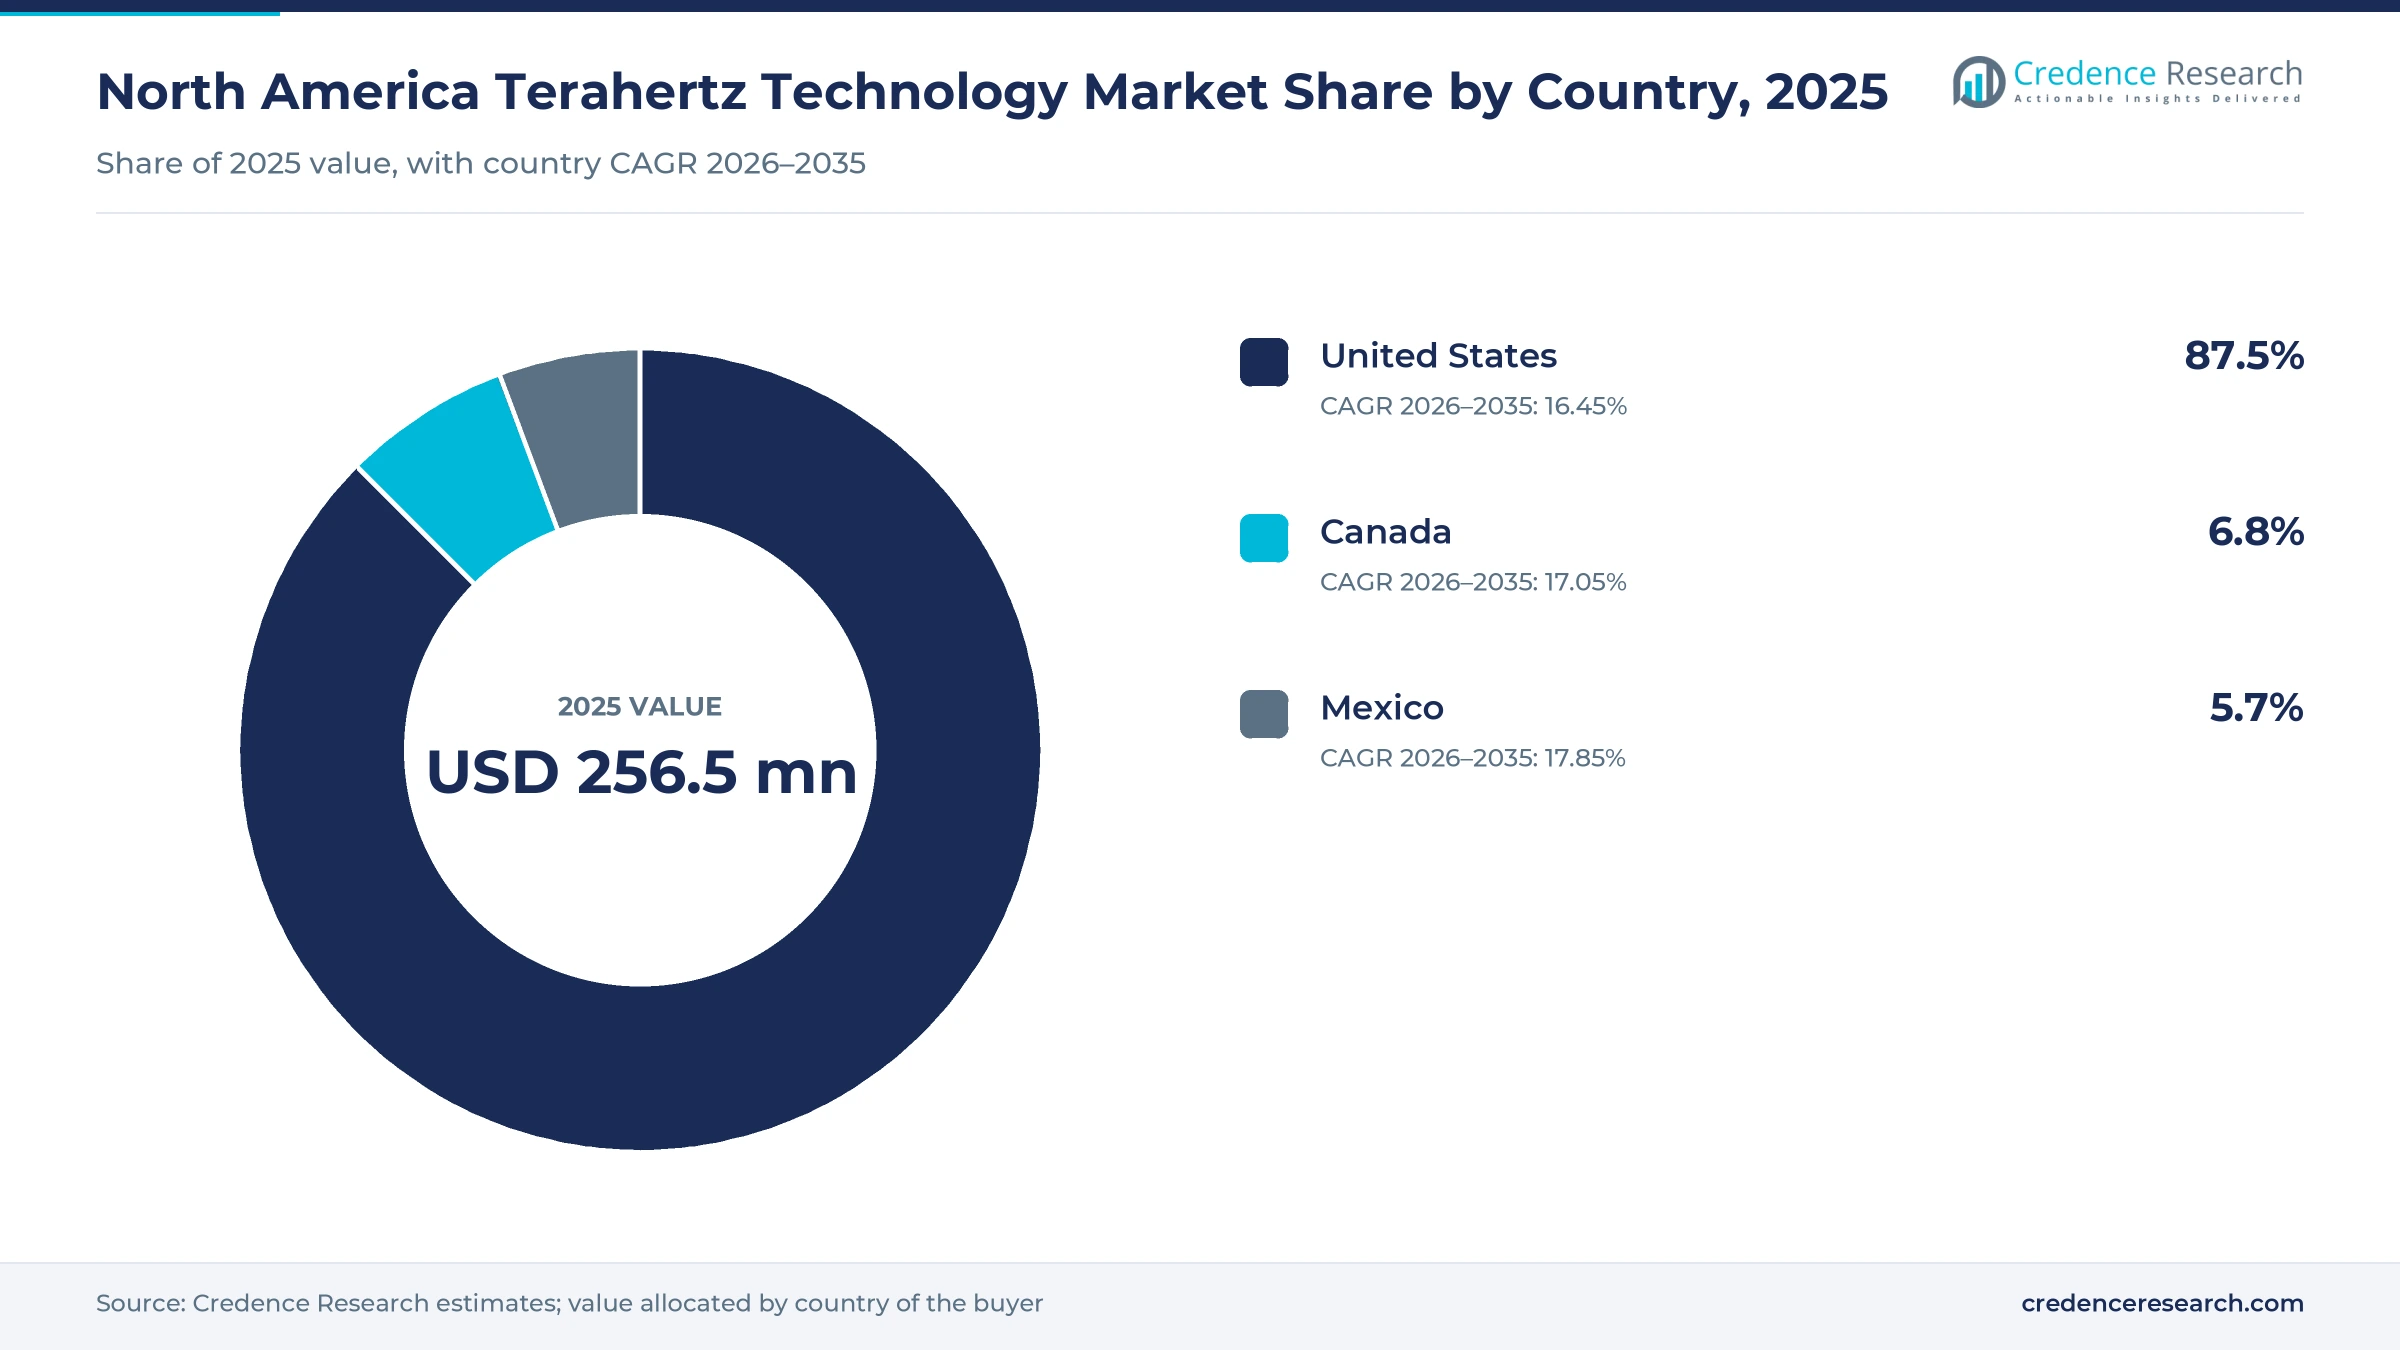
The United States dominates and Mexico grows from a low base
| Country | Value, 2025 (USD million) | Share, 2025 | CAGR, 2026–2035 |
|---|---|---|---|
| United States | 224.4 | 87.5% | 16.45% |
| Canada | 17.4 | 6.8% | 17.05% |
| Mexico | 14.6 | 5.7% | 17.85% |
United States holds most supply and federal demand
The United States held a share of 87.5% in 2025 and grows at 16.45% a year, because both suppliers and federal buyers concentrate there. Virginia Diodes builds in Charlottesville, Luna Innovations is headquartered in Roanoke, Virginia, Bridge12 Technologies is based in Framingham and TeraSense lists a San Jose address. Teradar adds a venture-backed automotive route from Boston, while TSA, NIH and the National Science Foundation fund screening, spectroscopy and radio work. The country share should ease slightly as Canadian and Mexican orders grow from smaller bases.
Canada builds on detector and receiver research
Canada held a share of 6.8% in 2025 and grows at 17.05% a year, as federally funded detector and receiver projects mature. The National Research Council backs work at Teraxion and the University of Ottawa, and ÉTS runs the TeraÉTS Laboratory under its research chair. These projects create early demand for spectrometers, sources and detectors, even though purchases remain small next to United States budgets. Commercial conversion after the Teraxion project ends in March 2028 is the main test for this country.
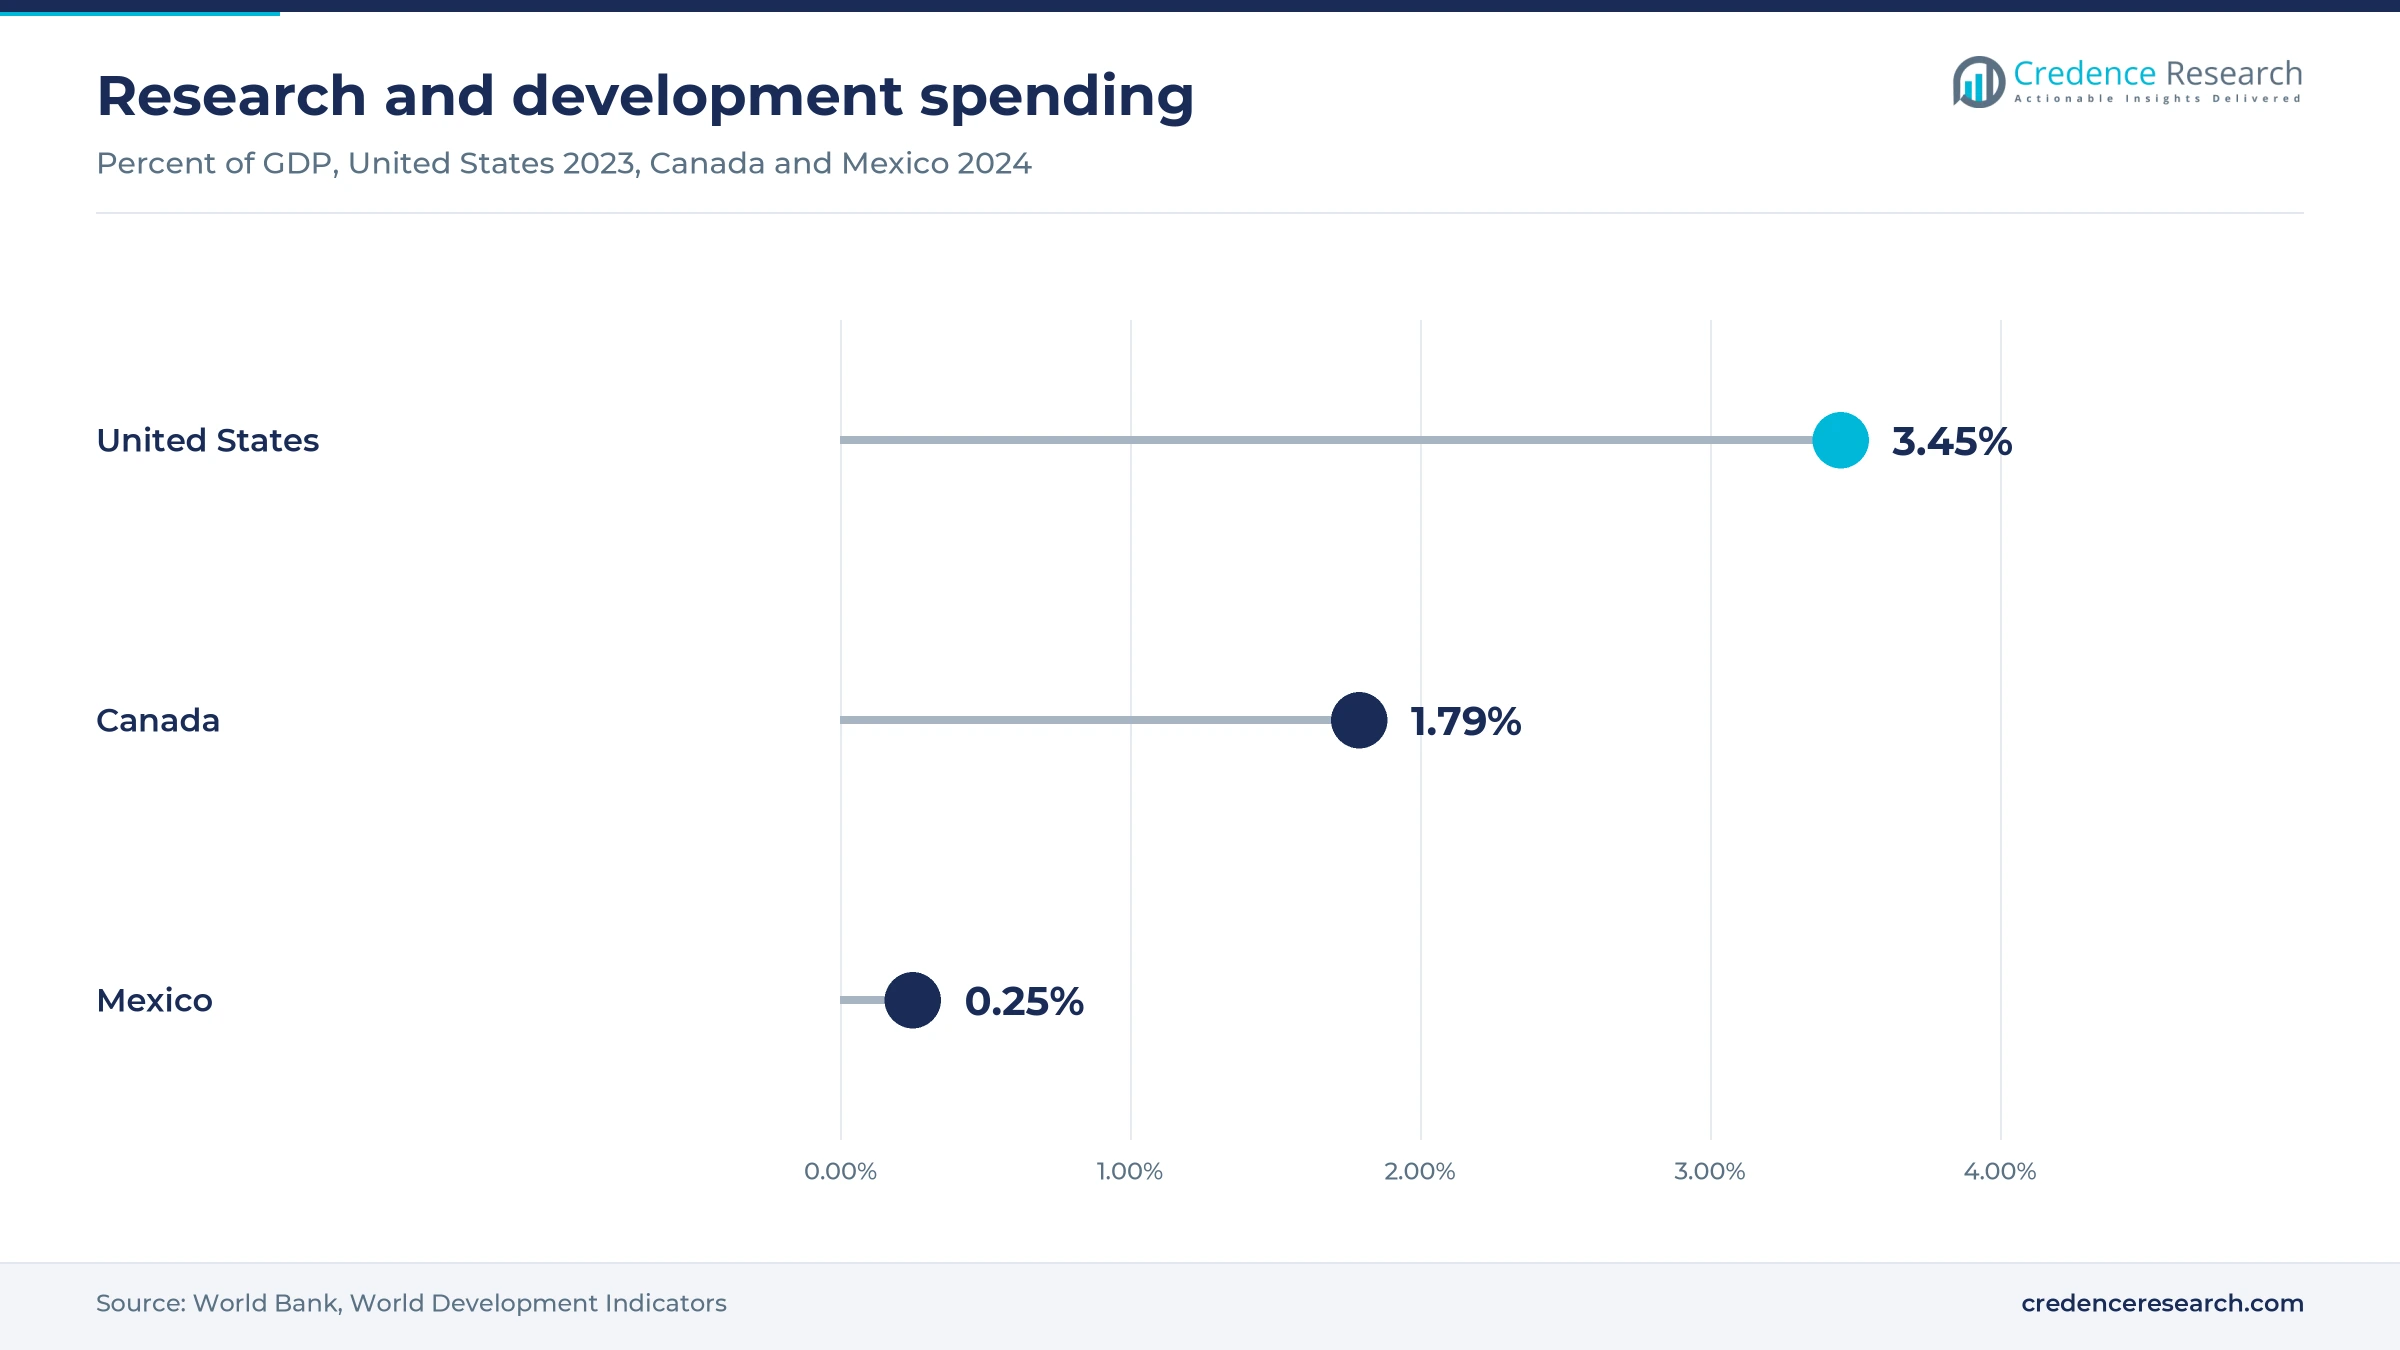
Mexico grows fastest from a small base
Mexico held a share of 5.7% in 2025 and grows at 17.85% a year, the fastest rate among the three countries. Demand today centers on León, where Centro de Investigaciones en Óptica operates time-domain spectrometers and imaging systems for medicine, industry and cultural heritage work. Future growth depends on paint and coating gauges for vehicle plants, because the country exported 3,385,785 light vehicles in 2025 according to INEGI. Low national research spending keeps this estimate dependent on industrial buyers rather than on new laboratory grants.
Grants, rules and funding set the 2024 to 2026 pace
| Development | Status and market relevance |
|---|---|
| In March 2024, the National Research Council of Canada began funding a University of Ottawa project on a compact 6G terahertz receiver. | The funding ran through March 2026, with a receiver demonstrator expected by its close. |
| In December 2024, the FDA finalized its Advanced Manufacturing Technologies Designation Program guidance, replacing a December 2023 draft. | The guidance is in force and supports early adoption of new drug manufacturing methods. |
| In April 2025, PCI Magazine reported a TeraView and Indicon robotic paint gauge installed at a Ford plant in Kentucky. | The cell is installed and serves as a reference for automotive line buyers. |
| In November 2025, Teradar disclosed USD 150 million in Series B funding with Lockheed Martin Ventures among its investors. | The company is validating its sensor and has not announced a production award. |
| In June 2026, the University at Albany announced a USD 1.3 million National Science Foundation award for a wireless testbed reaching sub-terahertz bands. | The instrument will be housed in the Wireless Systems Lab at its Downtown Building. |
Pulsed, continuous-wave and converter designs compete
- Pulsed time-domain systems read broadband spectra and layer structure at once, and Luna Innovations lists a 0.1 to 10 THz range for this approach.
- Continuous-wave photonic systems reach 1 GHz frequency resolution in the Fraunhofer HHI T-Sweeper design, and that design sweeps more than 4 THz in broadband mode.
- Frequency extenders and converters add sub-terahertz coverage to existing analyzers, which is why Keysight and Virginia Diodes pair them for 6G work.
- Vacuum and gyrotron sources deliver higher power near 395 GHz, and Bridge12 Technologies applies them to DNP-NMR and EPR spectroscopy.
Need a Custom Version of This Report?
Tailor the scope, geography, or segments to your exact requirements.
- Custom geography or segment scope
- Direct access to our analyst team
Instrument makers and component specialists compete
Competition in terahertz technology splits between instrument makers, component specialists and a new sensor entrant. Luna Innovations competes with TeraMetrix gauges for coatings, roofing and aerospace work, while TOPTICA Photonics, which lists an office in Pittsford, New York and Menlo Systems sell time-domain spectrometers to laboratories. Keysight Technologies and Virginia Diodes work as partners more than rivals, combining analyzers and extenders into test sets for 6G groups. TeraSense sells terahertz cameras, detectors and sources from a San Jose address, and Gentec Electro-Optics supplies pyroelectric detectors for power measurement. Bridge12 Technologies concentrates on gyrotrons and terahertz systems for magnetic resonance laboratories. Teradar differs from all of them because it targets automotive volumes rather than instrument sales. Terahertz technology suppliers therefore compete on bandwidth, dynamic range, integration support and the ability to deliver a validated measurement recipe to a plant.
Companies profiled and their roles in this market
| Company | Type | Role in the market |
|---|---|---|
| Luna Innovations | Gauge and imaging maker | TeraMetrix gauges for aerospace, roofing, marine and pipe inspection, based in Roanoke, Virginia |
| TOPTICA Photonics | Instrument maker | TeraFlash time-domain platforms, with a United States office in Pittsford, New York |
| Menlo Systems | Instrument maker | Time-domain spectrometers, including a Tera K-15 unit listed at TeraLab in León |
| Keysight Technologies | Test and measurement | First FCC Spectrum Horizons experimental license holder and 6G test bed supplier |
| Virginia Diodes | Component and system maker | Frequency extenders up to 1.5 THz, built in Charlottesville, Virginia |
| TeraSense | Imaging specialist | Terahertz cameras, detectors, optics and sources, with a San Jose, California, address |
| Gentec Electro-Optics | Detector supplier | Pyroelectric detectors from 0.1 to 30 THz, with a Lake Oswego, Oregon, contact listed |
| Bridge12 Technologies | Source specialist | Gyrotrons and terahertz systems for DNP-NMR, based in Framingham, Massachusetts |
| Teradar | Automotive sensor entrant | Boston-based sensor developer validating with automakers and Tier 1 suppliers |
Plant gauges will decide the next stage of growth
Credence Research's view is that this market will stay research led through 2028, with plant gauging deciding what follows. Grant programs still create most first orders, yet the Ford installation shows that a repeatable line-side recipe can exist outside the laboratory. The most useful signal to watch is a second automotive or roofing plant announcing a production gauge, because repeat orders would change sales cycles. Teradar is a higher-risk upside that depends on a production award, so buyers and investors should treat its volumes as unproven until a vehicle program is named.
How the regional estimates were built
The report uses 2025 as the base year and 2035 as the forecast year, with growth stated for 2026–2035. Market values come from the Credence Research model, and segment and country splits are Credence Research estimates informed by public data. Sources include agency testimony, Federal Register notices, FDA guidance, Canadian grant records, World Bank data, INEGI statistics, company product literature and named trade publications. No interviews or surveys were conducted for this edition of the report.
Communication and inline buyers shape the path to 2035
Terahertz technology value is forecast to reach USD 1.19 billion by 2035, as orders broaden from laboratories to plants and radio testbeds. Research users should remain the largest buyers for several years, while inline installations and communication systems add the most new growth. Mexico and Canada should gain share slowly, because their laboratory budgets are smaller but their plant and detector programs are active. Trade policy and FCC licensing decisions remain the main uncertainties, and either could shift the timing of orders without changing the direction of demand across these three countries.
Frequently Asked Questions
How big is the North America terahertz technology market?
Which country leads the regional market?
Which country is growing fastest?
Which solution type holds the largest share?
Why are factories starting to buy terahertz gauges?
How do FCC rules affect sub-terahertz research?
What is the main challenge for threat detection suppliers?
Which companies are active in this market?
Table of Content
Chapter 1 Market Segmentation
- 1.1 Segmentation Framework
- 1.1.1 Product and Service Classification
- 1.1.2 Application and End-Use Classification
- 1.1.3 Technology and Solution Classification
- 1.1.4 Customer and Distribution Channel Classification
- 1.1.5 Geographic Segmentation
- 1.1.6 Market Segment Definitions and Boundaries
- 1.2 By Solution Type
- 1.2.1 Spectroscopy Systems
- 1.2.2 Imaging Systems
- 1.2.3 Standalone Components
- 1.2.4 Communication Systems
- 1.3 By Deployment Model
- 1.3.1 Benchtop Instruments
- 1.3.2 Inline Installations
- 1.3.3 Portable Platforms
- 1.4 By End-Use Industry
- 1.4.1 Academic and Telecommunications Research
- 1.4.2 Defense and Security
- 1.4.3 Industrial and Food Production
- 1.4.4 Healthcare and Life Sciences
- 1.5 By Application
- 1.5.1 Materials Characterization
- 1.5.2 Process Quality Control
- 1.5.3 Concealed Threat Detection
- 1.5.4 Communication Testing
- 1.6 By Country
- 1.6.1 United States
- 1.6.2 Canada
- 1.6.3 Mexico
Chapter 2 Introduction
- 2.1 Report Objectives and Scope
- 2.2 Product Definition and Industry Terminology
- 2.3 Market Inclusions and Exclusions
- 2.4 Research Process
- 2.4.1 Primary Research and Expert Interviews
- 2.4.2 Secondary Research and Source Review
- 2.4.3 Top-Down and Bottom-Up Estimation
- 2.4.4 Data Triangulation and Verification
- 2.5 Market Size Measurement Basis
- 2.5.1 2025: USD 256.5 million → 2035: USD 1.19 billion
- 2.6 Historical and Forecast Reference Periods
- 2.6.1 Historical Period: 2018-2025
- 2.6.2 Base Year: 2025
- 2.6.3 Forecast Period: 2025-2035
- 2.7 Research Assumptions and Limitations
Chapter 3 Executive Summary
- 3.1 Market Snapshot and Key Findings
- 3.2 Base-Year Market Size, 2025
- 3.3 Forecast Market Size, 2035
- 3.4 Revenue and Volume Growth Outlook
- 3.5 Key Demand and Supply Indicators
- 3.6 Leading Market Segments
- 3.7 Fastest-Growing Market Opportunities
- 3.8 Regional Performance Highlights
- 3.9 Technology and Industry Transformation
- 3.10 Competitive Landscape Summary
- 3.11 Analyst View and Strategic Implications
Chapter 4 North America Terahertz Technology Market Trends and Developments
- 4.1 Historical Industry Development, 2018-2025
- 4.2 Recent Market Trends and Developments
- 4.3 Demand and Customer Behavior Trends
- 4.4 Technology and Product Innovation
- 4.5 Artificial Intelligence, Automation and Digitalization
- 4.6 Local Manufacturing and Supply Chain Realignment
- 4.7 Industry Partnerships, Mergers and Acquisitions
- 4.8 Sustainability and Circular Economy Developments
- 4.9 Government and Private Sector Investment Trends
- 4.10 Emerging Business Models and Commercialization
- 4.11 Industry Developments and Announcements
Chapter 5 North America Terahertz Technology Market Production, Supply and Demand Analysis
- 5.1 Demand Trend and Consumption Analysis, 2018-2025
- 5.2 Demand Forecast, 2025-2035
- 5.3 Production and Output Trend, 2018-2025
- 5.4 Production and Output Forecast, 2025-2035
- 5.5 Installed Capacity and Capacity Utilization
- 5.6 Company-Wise Production Plants and Statistics
- 5.6.1 Installed Production Capacity
- 5.6.2 Actual Production
- 5.6.3 Planned Capacity and Expansion Targets
- 5.7 Supply Chain Structure and Procurement Trends
- 5.8 Supply-Demand Gap and Bottlenecks
- 5.9 Import Dependence and Sourcing Structure
- 5.10 Contract Manufacturing and Outsourcing
- 5.11 Regional Supply and Demand Concentration
Chapter 6 North America Terahertz Technology Market Pricing Analysis
- 6.1 Pricing Structure and Measurement
- 6.2 Historical Pricing Trends, 2018-2025
- 6.3 Pricing Outlook, 2025-2035
- 6.4 Average Selling Price and Unit Economics
- 6.5 Pricing by Product and Market Segment
- 6.6 Geographic Pricing Differences
- 6.7 Key Input, Energy, Labor and Logistics Costs
- 6.8 Contract Pricing and Purchasing Models
- 6.9 Pricing Sensitivity and Competitive Positioning
- 6.10 Price, Margin and Profitability Implications
Chapter 7 North America Terahertz Technology Market Dynamics
- 7.1 Market Growth Drivers
- 7.1.1 Demand-Side Drivers
- 7.1.2 Technology and Innovation Drivers
- 7.1.3 Infrastructure and Investment Drivers
- 7.1.4 Regulatory and Policy Drivers
- 7.2 Market Restraints
- 7.2.1 Cost and Affordability Constraints
- 7.2.2 Technology and Adoption Barriers
- 7.2.3 Supply Chain and Operational Constraints
- 7.3 Market Challenges
- 7.3.1 Competitive Pressure and Margin Erosion
- 7.3.2 Skills, Infrastructure and Implementation Gaps
- 7.4 Emerging Market Opportunities
- 7.5 Market Dynamics Impact and Time-Horizon Assessment
Chapter 8 North America Terahertz Technology Value Chain Analysis
- 8.1 Industry Value Chain Overview
- 8.2 Upstream Suppliers and Critical Inputs
- 8.3 Technology and Component Providers
- 8.4 Manufacturing or Service Delivery
- 8.5 Distribution, Channel Partners and Integrators
- 8.6 Downstream Applications and End Users
- 8.7 Value Addition and Profit Pools
- 8.8 Vertical Integration and Outsourcing
- 8.9 Supplier Concentration and Risk
- 8.10 Supply Chain Localization and Resilience
Chapter 9 North America Terahertz Technology Market Regulations and Policies
- 9.1 Relevant Laws, Standards and Compliance Frameworks
- 9.2 Product, Service, Safety and Quality Requirements
- 9.3 Government Policies, Incentives and Subsidies
- 9.4 Imports, Exports and Trade Barriers
- 9.5 Public Procurement and Local Content Requirements
- 9.6 Environmental and Sustainability Compliance
- 9.7 Upcoming Policy Changes and Market Implications
Chapter 10 North America Terahertz Technology Market Hotspots and Opportunities
- 10.1 Market Opportunity Mapping and Growth Hotspots
- 10.2 High-Growth Applications and Customer Groups
- 10.3 Underserved Markets and White-Space Opportunities
- 10.4 Emerging Technology and Product Opportunities
- 10.5 New Capacity and Investment Hotspots
- 10.6 Market Entry and Expansion Opportunities
- 10.7 Distribution and Partnership Opportunities
- 10.8 Near-Term and Long-Term Commercial Potential
- 10.9 Opportunity Attractiveness and Execution Risks
Chapter 11 North America Terahertz Technology Market Outlook, 2025-2035
- 11.1 Market Size and Analysis
- 11.1.1 Revenue (Market Measurement: 2025: USD 256.5 million → 2035: USD 1.19 billion)
- 11.1.2 Market Volume and Quantity Sold
- 11.1.3 Historical Market Size, 2018-2025
- 11.1.4 Base-Year Market Size, 2025
- 11.2 Market Forecast, 2025-2035
- 11.2.1 Revenue Forecast to 2035
- 11.2.2 Volume Forecast to 2035
- 11.2.3 CAGR and Year-on-Year Growth
- 11.2.4 Incremental Revenue Opportunity
- 11.3 Forecast Assumptions and Scenario Analysis
- 11.3.1 Base-Case Forecast
- 11.3.2 Optimistic and Conservative Scenarios
- 11.3.3 Technology, Pricing and Policy Sensitivities
- 11.4 Market Attractiveness and Growth Outlook
Chapter 12 North America Terahertz Technology Market Segmentation and Outlook
- 12.1 Segmentation Summary and Market Shares, 2025
- 12.2 Largest and Fastest-Growing Segments
- 12.3 By Solution Type - Market Size and Forecast, 2025-2035
- 12.3.1 Segment Definition and Scope
- 12.3.2 Historical Market Size, 2018-2025
- 12.3.3 Revenue Forecast, 2025-2035
- 12.3.4 Volume Forecast, 2025-2035
- 12.3.5 Base-Year Market Share, 2025
- 12.3.6 Segment CAGR and Growth Drivers
- 12.3.7 Subsegment Market Size and Forecast
- 12.3.7.1 Spectroscopy Systems
- 12.3.7.2 Imaging Systems
- 12.3.7.3 Standalone Components
- 12.3.7.4 Communication Systems
- 12.3.8 Subsegment Pricing and Adoption Trends
- 12.3.9 Leading Suppliers and Competition
- 12.3.10 Regional Demand and Opportunities
- 12.4 By Deployment Model - Market Size and Forecast, 2025-2035
- 12.4.1 Segment Definition and Scope
- 12.4.2 Historical Market Size, 2018-2025
- 12.4.3 Revenue Forecast, 2025-2035
- 12.4.4 Volume Forecast, 2025-2035
- 12.4.5 Base-Year Market Share, 2025
- 12.4.6 Segment CAGR and Growth Drivers
- 12.4.7 Subsegment Market Size and Forecast
- 12.4.7.1 Benchtop Instruments
- 12.4.7.2 Inline Installations
- 12.4.7.3 Portable Platforms
- 12.4.8 Subsegment Pricing and Adoption Trends
- 12.4.9 Leading Suppliers and Competition
- 12.4.10 Regional Demand and Opportunities
- 12.5 By End-Use Industry - Market Size and Forecast, 2025-2035
- 12.5.1 Segment Definition and Scope
- 12.5.2 Historical Market Size, 2018-2025
- 12.5.3 Revenue Forecast, 2025-2035
- 12.5.4 Volume Forecast, 2025-2035
- 12.5.5 Base-Year Market Share, 2025
- 12.5.6 Segment CAGR and Growth Drivers
- 12.5.7 Subsegment Market Size and Forecast
- 12.5.7.1 Academic and Telecommunications Research
- 12.5.7.2 Defense and Security
- 12.5.7.3 Industrial and Food Production
- 12.5.7.4 Healthcare and Life Sciences
- 12.5.8 Subsegment Pricing and Adoption Trends
- 12.5.9 Leading Suppliers and Competition
- 12.5.10 Regional Demand and Opportunities
- 12.6 By Application - Market Size and Forecast, 2025-2035
- 12.6.1 Segment Definition and Scope
- 12.6.2 Historical Market Size, 2018-2025
- 12.6.3 Revenue Forecast, 2025-2035
- 12.6.4 Volume Forecast, 2025-2035
- 12.6.5 Base-Year Market Share, 2025
- 12.6.6 Segment CAGR and Growth Drivers
- 12.6.7 Subsegment Market Size and Forecast
- 12.6.7.1 Materials Characterization
- 12.6.7.2 Process Quality Control
- 12.6.7.3 Concealed Threat Detection
- 12.6.7.4 Communication Testing
- 12.6.8 Subsegment Pricing and Adoption Trends
- 12.6.9 Leading Suppliers and Competition
- 12.6.10 Regional Demand and Opportunities
- 12.7 By Country - Market Size and Forecast, 2025-2035
- 12.7.1 Segment Definition and Scope
- 12.7.2 Historical Market Size, 2018-2025
- 12.7.3 Revenue Forecast, 2025-2035
- 12.7.4 Volume Forecast, 2025-2035
- 12.7.5 Base-Year Market Share, 2025
- 12.7.6 Segment CAGR and Growth Drivers
- 12.7.7 Subsegment Market Size and Forecast
- 12.7.7.1 United States
- 12.7.7.2 Canada
- 12.7.7.3 Mexico
- 12.7.8 Subsegment Pricing and Adoption Trends
- 12.7.9 Leading Suppliers and Competition
- 12.7.10 Regional Demand and Opportunities
- 12.8 Segment Growth Comparison
- 12.9 Segment Attractiveness and Priority Matrix
Chapter 13 North America Terahertz Technology End-Use and Application Market Outlook
- 13.1 End-Use Industry and Customer Demand Structure
- 13.2 Leading Applications and Customer Groups
- 13.3 End-Use Market Size, Share and Forecast
- 13.4 Major End-Use Industry Deep Dives
- 13.4.1 Customer Requirements and Use Cases
- 13.4.2 Demand and Replacement Cycles
- 13.4.3 Technical and Regulatory Considerations
- 13.4.4 Purchasing and Procurement Models
- 13.4.5 Leading Vendors and Distribution Channels
- 13.4.6 Forecast and Commercial Opportunities
- 13.5 Emerging Applications and Cross-Segment Demand
- 13.6 End-Use Industry Investment Priorities
Chapter 14 North America Terahertz Technology Geographic Market Outlook, 2025-2035
- 14.1 Regional Market Size and Country-Level Shares, 2025
- 14.2 Country Market Size Comparison, 2025
- 14.3 Country Market Forecasts, 2025-2035
- 14.4 Subregional Industrial and Demand Clusters
- 14.5 Intra-Regional Pricing and Cost Differences
- 14.6 Cross-Border Trade and Supply Networks
- 14.7 Regional Supply and Demand Balances
- 14.8 Country Opportunity Comparison and Prioritization
Note: Every listed country is covered on the structure shown under the first country.
Chapter 15 North America Terahertz Technology Technology, Innovation and Sustainability Outlook
- 15.1 Technology Landscape and Maturity
- 15.2 Product, Process and Service Innovation
- 15.3 AI, Automation and Digital Tools in the Industry
- 15.4 Technology Adoption and Performance Benchmarking
- 15.5 Innovation Pipeline and R&D Investment
- 15.6 Patent and Intellectual Property Trends
- 15.7 Energy Efficiency and Resource Management
- 15.8 Sustainability, Recycling and Circularity
- 15.9 Technology Roadmap, 2025-2035
- 15.10 Risks of Obsolescence and Technology Substitution
Chapter 16 North America Terahertz Technology Market Key Strategic Imperatives
- 16.1 Growth and Market Entry Priorities
- 16.2 High-Return Products and Segments
- 16.3 Pricing, Profitability and Cost Optimization
- 16.4 Technology Investment and Product Differentiation
- 16.5 Supply Chain Localization and Resilience
- 16.6 Distribution and Customer Acquisition
- 16.7 Partnership, Acquisition and Capacity Strategy
- 16.8 Regional Expansion Priorities
- 16.9 Short-, Medium- and Long-Term Actions
Chapter 17 Competition Outlook
- 17.1 Industry Competition Characteristics
- 17.2 Market Structure and Concentration
- 17.3 Market Share and Competitive Positioning, 2025
- 17.4 Company-Wise Revenue and Product Benchmarking
- 17.5 Production and Service Capacity Benchmarking
- 17.6 Technology, Pricing and Differentiation
- 17.7 Regional Footprint and Distribution Strength
- 17.8 Mergers, Acquisitions and Strategic Alliances
- 17.9 New Entrants and Competitive Threats
- 17.10 Porter's Five Forces and Industry Attractiveness
- 17.11 Competitive Outlook, 2025-2035
Chapter 18 Company Profiles
- 18.1 Company Coverage and Selection Criteria
- 18.2 Luna Innovations
- 18.2.1 Business Description
- 18.2.2 Company Ownership and Geographic Presence
- 18.2.3 Product and Service Portfolio
- 18.2.4 Manufacturing and Operating Footprint
- 18.2.5 Production Capacity and Expansion Plans
- 18.2.6 Financial Performance and Investment
- 18.2.7 Market Share and Competitive Position
- 18.2.8 Technology and Innovation Capabilities
- 18.2.9 Strategic Alliances or Partnerships
- 18.2.10 Recent Developments
- 18.2.11 Growth Strategy and Outlook
- 18.3 TOPTICA Photonics
- 18.4 Menlo Systems
- 18.5 Keysight Technologies
- 18.6 Virginia Diodes
- 18.7 TeraSense
- 18.8 Gentec Electro-Optics
- 18.9 Bridge12 Technologies
- 18.10 Teradar
- 18.11 Other Relevant Market Participants
Note: Every listed company is profiled on the structure shown under the first company. The company list is preliminary and may change based on research findings, market developments, data availability and client requirements.
Chapter 19 Disclaimer
- 19.1 Research and Forecast Disclaimer
- 19.2 Data Source and Estimation Limitations
Note: The depth of individual sections depends on data availability for this market. Volume, capacity, trade and other unit-based metrics are included where applicable.

