
Grid spending sets the pace for India electrical components
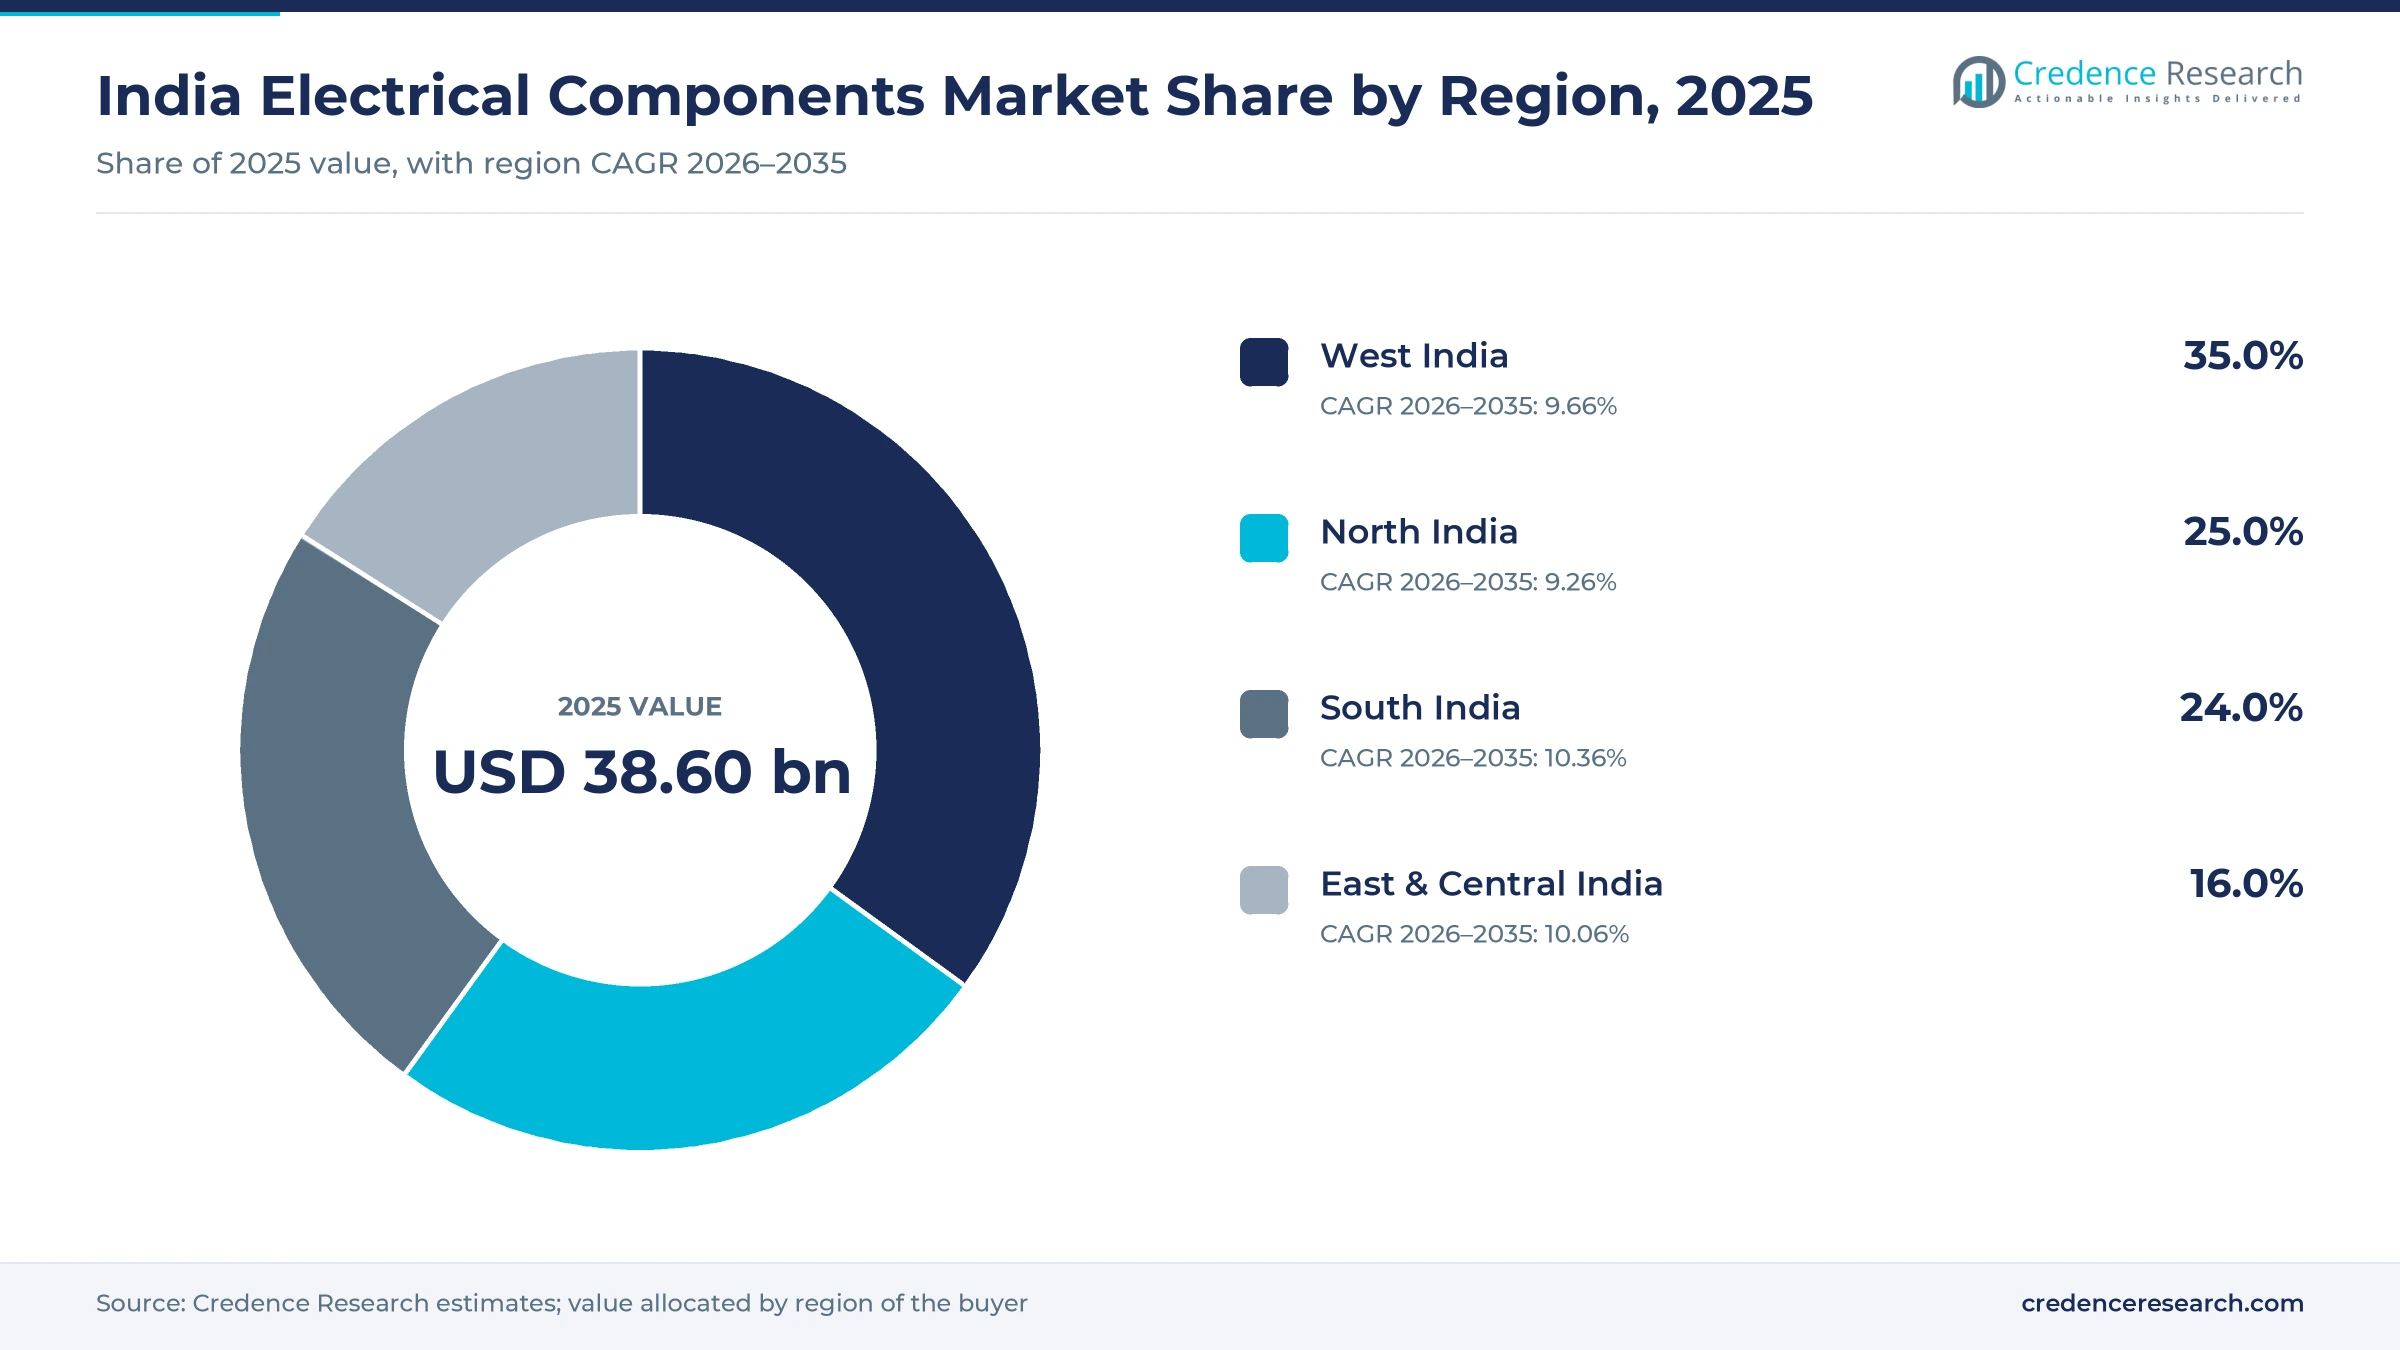
The India electrical components market was valued at USD 38.60 billion in 2025 and is projected to increase from USD 42.38 billion in 2026 to USD 98.31 billion by 2035, registering a CAGR of 9.80% during 2026–2035. Demand comes from utilities buying transformers and switchgear, builders and factories buying wires and panels, and households adding rooftop solar under a national subsidy program. Output is rising quickly, since the Ministry of Heavy Industries recorded heavy electrical equipment production of Rs 364,706 crore in fiscal 2024-25, more than double the fiscal 2020-21 level. West India held the largest regional share, 35.0% in 2025, helped by its plant base in Maharashtra and Gujarat. South India is the fastest-growing region at 10.36% a year, as data center and rooftop load build there. One recent change matters for buyers, because the Ministry of Power reported a record peak demand of 256.1 GW on April 25, 2026, met without shortage.
What does the electrical industry in India count here?
This report counts electrical components, namely cables and wires, switchgears, transformers, boilers and other equipment such as motors, generators, meters, capacitors and control panels sold into India. Buyers include state distribution companies, transmission utilities, power producers, contractors, factories and retail customers, who purchase through tenders, direct contracts and dealer networks.
Batteries, solar cells and modules and power electronics are excluded, which explains why broader industry totals run higher than this estimate. Household appliances and installation labor are also left out, so values reflect equipment sold at the manufacturer and distributor level.

India Electrical Components Market Insights
- The market moves from USD 38.60 billion in 2025 to USD 98.31 billion by 2035, a 9.80% CAGR tied to grid, metering and building load rather than to one product.
- West India held 35.0% of 2025 value, because Maharashtra and Gujarat host many of the country’s large switchgear, transformer and cable plants.
- Cables and Wires led with 34.0% of 2025 value, while Transformers show the fastest growth at 11.17% a year.
- Siemens Energy India approved Rs 2,060 crore in February 2026 to add about 30,000 MVA of large power transformer capacity, due between 2030 and 2032.
- Hitachi Energy India approved a further Rs 2,000 crore in May 2026, including a transformer plant at Karjan in Vadodara district, taking cumulative capital spending to Rs 4,000 crore.
Cables lead value while transformers gain the most ground
Why do cables lead while transformers grow fastest?
Based on product type, the market is categorized into cables and wires, switchgears, transformers, boilers and others. Cables and Wires led with 34.0% of 2025 value because every building and feeder needs them, and Polycab alone reported more than 3,900 authorized dealers and 190,000 retail outlets in its May 2026 results. Transformers grow fastest at 11.17% a year as utilities chase larger substation programs, with the Central Electricity Authority setting a revised fiscal 2025 target of 112,435 MVA against 70,728 MVA added in fiscal 2024, according to T&D India.
How much of demand comes from the grid rather than generation?
Based on application, the market is categorized into transmission and distribution (T&D) and power generation. Transmission and Distribution (T&D) led with 68.0% of 2025 value because grid and building networks absorb most cable, switchgear and transformer output. Transmission and Distribution (T&D) also grows fastest at 10.11%, as the National Electricity Plan calls for the transmission network to rise from 498,000 to 648,000 circuit km by 2032, according to a Ministry of Power statement in January 2026. Power generation orders remain lumpy, although the same statement recorded 13.32 GW of new coal capacity awarded in fiscal 2025-26.
Which end users buy the most, and which are growing quickest?
Based on end user sector, the market is categorized into residential, commercial, industrial, renewable energy integration and electric vehicle infrastructure. Industrial led with 38.0% of 2025 value because factories buy motors, panels and medium-voltage gear in volume, and the International Energy Agency expects industry to supply about one-third of demand growth to 2030. Electric Vehicle Infrastructure grows fastest at 13.56% from a small base, as PM E-Drive set aside Rs 2,000 crore for 72,000 public charging stations in May 2025, according to Energetica India.
| Segment Group | Leading Sub-segment | Share, 2025 | Fastest-growing Sub-segment | CAGR, 2026–2035 |
|---|---|---|---|---|
| By Product Type | Cables and Wires | 34.0% | Transformers | 11.17% |
| By Application | Transmission and Distribution (T&D) | 68.0% | Transmission and Distribution (T&D) | 10.11% |
| By End User Sector | Industrial | 38.0% | Electric Vehicle Infrastructure | 13.56% |
Request a Free Sample
Fill in your details and we'll send you a free sample report.
- Sample data tables & charts
- Research methodology
Grid lines, smart meters and rooftops pull orders forward
How fast is the electrical industry growing in India?
Domestic output has grown far faster than electricity use, which points to equipment replacement and grid catch-up rather than simple load growth. The Ministry of Heavy Industries told the Lok Sabha that heavy electrical equipment production rose from Rs 167,706 crore in fiscal 2020-21 to Rs 302,900 crore in fiscal 2023-24, with industry bodies including IEEMA as its data source. Exports contributed as well, since IEEMA president Hamza Arsiwala put them at USD 11 billion for fiscal 2022-23 when he spoke to KNN in January 2024. As a result, makers such as RR Kabel are adding capacity, with 36,000 metric tons a year planned at Waghodia by March 2028, according to Dalal Street Investment Journal.
Transmission targets keep transformer and switchgear books full
Transmission spending is the most visible driver, because every new corridor needs conductors, transformers, breakers and protection panels. The Ministry of Power reported Rs 38,849 crore of inter-state transmission projects approved during 2025, according to an ANI report carried by The Tribune in January 2026. Peak demand also keeps stretching the network, with the National Electricity Plan assuming 458 GW by 2032. T&D India reported that utilities added 33,265 MVA of substation capacity from April to October 2024, about 8% over target, citing Central Electricity Authority data. This buying supports high-voltage power transformers first, although medium-voltage switchgear follows at each substation that gets commissioned.
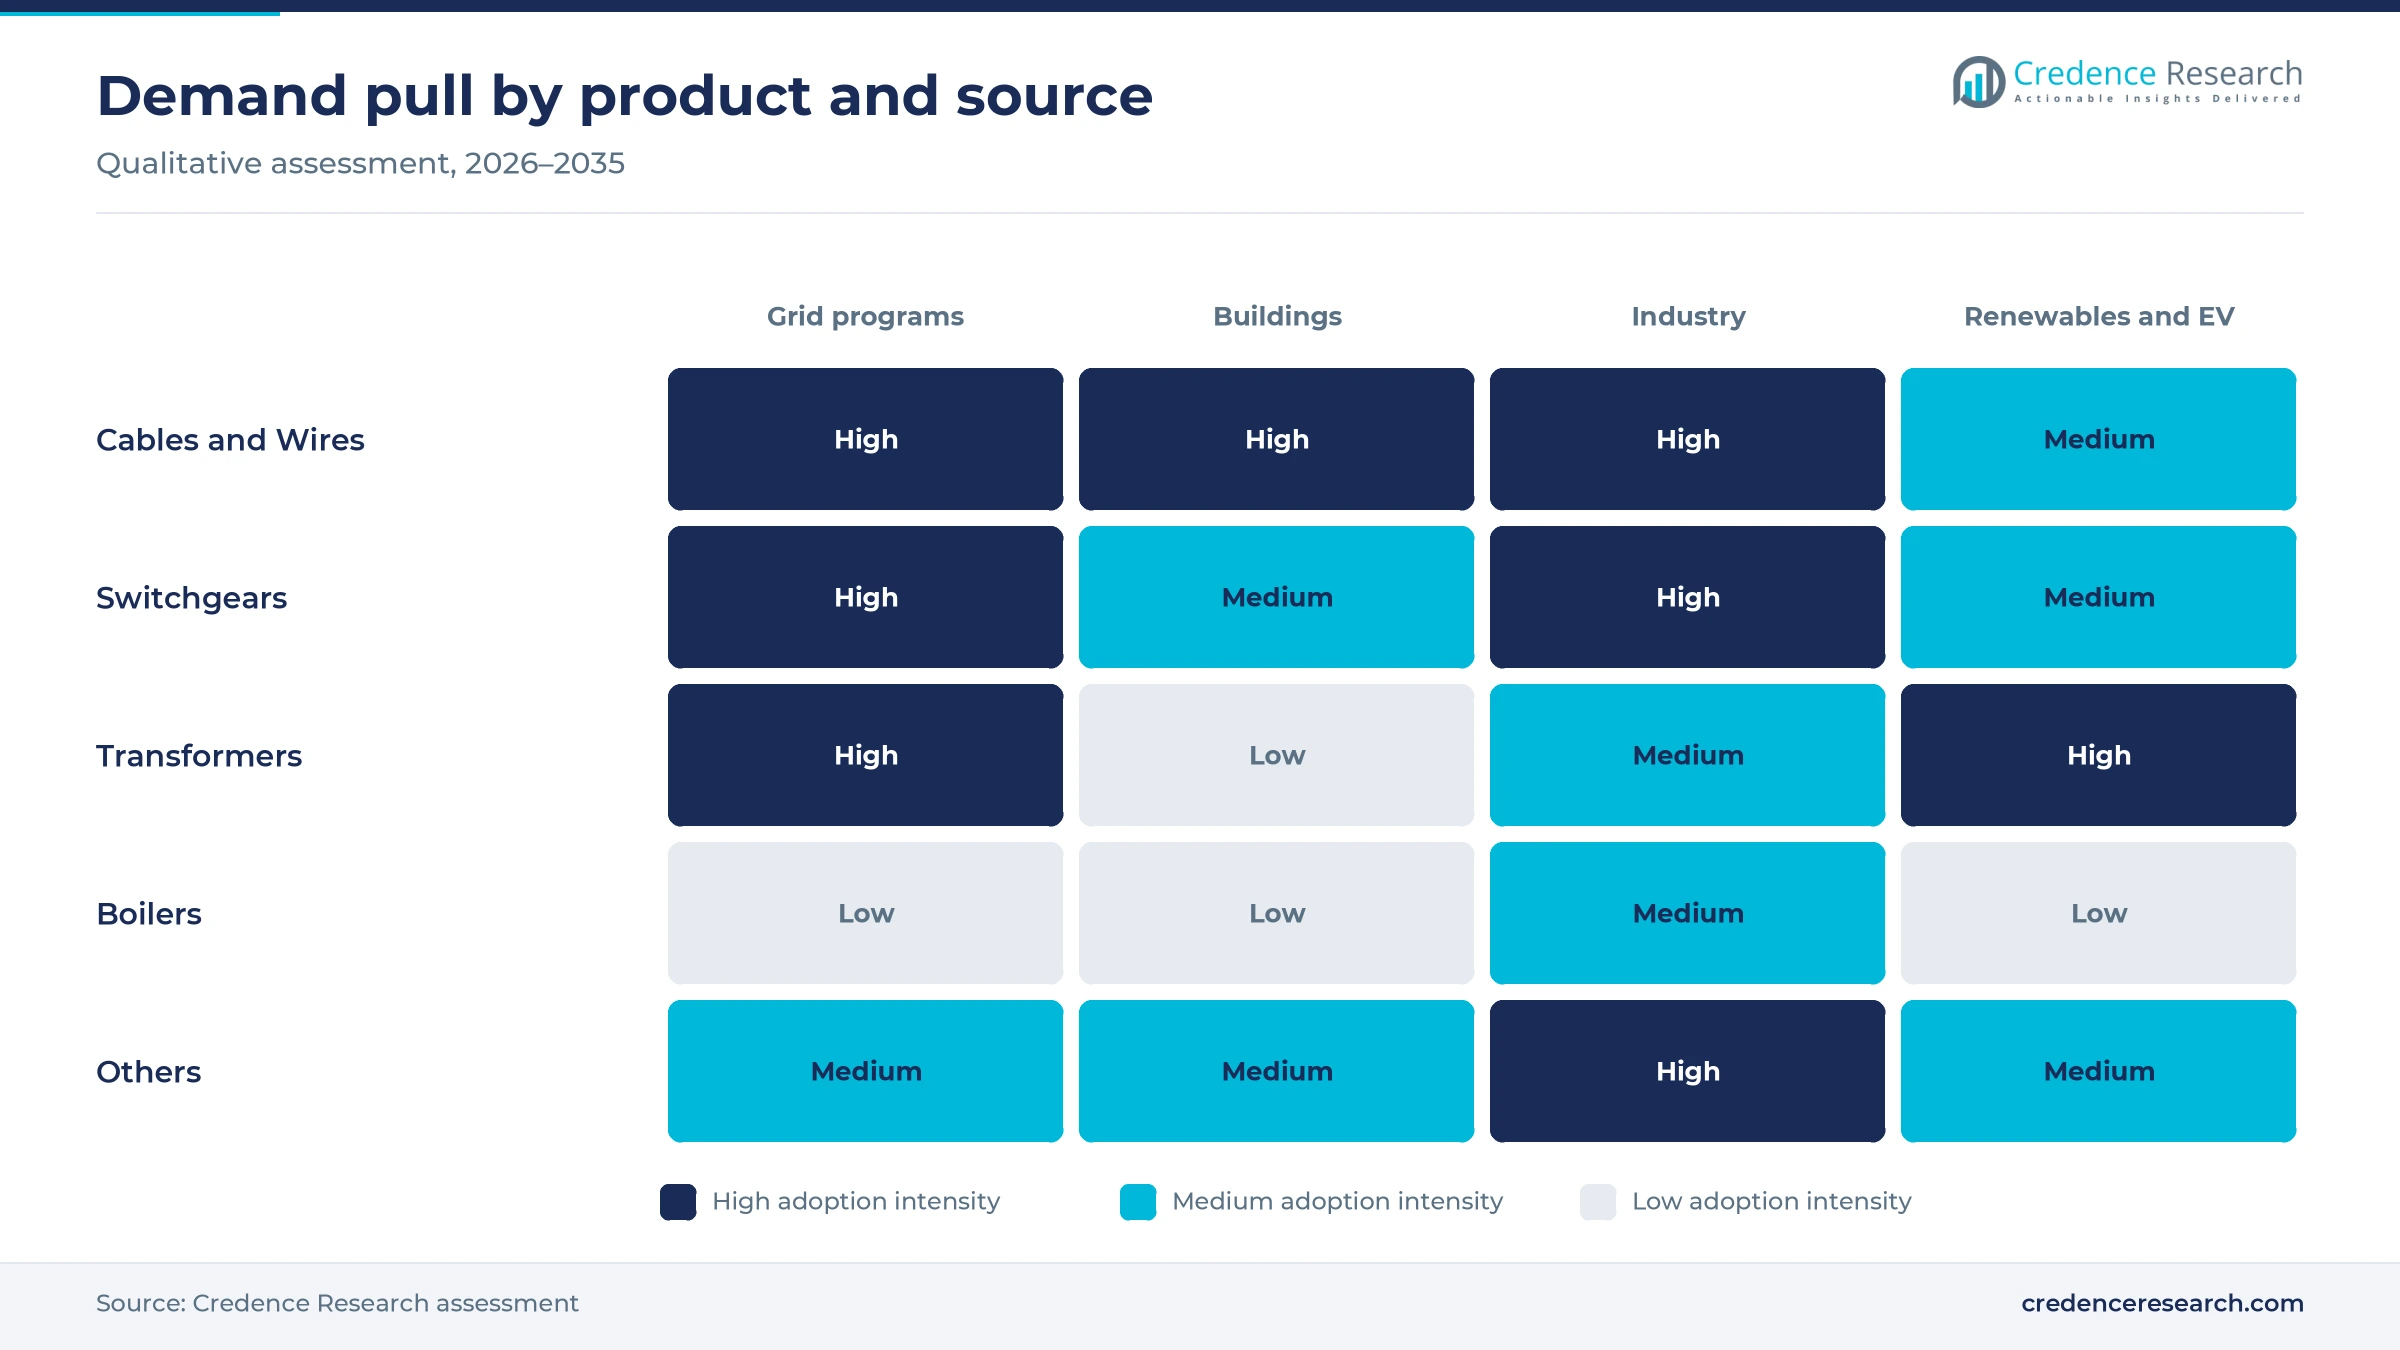
Smart meter rollouts reach distribution company budgets
The metering program matters because it brings new distribution hardware and forces utilities to modernize feeders at the same time. Power Minister Manohar Lal told the Lok Sabha that 49.3 million smart meters were installed by December 2025, against more than 200 million sanctioned under the Revamped Distribution Sector Scheme. Only 16 million of those meters ran in prepaid mode at that date, so a long installation runway remains. This work reaches beyond meters, because the Ministry of Power still reports aggregate technical and commercial losses of 16.16%, which gives distribution companies a financial reason to replace weak lines and transformers. As a result, low-tension cable and distribution transformer tenders tend to follow the meter contracts.
Rooftop solar and data centers add new load points
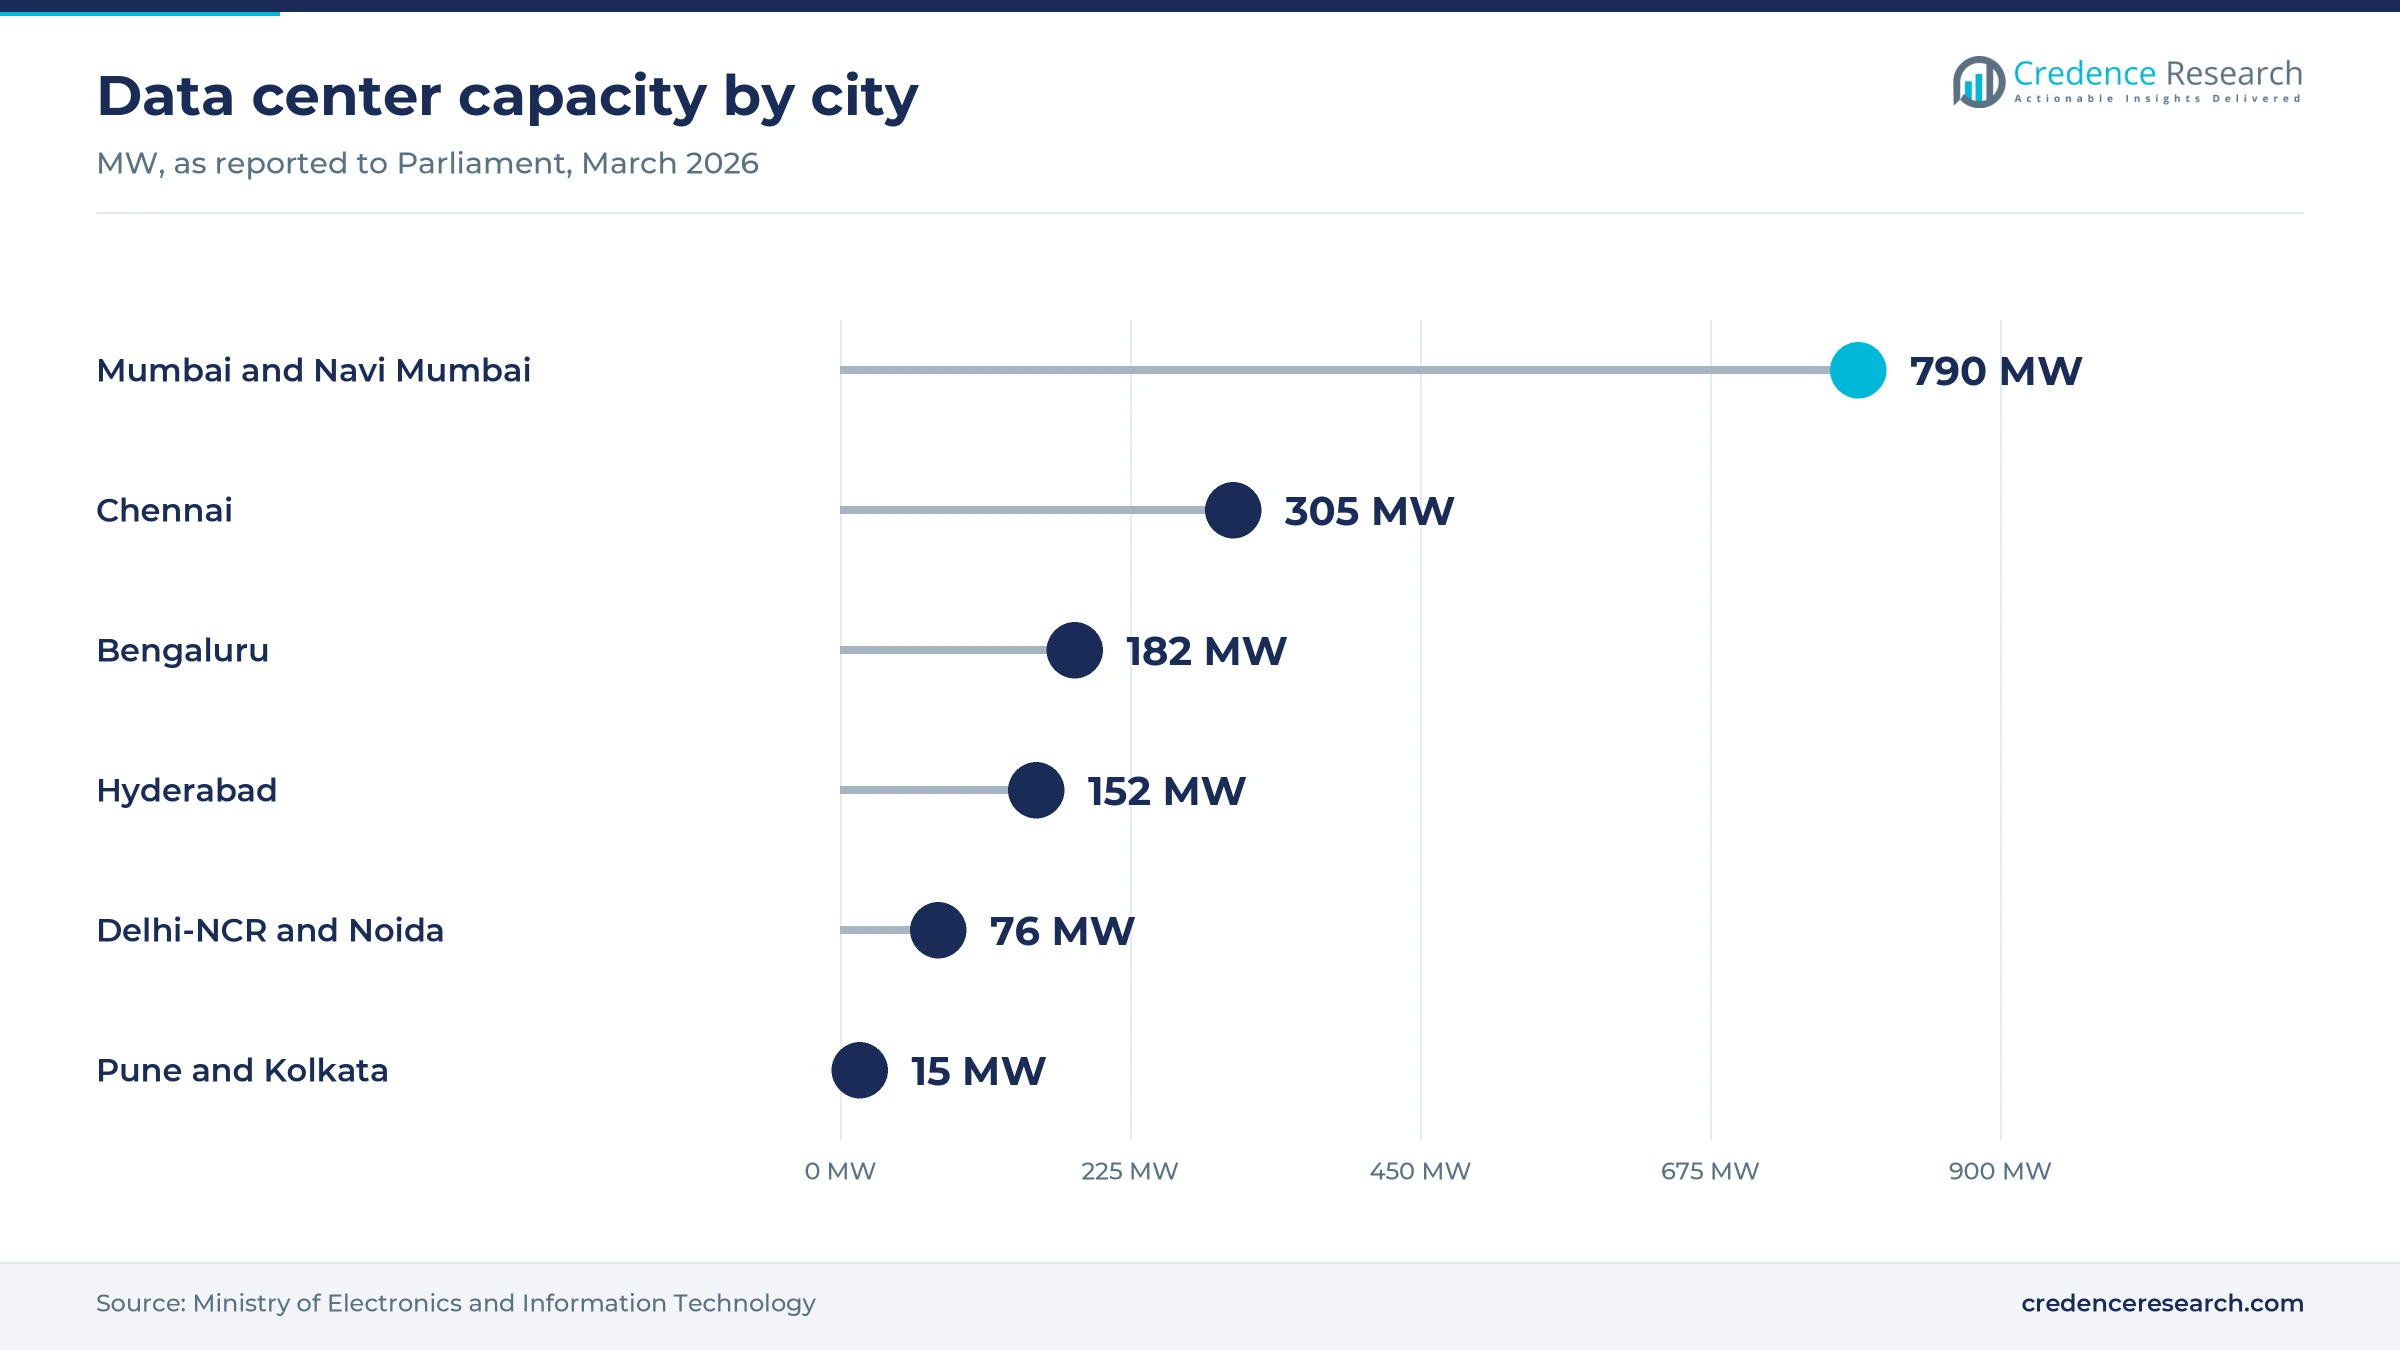
New connection points are spreading, which lifts demand for low-voltage gear outside the traditional utility tender. Minister Pralhad Joshi told the Lok Sabha that PM Surya Ghar had benefited 3.2 million households by March 16, 2026, through about 2.59 million rooftop systems, according to Down To Earth. Each system needs cable, protection devices and solar inverters, although inverters themselves sit outside this estimate. Data centers add heavier loads, since the Ministry of Electronics and Information Technology reported capacity growth from 375 MW in 2020 to more than 1,500 MW in 2025. These sites buy transformers, switchgear and uninterruptible power supply systems in large, repeatable lots.
High-voltage plants and export lanes reshape supply
Shift toward long-dated high-voltage plant commitments
Transformer makers are now committing capital for capacity that arrives years out, which suggests they read the shortage as structural. Siemens Energy India said in February 2026 that the new plant would lift large power transformer capacity to around 60,000 MVA, according to Energetica India. Hitachi Energy India approved a further Rs 2,000 crore in May 2026, including a plant at Karjan in Vadodara district, according to T&D India. Its wider transformer expansion adds 20,000 square meters of production and testing space. Hitachi also laid the foundation for a bushings factory at Halol, scheduled to start production in 2026, which it expects to roughly quadruple national dry bushing capacity for EHV and UHV units. In turn, buyers should expect domestic supply of critical parts to improve before finished transformer lead times do.
Rise of switchgear capacity tied to local sourcing
Switchgear suppliers are moving more design and component work into the country, which lowers exposure to imported parts. ABB said in March 2026 that it would invest about USD 75 million that year, including USD 22 million at Nashik for circuit breakers, a larger vacuum interrupter factory and 33 kV gas-insulated switchgear by 2028. The company also stated that about 85% of what it sells locally is made locally. Schneider Electric Infrastructure plans to raise panel capacity at Vadodara from 8,000 to 14,000 units and to add 40,000 circuit breakers at a new Dankuni plant, according to Machinist in June 2025. These projects give utility tender buyers a wider choice of qualified domestic sources.
Opening for exports beyond neighboring markets
Exports offer makers a second demand base when domestic tenders slow, and the starting point is already meaningful. IEEMA reported about 17% annual export growth in rupee terms over five years, and it expects exports to rise 2.5 times within seven years, according to KNN in January 2024. Polycab now serves customers in 94 countries, according to its May 2026 results, which shows how far cable brands have traveled. Schneider Electric Infrastructure has said its new Dankuni breaker output will serve international as well as domestic buyers. The opening is largest for firms that hold global product approvals, since tender buyers abroad demand them before quality or price enter the discussion.
Opening for charging and retail channel expansion
Charging infrastructure and retail channels remain underbuilt, which gives low-voltage brands a volume opening beyond utilities. Parliament replies reported by Down To Earth show 9,159 of 9,332 FAME-II public charging stations installed by Jan. 1, 2026, so the earlier program is nearly finished and the larger PM E-Drive network comes next. Stronger brands are gaining ground, since Polycab said its domestic share rose by roughly 3% to 4% in fiscal 2026, while old hubs stay influential, as The Daily Pioneer counted about 5,000 shops around Delhi’s Bhagirath Palace in 2018. Havells is taking its Alwar cable investment to Rs 715 crore, with expanded capacity due by September 2026, according to Wire & Cable India. As a result, brands with dealer finance and local stock should win share from unbranded sellers.
Copper, compliance and slow lines test supplier margins
How does the copper price squeeze cable makers?
Copper is the largest cost risk for cable makers, because the metal is a key raw material for every conductor they sell. Kotak Neo reported three-month London Metal Exchange copper at USD 14,396 a metric ton on Aug. 17, 2026, close to the USD 14,527.50 record and up nearly 16% that year. Smaller makers feel this first, since they carry less pricing power with dealers. Stronger brands reprice lists more often, while institutional buyers increasingly ask for metal-linked contracts.
Certification deadlines can catch smaller producers out
Mandatory certification raises the cost of staying in the market, particularly for small workshops making regulated items. The Ministry of Heavy Industries extended phases of its Electrical Equipment Quality Control Order on May 5, 2025, moving the deadline from May 10 to Nov. 10, 2025. That extension shows producers needed more time for testing and licensing. Smaller makers therefore face testing queues and fees, and some are likely to shift into contract supply for licensed brands.
Why do transmission delays push back equipment orders?
Line construction often runs behind plan, which delays equipment deliveries that depend on corridor completion. The Ministry of Power reported 6,511 circuit km of lines added during 2025, while T&D India reported a revised fiscal 2025 target of 15,253 circuit km, though the two periods differ. Right-of-way disputes remain part of the problem, so the ministry revised compensation guidelines to 200% of land value for tower bases. Suppliers then carry finished stock longer, and they increasingly negotiate milestone payments to protect working capital.
New plants arrive after the demand they were built for
Capacity arrives late, because high-voltage factories take years to qualify and ramp, leaving a gap that buyers must bridge with imports or longer waits. Siemens Energy India expects its approved expansion to begin operating only between 2030 and 2032, according to Energetica India in February 2026. Utilities planning substations before then cannot count on that output. Many are therefore splitting orders among several approved vendors and placing framework contracts earlier, which raises their planning burden and ties up tender budgets.
West India anchors supply as South India adds load
| Region | Value, 2025 (USD billion) | Share, 2025 | CAGR, 2026–2035 |
|---|---|---|---|
| West India | 13.51 | 35.0% | 9.66% |
| North India | 9.65 | 25.0% | 9.26% |
| South India | 9.26 | 24.0% | 10.36% |
| East & Central India | 6.18 | 16.0% | 10.06% |
West India holds the largest manufacturing base
West India held 35.0% of 2025 value and grows at 9.66% a year, helped by dense industrial buying and a strong plant cluster. ABB’s Nashik and Vadodara sites and Hitachi Energy’s Vadodara project all sit here, while KEI Industries began commercial production at Sanand in December 2025, according to Wire & Cable India. Wikipedia describes Mumbai’s Lohar Chawl as the city’s largest wholesale market for electrical goods, and Mumbai and Navi Mumbai host 790 MW of data center capacity, according to the IT ministry.
North India pairs state demand with a wholesale hub
North India held 25.0% of 2025 value and grows at 9.26% a year, with regional peak demand of 80,980 MW in the first seven months of fiscal 2024, according to T&D India. Havells is expanding cable output at Alwar in Rajasthan, which puts more low-voltage supply near northern contractors. Delhi’s Bhagirath Palace, described by The Daily Pioneer as Asia’s biggest electrical market, still shapes trade pricing for lighting, switches and wiring across neighboring states. Delhi-NCR and Noida held 76 MW of data center capacity, so that source of demand remains small.
South India adds load fastest across three cities
South India held 24.0% of 2025 value and is the fastest-growing zone at 10.36% a year, because new digital and industrial loads are concentrating there. Chennai, Bengaluru and Hyderabad together account for 639 MW of data center capacity, according to figures the IT ministry gave Parliament in March 2026. ABB is investing USD 35 million across its Bengaluru sites in low-voltage drives, motors and UPS production. BHEL’s 3x800 MW Telangana order from NTPC also adds boiler and turbine demand.
East and Central India rely on thermal and new breaker plants
East & Central India held 16.0% of 2025 value and grows at 10.06% a year, supported by pithead thermal projects and new plant investment. BHEL holds a 3x800 MW contract from NLC India at Jharsuguda in Odisha, reported by EPC World in January 2024, which covers boilers, turbines and generators. Schneider Electric announced new factories including one in Kolkata in February 2025, according to Telangana Today. Together these projects bring more local supply to a zone that has long bought from western plants.
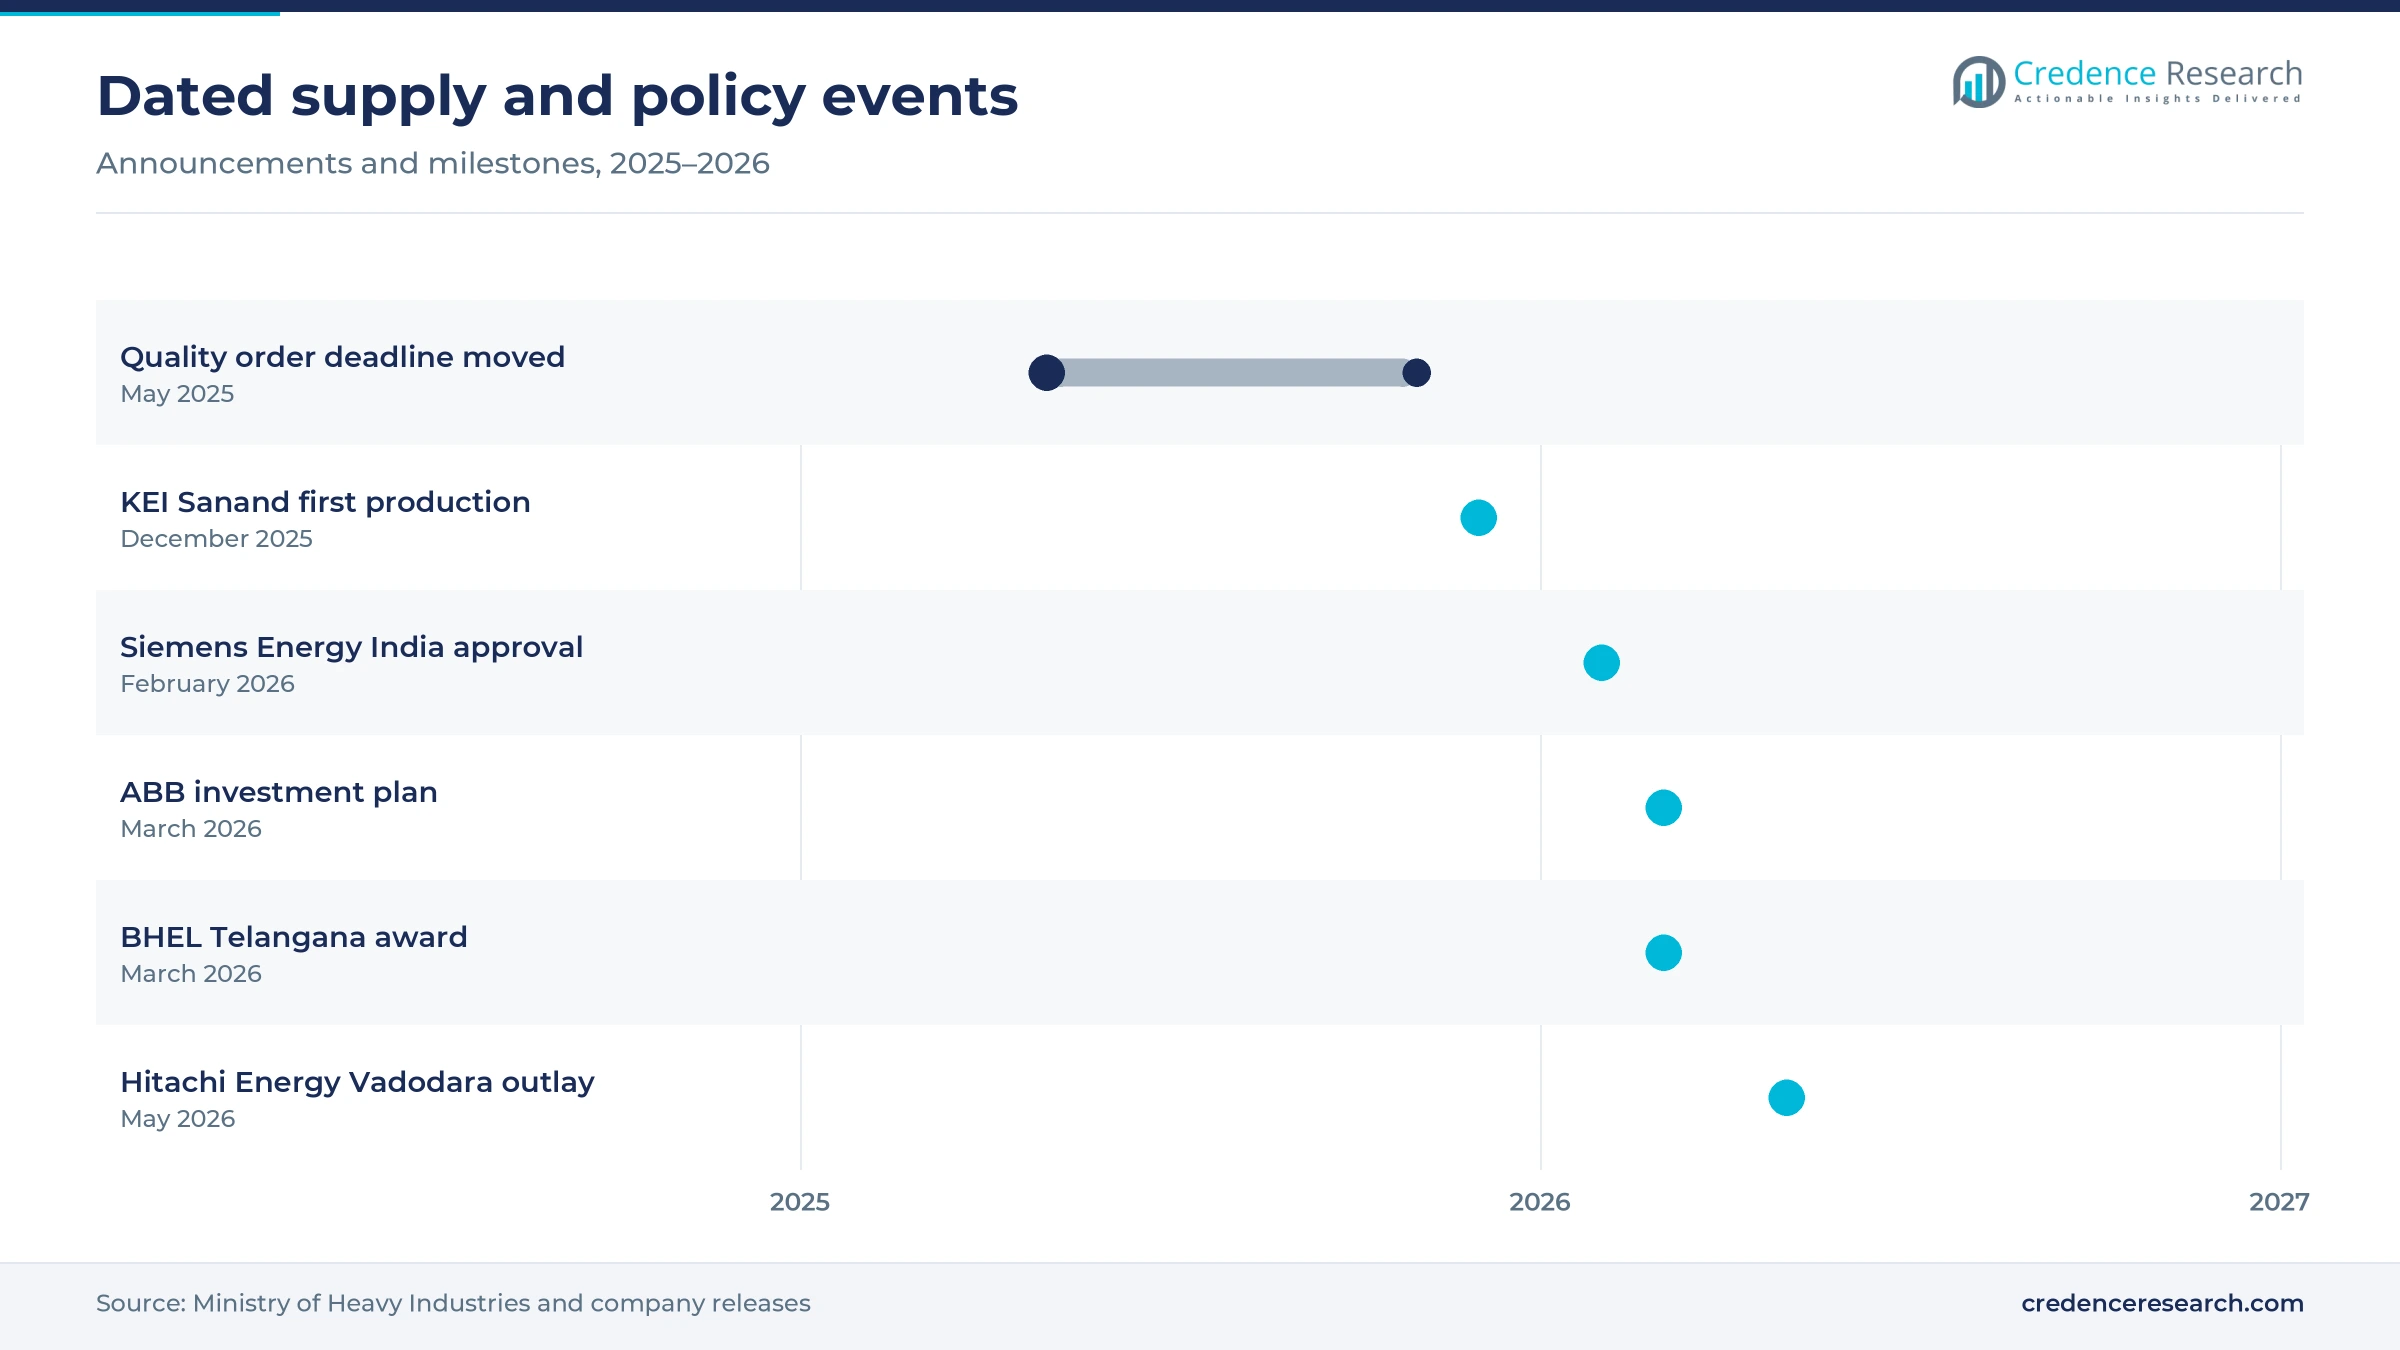
Dated plant, order and rule changes from 2025 to 2026
| Development | Status and market relevance |
|---|---|
| In May 2025, the Ministry of Heavy Industries extended a Quality Control Order deadline for listed equipment to November 2025. | In force; narrows the market for uncertified products |
| In December 2025, KEI Industries began the first phase of commercial production at its greenfield Sanand cable plant. | Operating; adds western cable supply |
| In February 2026, Siemens Energy India approved about Rs 2,060 crore for a new large power transformer factory. | Approved; output expected between 2030 and 2032 |
| In March 2026, BHEL received a Notification of Award from NTPC for the 3x800 MW Telangana Stage-II thermal project. | Awarded; supports boiler and turbine demand |
| In May 2026, Hitachi Energy India approved a further Rs 2,000 crore, including a Karjan transformer plant, taking cumulative capital spending to Rs 4,000 crore. | Announced; expands high-voltage transformer supply |
Four product shifts are changing what utilities specify
- Gas-insulated switchgear is moving into local production, as ABB plans to localize 33 kV primary units and SF6-free technology by 2028.
- Dry transformer bushings are being localized at the Halol factory, which should reduce reliance on imported EHV and UHV parts.
- Biomass co-firing boilers now appear in new thermal specifications, including those for the Jharsuguda units that BHEL is supplying to NLC India.
- Prepaid smart meters are changing distribution design, because utilities can use the data to find losses on weak feeders and plan upgrades.
Need a Custom Version of This Report?
Tailor the scope, geography, or segments to your exact requirements.
- Custom geography or segment scope
- Direct access to our analyst team
Cable brands and grid specialists compete on separate turf
Competition splits into two groups that rarely meet in the same tender. Cable and low-voltage brands such as Polycab, RR Kabel, KEI Industries and Havells compete on dealer reach, brand recall and the ability to pass through metal costs. Grid specialists such as Hitachi Energy India, Siemens Energy India, ABB India and Schneider Electric India compete on type-tested designs, utility approvals and delivery slots, which have become scarce for large units. BHEL stands apart because it supplies boilers, turbines and generators for thermal projects under contracts of several years. Institutional cable sales grew faster than channel sales in the latest quarter at Polycab, according to its May 2026 results, which brings cable brands closer to project buyers. This overlap should grow, because global makers of electrical equipment are pursuing the same utility and data center accounts.
Companies profiled and their roles in this market
| Company | Type | Role in the market |
|---|---|---|
| Polycab India | Cable and wire maker | 26 plants, with dealers and retail outlets nationwide |
| RR Kabel | Cable and wire maker | Expanding at Waghodia and Silvassa |
| KEI Industries | Cable and wire maker | New greenfield unit at Sanand, Gujarat |
| Havells India | Cable and switchgear brand | Expanding cable capacity at Alwar, Rajasthan |
| Bharat Heavy Electricals Limited (BHEL) | Power plant equipment maker | Supplies boilers, turbines and generators for NTPC and NLC India units |
| ABB India | Switchgear and motor maker | Investing at Nashik, Bengaluru and Vadodara |
| Schneider Electric India | Switchgear and breaker maker | Expanding at Vadodara, with a new plant at Dankuni |
| Siemens Energy India | Transformer maker | Approved a new large power transformer factory |
| Hitachi Energy India | Transformer maker | Building at Vadodara and Halol, with Mysuru insulation production |
Transformers and channels look like the strongest positions
Credence Research's view is that the strongest positions sit at the two ends of the supply chain, not in the middle. At one end, transformer makers hold order books that public capacity plans suggest will outlast current factory additions. At the other, cable and switch brands with deep dealer networks can carry price rises that smaller rivals cannot absorb. Mid-sized panel makers face the harder road, because certification costs and metal prices hit them first. The biggest risk to this view is a slower grid program, since the 2025 line additions already ran short of plan.
How the estimate was rebuilt from public production data
The report uses 2025 as the base year and forecasts to 2035. Market values come from the Credence Research model, built top-down from public production and trade indicators and adjusted to exclude batteries, solar modules and power electronics. Segment and regional splits are Credence Research estimates informed by plant locations, public tenders and load data. Sources include ministry replies to Parliament, Central Electricity Authority data, International Energy Agency reports, regulatory notices and company releases. No interviews or surveys were conducted for this edition, and all forecasts are model estimates rather than reported figures.
Load growth to 2035 favors local high-voltage capacity
Load growth should stay firm through the forecast period, because the International Energy Agency expects demand to grow 6.4% a year on average from 2026 to 2030, after a weak 1.4% in 2025. Cooling should drive more than one-fifth of that growth, which keeps pressure on summer peaks and distribution hardware. By 2035, the electrical components market should reach USD 98.31 billion, with transformers and grid equipment taking a larger share as new factories come online. Supply of electrical components should tighten less after 2030, although that depends on projects announced in 2026 arriving on schedule.
Frequently Asked Questions
What is the electrical market size in India?
How fast is the electrical industry growing in India?
Which product category is largest in this market?
Which is the biggest electrical market in India for wholesale buyers?
Which region leads the market?
Who are the major companies in this market?
What are the main risks for manufacturers?
What will drive demand through 2035?
Table of Content
Chapter 1 Market Segmentation
- 1.1 Segmentation Framework
- 1.1.1 Product and Service Classification
- 1.1.2 Application and End-Use Classification
- 1.1.3 Technology and Solution Classification
- 1.1.4 Customer and Distribution Channel Classification
- 1.1.5 Geographic Segmentation
- 1.1.6 Market Segment Definitions and Boundaries
- 1.2 By Product Type
- 1.2.1 Cables and Wires
- 1.2.2 Switchgears
- 1.2.3 Transformers
- 1.2.4 Boilers
- 1.2.5 Others
- 1.3 By Application
- 1.3.1 Transmission and Distribution (T&D)
- 1.3.2 Power Generation
- 1.4 By End User Sector
- 1.4.1 Industrial
- 1.4.2 Residential
- 1.4.3 Commercial
- 1.4.4 Renewable Energy Integration
- 1.4.5 Electric Vehicle Infrastructure
Chapter 2 Introduction
- 2.1 Report Objectives and Scope
- 2.2 Product Definition and Industry Terminology
- 2.3 Market Inclusions and Exclusions
- 2.4 Research Process
- 2.4.1 Primary Research and Expert Interviews
- 2.4.2 Secondary Research and Source Review
- 2.4.3 Top-Down and Bottom-Up Estimation
- 2.4.4 Data Triangulation and Verification
- 2.5 Market Size Measurement Basis
- 2.5.1 2025: USD 38.60 billion → 2035: USD 98.31 billion
- 2.6 Historical and Forecast Reference Periods
- 2.6.1 Historical Period: 2018-2025
- 2.6.2 Base Year: 2025
- 2.6.3 Forecast Period: 2025-2035
- 2.7 Research Assumptions and Limitations
Chapter 3 Executive Summary
- 3.1 Market Snapshot and Key Findings
- 3.2 Base-Year Market Size, 2025
- 3.3 Forecast Market Size, 2035
- 3.4 Revenue and Volume Growth Outlook
- 3.5 Key Demand and Supply Indicators
- 3.6 Leading Market Segments
- 3.7 Fastest-Growing Market Opportunities
- 3.8 Regional Performance Highlights
- 3.9 Technology and Industry Transformation
- 3.10 Competitive Landscape Summary
- 3.11 Analyst View and Strategic Implications
Chapter 4 India Electrical Components Market Trends and Developments
- 4.1 Historical Industry Development, 2018-2025
- 4.2 Recent Market Trends and Developments
- 4.3 Demand and Customer Behavior Trends
- 4.4 Technology and Product Innovation
- 4.5 Artificial Intelligence, Automation and Digitalization
- 4.6 Local Manufacturing and Supply Chain Realignment
- 4.7 Industry Partnerships, Mergers and Acquisitions
- 4.8 Sustainability and Circular Economy Developments
- 4.9 Government and Private Sector Investment Trends
- 4.10 Emerging Business Models and Commercialization
- 4.11 Industry Developments and Announcements
Chapter 5 India Electrical Components Market Production, Supply and Demand Analysis
- 5.1 Demand Trend and Consumption Analysis, 2018-2025
- 5.2 Demand Forecast, 2025-2035
- 5.3 Production and Output Trend, 2018-2025
- 5.4 Production and Output Forecast, 2025-2035
- 5.5 Installed Capacity and Capacity Utilization
- 5.6 Company-Wise Production Plants and Statistics
- 5.6.1 Installed Production Capacity
- 5.6.2 Actual Production
- 5.6.3 Planned Capacity and Expansion Targets
- 5.7 Supply Chain Structure and Procurement Trends
- 5.8 Supply-Demand Gap and Bottlenecks
- 5.9 Import Dependence and Sourcing Structure
- 5.10 Contract Manufacturing and Outsourcing
- 5.11 Regional Supply and Demand Concentration
Chapter 6 India Electrical Components Market Pricing Analysis
- 6.1 Pricing Structure and Measurement
- 6.2 Historical Pricing Trends, 2018-2025
- 6.3 Pricing Outlook, 2025-2035
- 6.4 Average Selling Price and Unit Economics
- 6.5 Pricing by Product and Market Segment
- 6.6 Geographic Pricing Differences
- 6.7 Key Input, Energy, Labor and Logistics Costs
- 6.8 Contract Pricing and Purchasing Models
- 6.9 Pricing Sensitivity and Competitive Positioning
- 6.10 Price, Margin and Profitability Implications
Chapter 7 India Electrical Components Market Dynamics
- 7.1 Market Growth Drivers
- 7.1.1 Demand-Side Drivers
- 7.1.2 Technology and Innovation Drivers
- 7.1.3 Infrastructure and Investment Drivers
- 7.1.4 Regulatory and Policy Drivers
- 7.2 Market Restraints
- 7.2.1 Cost and Affordability Constraints
- 7.2.2 Technology and Adoption Barriers
- 7.2.3 Supply Chain and Operational Constraints
- 7.3 Market Challenges
- 7.3.1 Competitive Pressure and Margin Erosion
- 7.3.2 Skills, Infrastructure and Implementation Gaps
- 7.4 Emerging Market Opportunities
- 7.5 Market Dynamics Impact and Time-Horizon Assessment
Chapter 8 India Electrical Components Value Chain Analysis
- 8.1 Industry Value Chain Overview
- 8.2 Upstream Suppliers and Critical Inputs
- 8.3 Technology and Component Providers
- 8.4 Manufacturing or Service Delivery
- 8.5 Distribution, Channel Partners and Integrators
- 8.6 Downstream Applications and End Users
- 8.7 Value Addition and Profit Pools
- 8.8 Vertical Integration and Outsourcing
- 8.9 Supplier Concentration and Risk
- 8.10 Supply Chain Localization and Resilience
Chapter 9 India Electrical Components Market Regulations and Policies
- 9.1 Relevant Laws, Standards and Compliance Frameworks
- 9.2 Product, Service, Safety and Quality Requirements
- 9.3 Government Policies, Incentives and Subsidies
- 9.4 Imports, Exports and Trade Barriers
- 9.5 Public Procurement and Local Content Requirements
- 9.6 Environmental and Sustainability Compliance
- 9.7 Upcoming Policy Changes and Market Implications
Chapter 10 India Electrical Components Market Hotspots and Opportunities
- 10.1 Market Opportunity Mapping and Growth Hotspots
- 10.2 High-Growth Applications and Customer Groups
- 10.3 Underserved Markets and White-Space Opportunities
- 10.4 Emerging Technology and Product Opportunities
- 10.5 New Capacity and Investment Hotspots
- 10.6 Market Entry and Expansion Opportunities
- 10.7 Distribution and Partnership Opportunities
- 10.8 Near-Term and Long-Term Commercial Potential
- 10.9 Opportunity Attractiveness and Execution Risks
Chapter 11 India Electrical Components Market Outlook, 2025-2035
- 11.1 Market Size and Analysis
- 11.1.1 Revenue (Market Measurement: 2025: USD 38.60 billion → 2035: USD 98.31 billion)
- 11.1.2 Market Volume and Quantity Sold
- 11.1.3 Historical Market Size, 2018-2025
- 11.1.4 Base-Year Market Size, 2025
- 11.2 Market Forecast, 2025-2035
- 11.2.1 Revenue Forecast to 2035
- 11.2.2 Volume Forecast to 2035
- 11.2.3 CAGR and Year-on-Year Growth
- 11.2.4 Incremental Revenue Opportunity
- 11.3 Forecast Assumptions and Scenario Analysis
- 11.3.1 Base-Case Forecast
- 11.3.2 Optimistic and Conservative Scenarios
- 11.3.3 Technology, Pricing and Policy Sensitivities
- 11.4 Market Attractiveness and Growth Outlook
Chapter 12 India Electrical Components Market Segmentation and Outlook
- 12.1 Segmentation Summary and Market Shares, 2025
- 12.2 Largest and Fastest-Growing Segments
- 12.3 By Product Type - Market Size and Forecast, 2025-2035
- 12.3.1 Segment Definition and Scope
- 12.3.2 Historical Market Size, 2018-2025
- 12.3.3 Revenue Forecast, 2025-2035
- 12.3.4 Volume Forecast, 2025-2035
- 12.3.5 Base-Year Market Share, 2025
- 12.3.6 Segment CAGR and Growth Drivers
- 12.3.7 Subsegment Market Size and Forecast
- 12.3.7.1 Cables and Wires
- 12.3.7.2 Switchgears
- 12.3.7.3 Transformers
- 12.3.7.4 Boilers
- 12.3.7.5 Others
- 12.3.8 Subsegment Pricing and Adoption Trends
- 12.3.9 Leading Suppliers and Competition
- 12.3.10 Regional Demand and Opportunities
- 12.4 By Application - Market Size and Forecast, 2025-2035
- 12.4.1 Segment Definition and Scope
- 12.4.2 Historical Market Size, 2018-2025
- 12.4.3 Revenue Forecast, 2025-2035
- 12.4.4 Volume Forecast, 2025-2035
- 12.4.5 Base-Year Market Share, 2025
- 12.4.6 Segment CAGR and Growth Drivers
- 12.4.7 Subsegment Market Size and Forecast
- 12.4.7.1 Transmission and Distribution (T&D)
- 12.4.7.2 Power Generation
- 12.4.8 Subsegment Pricing and Adoption Trends
- 12.4.9 Leading Suppliers and Competition
- 12.4.10 Regional Demand and Opportunities
- 12.5 By End User Sector - Market Size and Forecast, 2025-2035
- 12.5.1 Segment Definition and Scope
- 12.5.2 Historical Market Size, 2018-2025
- 12.5.3 Revenue Forecast, 2025-2035
- 12.5.4 Volume Forecast, 2025-2035
- 12.5.5 Base-Year Market Share, 2025
- 12.5.6 Segment CAGR and Growth Drivers
- 12.5.7 Subsegment Market Size and Forecast
- 12.5.7.1 Industrial
- 12.5.7.2 Residential
- 12.5.7.3 Commercial
- 12.5.7.4 Renewable Energy Integration
- 12.5.7.5 Electric Vehicle Infrastructure
- 12.5.8 Subsegment Pricing and Adoption Trends
- 12.5.9 Leading Suppliers and Competition
- 12.5.10 Regional Demand and Opportunities
- 12.6 Segment Growth Comparison
- 12.7 Segment Attractiveness and Priority Matrix
Chapter 13 India Electrical Components End-Use and Application Market Outlook
- 13.1 End-Use Industry and Customer Demand Structure
- 13.2 Leading Applications and Customer Groups
- 13.3 End-Use Market Size, Share and Forecast
- 13.4 Major End-Use Industry Deep Dives
- 13.4.1 Customer Requirements and Use Cases
- 13.4.2 Demand and Replacement Cycles
- 13.4.3 Technical and Regulatory Considerations
- 13.4.4 Purchasing and Procurement Models
- 13.4.5 Leading Vendors and Distribution Channels
- 13.4.6 Forecast and Commercial Opportunities
- 13.5 Emerging Applications and Cross-Segment Demand
- 13.6 End-Use Industry Investment Priorities
Chapter 14 India Electrical Components Geographic Market Outlook, 2025-2035
- 14.1 Domestic Market Distribution and Demand Clusters
- 14.2 State- or Province-Wise Market Size and Forecast, 2025-2035
- 14.3 City and Metropolitan Market Outlook
- 14.4 Industrial, Manufacturing and Commercial Clusters
- 14.5 Geographic Concentration of Key End Users
- 14.6 Local Pricing and Purchasing Differences
- 14.7 Domestic Production Facilities and Capacity Map
- 14.8 Local Infrastructure and Project Pipeline
- 14.9 State-Level Policy and Incentive Differences
- 14.10 Subnational Investment Hotspots and Opportunities
- 14.11 Distribution and Logistics Networks
- 14.12 Domestic Competitive Footprint
Chapter 15 India Electrical Components Technology, Innovation and Sustainability Outlook
- 15.1 Technology Landscape and Maturity
- 15.2 Product, Process and Service Innovation
- 15.3 AI, Automation and Digital Tools in the Industry
- 15.4 Technology Adoption and Performance Benchmarking
- 15.5 Innovation Pipeline and R&D Investment
- 15.6 Patent and Intellectual Property Trends
- 15.7 Energy Efficiency and Resource Management
- 15.8 Sustainability, Recycling and Circularity
- 15.9 Technology Roadmap, 2025-2035
- 15.10 Risks of Obsolescence and Technology Substitution
Chapter 16 India Electrical Components Market Key Strategic Imperatives
- 16.1 Growth and Market Entry Priorities
- 16.2 High-Return Products and Segments
- 16.3 Pricing, Profitability and Cost Optimization
- 16.4 Technology Investment and Product Differentiation
- 16.5 Supply Chain Localization and Resilience
- 16.6 Distribution and Customer Acquisition
- 16.7 Partnership, Acquisition and Capacity Strategy
- 16.8 Regional Expansion Priorities
- 16.9 Short-, Medium- and Long-Term Actions
Chapter 17 Competition Outlook
- 17.1 Industry Competition Characteristics
- 17.2 Market Structure and Concentration
- 17.3 Market Share and Competitive Positioning, 2025
- 17.4 Company-Wise Revenue and Product Benchmarking
- 17.5 Production and Service Capacity Benchmarking
- 17.6 Technology, Pricing and Differentiation
- 17.7 Regional Footprint and Distribution Strength
- 17.8 Mergers, Acquisitions and Strategic Alliances
- 17.9 New Entrants and Competitive Threats
- 17.10 Porter's Five Forces and Industry Attractiveness
- 17.11 Competitive Outlook, 2025-2035
Chapter 18 Company Profiles
- 18.1 Company Coverage and Selection Criteria
- 18.2 Polycab India
- 18.2.1 Business Description
- 18.2.2 Company Ownership and Geographic Presence
- 18.2.3 Product and Service Portfolio
- 18.2.4 Manufacturing and Operating Footprint
- 18.2.5 Production Capacity and Expansion Plans
- 18.2.6 Financial Performance and Investment
- 18.2.7 Market Share and Competitive Position
- 18.2.8 Technology and Innovation Capabilities
- 18.2.9 Strategic Alliances or Partnerships
- 18.2.10 Recent Developments
- 18.2.11 Growth Strategy and Outlook
- 18.3 RR Kabel
- 18.4 KEI Industries
- 18.5 Havells India
- 18.6 Bharat Heavy Electricals Limited (BHEL)
- 18.7 ABB India
- 18.8 Schneider Electric India
- 18.9 Siemens Energy India
- 18.10 Hitachi Energy India
- 18.11 Other Relevant Market Participants
Note: Every listed company is profiled on the structure shown under the first company. The company list is preliminary and may change based on research findings, market developments, data availability and client requirements.
Chapter 19 Disclaimer
- 19.1 Research and Forecast Disclaimer
- 19.2 Data Source and Estimation Limitations
Note: The depth of individual sections depends on data availability for this market. Volume, capacity, trade and other unit-based metrics are included where applicable.

