
Market Overview:
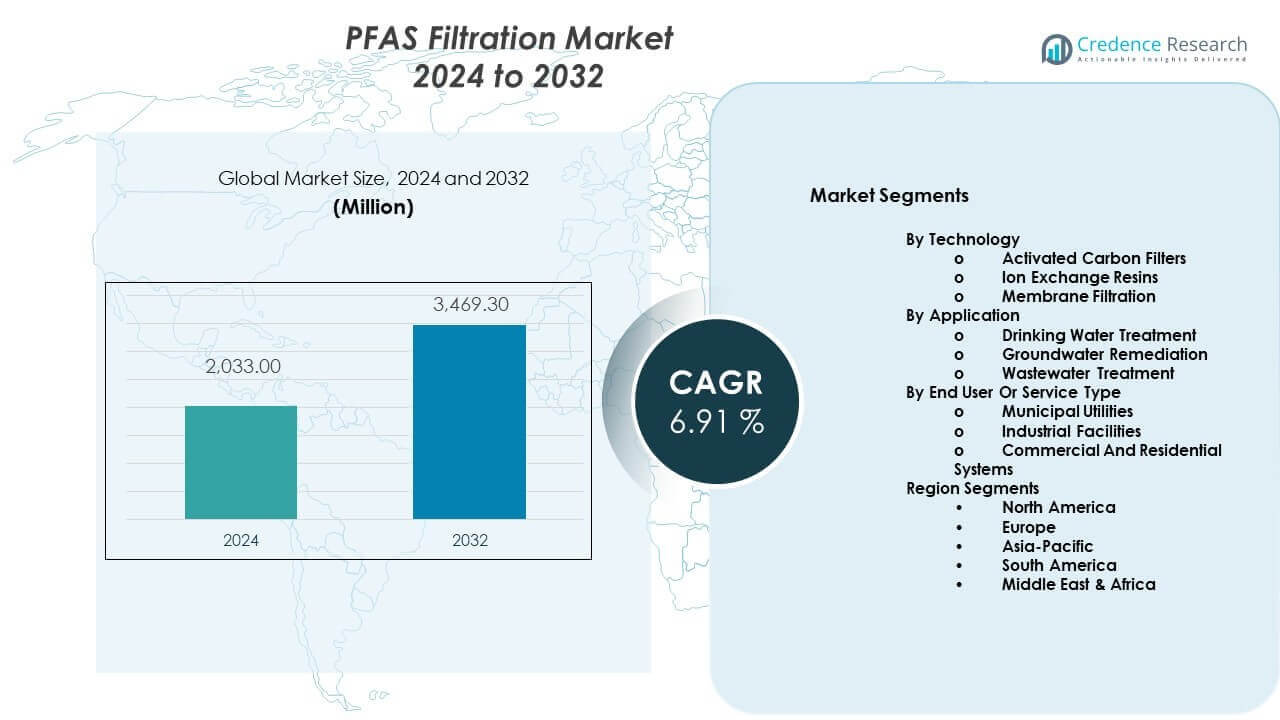
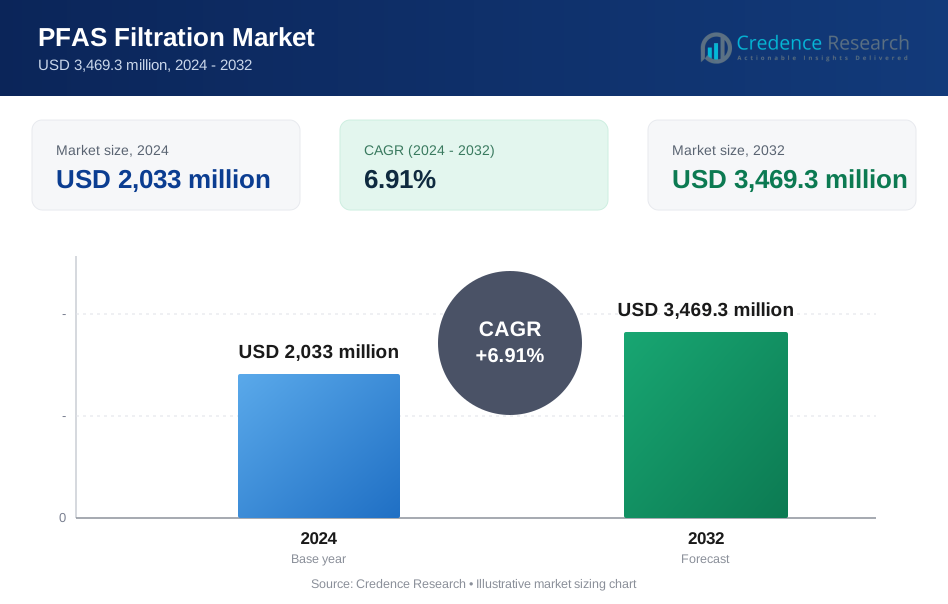
The PFAS filtration market is projected to grow from USD 2,033 million in 2024 to an estimated USD 3,469.3 million by 2032, with a CAGR of 6.91% from 2024 to 2032.
| REPORT ATTRIBUTE | DETAILS |
|---|---|
| Historical Period | 2020-2023 |
| Base Year | 2024 |
| Forecast Period | 2025-2032 |
| PFAS Filtration Market Size 2024 | USD 2,033 million |
| PFAS Filtration Market, CAGR | 6.91% |
| PFAS Filtration Market Size 2032 | USD 3,469.3 million |
Growth comes from rising concern over PFAS health risks. Governments tighten drinking water and wastewater rules worldwide. Utilities invest in advanced filtration to meet new limits. Industrial sites also face strict discharge rules. Activated carbon, ion exchange, and membrane systems see wider use. Public awareness increases testing across municipal systems. Infrastructure upgrades support steady demand growth. Industrial cleanup projects add long-term volume. Private wells testing also expands. Technology advances improve removal efficiency. Cost reduction supports broader adoption. These combined drivers keep demand strong across sectors.
North America leads due to strict regulations and high testing rates. The United States drives adoption across municipal and industrial systems. Europe follows with strong policy support and public funding. Countries like Germany and France expand water treatment upgrades. Asia-Pacific emerges as a fast-growth region. Industrialization raises contamination concerns across China and India. Urban water projects increase filtration needs. Emerging regions invest slowly but steadily. Regulatory alignment improves future adoption.
Market Insights:
- The PFAS filtration market was valued at USD 2,033 million in 2024 and is projected to reach USD 3,469.3 million by 2032, growing at a CAGR of 6.91% during the forecast period.
- North America leads with about 38% share due to strict regulations, Europe follows with nearly 28% driven by strong policy support, and Asia-Pacific holds around 22% supported by rapid industrialization and urban water projects.
- Asia-Pacific is the fastest-growing region with roughly 22% share, supported by expanding industrial activity, rising contamination awareness, and new water infrastructure investments.
- By technology, activated carbon filters account for nearly 45% share due to wide municipal use, while ion exchange resins hold about 35% supported by high selectivity needs.
- By application, drinking water treatment leads with around 50% share, followed by groundwater remediation at nearly 30%, driven by legacy site cleanup programs.
Market Drivers:
Stricter Drinking Water Regulations And Enforcement Frameworks
The PFAS filtration market gains strength from tighter drinking water standards worldwide. Governments define lower allowable PFAS limits. Regulators enforce compliance timelines across utilities. Municipal operators face legal and public pressure. Infrastructure upgrades become mandatory for many systems. Compliance gaps raise enforcement risks. Public agencies allocate budgets for filtration upgrades. It benefits from sustained regulatory oversight. Long-term rule stability supports planning confidence.
- For instance, the U.S. EPA set enforceable limits of 4 parts per trillion for PFOA and PFOS in 2024, forcing utilities to upgrade treatment systems. Public agencies allocate budgets for filtration upgrades. Long-term rule stability supports planning confidence.
Rising Public Health Awareness And Toxicity Evidence
Scientific studies link PFAS exposure to health risks. Media coverage raises public concern sharply. Communities demand safer water supplies. Consumer advocacy groups influence policy decisions. Utilities respond to reputational risks. Industrial polluters face social scrutiny. Testing programs expand nationwide. It sees demand from affected communities. Health-driven urgency accelerates procurement cycles.
- For instance, CDC and ATSDR studies confirmed PFAS bioaccumulation in over 97% of Americans tested, intensifying public pressure. Testing programs expand nationwide. Health-driven urgency accelerates procurement cycles.
Industrial Effluent Controls And Liability Pressure
Industries face strict discharge permits for PFAS compounds. Non-compliance leads to heavy penalties. Cleanup obligations extend across legacy sites. Legal claims increase remediation activity. Manufacturers adopt filtration at source points. Wastewater reuse projects require advanced treatment. Insurance firms push risk mitigation. The PFAS filtration market benefits from liability avoidance. Corporate ESG goals reinforce adoption.
Aging Water Infrastructure And Upgrade Requirements
Many regions rely on outdated water systems. Legacy plants lack PFAS removal capacity. Replacement cycles align with filtration upgrades. Federal funding supports modernization plans. Urban expansion stresses existing networks. Rural systems seek modular solutions. Emergency contamination events force rapid action. It gains from replacement-driven demand. Capital planning cycles ensure steady installations.
Market Trends:
Shift Toward Multi-Stage And Hybrid Filtration Systems
System designers prefer layered treatment approaches. Hybrid setups improve removal reliability. Activated carbon pairs with ion exchange units. Membrane polishing gains traction downstream. Utilities seek redundancy in critical assets. Performance validation becomes more data-driven. Vendors promote integrated system designs. The PFAS filtration market reflects system-level optimization. Procurement favors turnkey solution providers.
- For instance, Xylem deployed multi-stage PFAS systems combining GAC and ion exchange that achieved over 99% PFAS removal in U.S. municipal pilots. Vendors promote integrated system designs. Procurement favors turnkey solution providers.
Growth Of Mobile And Temporary Treatment Deployments
Short-term contamination events drive mobile solutions. Emergency response units deploy rapidly. Construction projects use temporary filtration skids. Military bases prefer relocatable systems. Pilot testing supports long-term plant design. Leasing models reduce upfront costs. Service contracts gain importance. It adapts to flexible deployment needs. Speed of installation becomes a key metric.
- For instance, Calgon Carbon supplied mobile GAC units to U.S. Air Force bases, treating millions of gallons daily during PFAS remediation. Leasing models reduce upfront costs. Speed of installation becomes a key metric.
Technology Focus On Media Longevity And Regeneration
Operators demand longer media life cycles. Regeneration reduces operating expenses. Suppliers invest in improved resin chemistries. Spent media disposal faces tighter rules. Performance guarantees influence purchasing decisions. Lifecycle cost analysis guides selection. Vendors highlight replacement intervals. The PFAS filtration market values durability gains. Efficiency metrics drive competitive differentiation.
Digital Monitoring And Compliance Reporting Integration
Utilities adopt real-time monitoring tools. Sensors track breakthrough events accurately. Data platforms support audit readiness. Automated alerts reduce operational risk. Remote system oversight gains acceptance. Reporting software aligns with regulators. Asset management improves maintenance planning. It benefits from digital integration trends. Smart systems attract public funding support.
Market Challenges Analysis:
High Capital And Operating Cost Burden For Utilities
Advanced filtration requires major capital outlay. Smaller utilities face budget constraints. Media replacement adds recurring expenses. Disposal costs raise total ownership burden. Rate increases meet public resistance. Funding approvals face long cycles. Procurement delays slow deployments. The PFAS filtration market faces affordability barriers. Cost justification remains a key hurdle.
Complexity Of PFAS Chemistry And Performance Validation
PFAS includes thousands of compound variants. Removal efficiency varies by chemistry. Testing standards lack full harmonization. Breakthrough detection remains challenging. Site-specific water quality affects outcomes. Operators require deep technical expertise. Validation protocols add time to deployments. It faces uncertainty in performance prediction. Regulatory gaps create operational ambiguity.
Market Opportunities:
Rapid Expansion Of Decentralized And Point-Of-Use Solutions
Demand rises for household and building-level filtration units. Property owners seek quick protection tools. Municipal gaps create new private markets. Manufacturers design compact high-efficiency systems. Rural regions adopt point-of-entry units. Commercial sites invest in preventive systems. Public concern accelerates adoption. The PFAS filtration market benefits from decentralization.
Growing Investment In Remediation And Industrial Cleanup Programs
Governments fund long-term PFAS remediation programs. Industrial operators invest in soil and groundwater cleanup. Engineering firms secure multi-year contracts. Technology firms introduce advanced systems for complex sites. Brownfield restoration creates new demand. Legal settlements unlock cleanup budgets. New projects support steady growth. It gains traction from large-scale remediation spending.
Market Segmentation Analysis:
By Technology
Activated carbon filters hold strong adoption due to proven PFAS adsorption capacity. Utilities favor carbon systems for ease of deployment and retrofit compatibility. Ion exchange resins gain traction where higher selectivity and longer service life matter. These resins suit sites with strict discharge limits. Membrane filtration supports advanced treatment stages that demand high removal efficiency. Reverse osmosis and nanofiltration serve complex contamination profiles. Technology choice depends on water chemistry and lifecycle cost. The PFAS filtration market reflects varied technology fit across use cases.
- For instance, DuPont’s AmberLite™ P2 resin demonstrated extended PFAS breakthrough times versus GAC in U.S. field trials. Membrane filtration supports advanced treatment stages demanding high removal efficiency. Technology choice depends on water chemistry and lifecycle cost.
By Application
Drinking water treatment represents the primary application focus. Public water systems face strict compliance deadlines. Groundwater remediation supports cleanup of legacy industrial sites. Remedial projects require flexible and site-specific solutions. Wastewater treatment adoption grows due to tighter discharge permits. Industrial reuse projects also drive filtration demand. Application growth links closely to regulatory oversight and contamination exposure.
- For instance, AECOM-led remediation projects at U.S. industrial sites integrated PFAS filtration into groundwater pump-and-treat systems. Application growth links closely to regulatory oversight and contamination exposure.
By End User Or Service Type
Municipal utilities account for a major share of installations. Public agencies prioritize compliance and public safety. Industrial facilities invest to manage liability and meet permit conditions. Sectors with chemical and manufacturing exposure lead demand. Commercial and residential systems expand with rising consumer awareness. Point-of-use and point-of-entry solutions gain traction. It benefits from broad end-user participation across scales.
Segmentation:
By Technology
- Activated Carbon Filters
- Ion Exchange Resins
- Membrane Filtration
By Application
- Drinking Water Treatment
- Groundwater Remediation
- Wastewater Treatment
By End User Or Service Type
- Municipal Utilities
- Industrial Facilities
- Commercial And Residential Systems
Region Segments
- North America
- U.S.
- Canada
- Mexico
- Europe
- Germany
- France
- U.K.
- Italy
- Spain
- Rest of Europe
- Asia Pacific
- China
- Japan
- India
- South Korea
- South-east Asia
- Rest of Asia Pacific
- Latin America
- Brazil
- Argentina
- Rest of Latin America
- Middle East & Africa
- GCC Countries
- South Africa
- Rest of the Middle East and Africa
Regional Analysis:
North America
North America holds the largest share of the PFAS filtration market at around 38%. The United States drives most demand due to strict federal and state water standards. Municipal utilities invest heavily in treatment upgrades. Industrial cleanup projects add steady volume. Public funding supports long-term infrastructure plans. High testing intensity sustains replacement demand. It benefits from strong regulatory enforcement.
Europe
Europe accounts for nearly 28% of the PFAS filtration market share. The region enforces precautionary water quality policies. Countries such as Germany, France, and the Netherlands lead adoption. Public awareness supports early filtration deployment. Utilities focus on compliance with evolving EU directives. Industrial discharge controls support system upgrades. It shows stable demand across municipal networks.
Asia-Pacific And Rest Of The World
Asia-Pacific represents about 22% of the PFAS filtration market share. Rapid industrial growth raises contamination risks. China, Japan, and South Korea lead regional adoption. Urban water projects drive new installations. Emerging regulations support future demand growth. South America and Middle East & Africa together hold nearly 12%. These regions invest gradually through pilot and donor-backed projects.
Key Player Analysis:
- Veolia
- Xylem
- DuPont Water Solutions
- AECOM
- Pentair
- Calgon Carbon (Kuraray)
Competitive Analysis:
The PFAS filtration market shows moderate consolidation with strong global players and specialized technology providers. Large firms compete through broad portfolios and integrated water solutions. Technology depth and regulatory expertise shape competitive strength. Companies invest in media performance, system reliability, and lifecycle efficiency. Service capability and project execution influence contract wins. Partnerships with utilities improve market access. Innovation centers on selectivity and durability. Regional presence supports faster response times. It remains competitive through compliance-driven demand and technical differentiation.
Recent Developments:
- In October 2025, DuPont Water Solutions unveiled an advanced suite of water treatment technologies at IFAT India 2025 in Mumbai, targeting both municipal and industrial PFAS applications. The new generation of membrane systems addresses key customer pain points: the advanced membranes handle exceptionally high salt concentrations (enabling water concentration up to 25%), substantially reduce fouling and associated cleaning requirements, and deliver operating cost reductions of up to 34%. These innovations directly support India's sustainability objectives while extending applicability to global markets facing water scarcity and reuse challenges.
- In June 2025, Veolia launched a landmark PFAS treatment facility at the Stanton Water Treatment Plant in Wilmington, Delaware, representing a $35 million investment in infrastructure. The facility is engineered to process up to 30 million gallons of water per day and incorporates 42 granular activated carbon filtration units operating alongside a dedicated laboratory for continuous performance monitoring and water quality assurance. The plant now supplies PFAS-compliant water to more than 100,000 residents across the region. This project exemplifies Veolia's strategy to establish scalable, regulator-aligned PFAS solutions across North America, with a strategic objective to generate €1 billion in annual PFAS revenue globally by 2030.
- In April 2024, Veolia continued its expansion as a pioneering PFAS treatment provider by launching its 30th treatment project in New York state, covering 17 additional wells. This milestone demonstrates Veolia's operational depth: the company has already treated a total of 8 million cubic meters of water across more than 30 sites spanning New York, New Jersey, and Pennsylvania. The cumulative impact reaches 140,000+ residents who now receive PFAS-compliant drinking water below regulatory thresholds. Veolia's early-mover advantage in the U.S. market has established a critical knowledge base applicable to emerging regulatory environments globally, positioning the company as the sector's leading practitioner in PFAS remediation at scale.
- Building on its operational experience, Veolia formally launched its most complete PFAS management offering, branded "BeyondPFAS," in October 2024. The platform represents an end-to-end approach encompassing detection, treatment, and disposal of PFAS compounds. This integrated solution strategy differentiates Veolia from point-solution providers, enabling customers to manage the full PFAS lifecycle within a single partnership framework. The offering incorporates proprietary technologies including high-recovery reverse osmosis membranes, foam fractionation pilots, and advanced filter cleaning systems (LEAPfas), supported by partnerships with specialized start-ups and technology experts.
Report Coverage:
The research report offers an in-depth analysis based on by technology, application, and end-user segments. It details leading market players, providing an overview of their business, product offerings, investments, revenue streams, and key applications. Additionally, the report includes insights into the competitive environment, SWOT analysis, current market trends, as well as the primary drivers and constraints. Furthermore, it discusses various factors that have driven market expansion in recent years. The report also explores market dynamics, regulatory scenarios, and technological advancements that are shaping the industry. It assesses the impact of external factors and global economic changes on market growth. Lastly, it provides strategic recommendations for new entrants and established companies to navigate the complexities of the market.
Future Outlook:
- Regulatory pressure will sustain long-term demand growth.
- Utilities will prioritize compliance-ready filtration systems.
- Media efficiency improvements will lower operating costs.
- Modular systems will gain adoption in smaller communities.
- Industrial cleanup projects will support steady installations.
- Digital monitoring will integrate into treatment platforms.
- Public funding will drive infrastructure upgrades.
- Point-of-use systems will expand in residential markets.
- Supplier partnerships will shape large-scale deployments.
- Innovation will focus on selectivity and media lifespan.
Request a Free Sample
Fill in your details and we'll send you a free sample report.
- Sample data tables & charts
- Research methodology
Need a Custom Version of This Report?
Tailor the scope, geography, or segments to your exact requirements.
- Custom geography or segment scope
- Direct access to our analyst team
Frequently Asked Questions
What is the current market size for PFAS filtration market, and what is its projected size in 2032?
At what Compound Annual Growth Rate is the PFAS filtration market projected to grow between 2025 and 2032?
Which PFAS filtration market segment held the largest share in 2024?
What are the primary factors fueling the growth of the PFAS filtration market?
Who are the leading companies in the PFAS filtration market?
Which region commanded the largest share of the PFAS filtration market in 2024?
Table of Content
Chapter 1. Report Introduction
- 1.1 Report Description & Purpose
- 1.1.1 Report Title & Market Definition
- 1.1.2 Unique Selling Propositions (USP) & Key Differentiators
- 1.1.3 Value Proposition for Stakeholders
- 1.2 Research Objectives
- 1.2.1 Market Sizing Objectives (Volume & Revenue)
- 1.2.2 Segmentation Objectives
- 1.2.3 Competitive Intelligence Objectives
- 1.2.4 Forecast & Scenario Objectives
- 1.3 Report Scope
- 1.3.1 PFAS Filtration Scope – Types & Subtypes Covered
- 1.3.2 Geographic Scope – Regions & Countries Covered
- 1.3.3 Historical Period, Base Year & Forecast Period (2024; forecast to 2032)
- 1.3.4 Inclusions & Exclusions
- 1.4 HS Code & Classification Framework
- 1.5 Currency, Units & Pricing Basis
- 1.6 Target Stakeholders
- 1.7 Limitations & Assumptions
Chapter 2. Executive Summary
- 2.1 Global PFAS Filtration Market Snapshot
- 2.1.1 Market Size – Historical (2024) & Forecast (2024-2032) (2024: USD 2,033 million → 2032: USD 3,469.3 million)
- 2.1.2 Volume & Revenue – Global Totals
- 2.1.3 Key Market Highlights – Top Five Facts
- 2.2 PFAS Filtration Market Segmentation Snapshot
- 2.2.1 Market Split by Region – 2024 vs. 2032
- 2.3 Competitive Snapshot
- 2.3.1 Top 10 Players by Revenue Share – 2024
- 2.3.2 Top 10 Players by Volume Share – 2024
- 2.3.3 Recent Strategic Developments (18-Month Summary)
- 2.4 Key Investment Highlights & Strategic Conclusions
Chapter 3. PFAS Filtration Market Dynamics & Industry Analysis
- 3.1 Market Overview & Context
- 3.1.1 PFAS Filtration Market Position in the Broader Automotive Value Chain
- 3.1.2 OEM vs. Replacement Market Dynamics
- 3.1.3 Market Maturity & Development Stage by Region
- 3.2 PFAS Filtration Market Drivers
- 3.3 PFAS Filtration Market Restraints & Challenges
- 3.4 PFAS Filtration Market Opportunities
- 3.5 Porter's Five Forces Analysis
- 3.5.1 Threat of New Entrants
- 3.5.2 Bargaining Power of Suppliers
- 3.5.3 Bargaining Power of Buyers
- 3.5.4 Threat of Substitutes
- 3.5.5 Competitive Rivalry – Intensity Assessment
- 3.6 PFAS Filtration Value Chain Analysis
- 3.6.1 Upstream – Raw Material/Input Suppliers
- 3.6.1.1 Raw Material/Input 1
- 3.6.1.2 Raw Material/Input 2
- 3.6.1.3 Raw Material/Input 3
- 3.6.2 Midstream – Production/Manufacturing/Service Delivery
- 3.6.2.1 Production/Process Overview
- 3.6.2.2 Key Facility Locations & Capacity by Manufacturer
- 3.6.3 Downstream – Distribution & End Consumer
- 3.6.3.1 Primary Channel – B2B/OEM
- 3.6.3.2 Secondary Channels – Dealer, Retail, Online, Direct
- 3.6.4 Value Chain Profitability Analysis
- 3.6.1 Upstream – Raw Material/Input Suppliers
- 3.7 PESTEL Analysis
- 3.7.1 Political Factors
- 3.7.2 Economic Factors
- 3.7.3 Social Factors
- 3.7.4 Technological Factors
- 3.7.5 Environmental Factors
- 3.7.6 Legal Factors
- 3.8 PFAS Filtration Supply Chain Analysis
- 3.8.1 Raw Material/Input Supply Risk Assessment
- 3.8.2 Manufacturing Concentration Risk (Geographic Exposure)
- 3.8.3 Trade Disruption Impact Analysis
- 3.9 Regulatory & Policy Landscape
Note: The regulatory and policy landscape section covers regulations based on their applicability to the market, PFAS Filtration category, geography, and scope of the study. Only regulatory frameworks with a material impact on operations, compliance, trade, sustainability, or market access are analyzed in detail.
Chapter 4. Key Investment Pockets & Opportunity Analysis
- 4.1 PFAS Filtration Market Attractiveness Analysis
- 4.1.1 By Region – Investment Attractiveness Matrix (Volume × CAGR)
- 4.2 Absolute Revenue Growth Opportunity
- 4.2.1 By Region – Absolute USD Growth Through 2032
- 4.3 Incremental Volume Opportunity
- 4.3.1 By Region – Incremental Volume Through 2032
- 4.3.2 Segment – Incremental Volume
- 4.4 Emerging Submarket Opportunity Deep Dive (Subject to Applicability)
- 4.5 Emerging Market Opportunity Scorecards
- 4.5.1 United States
- 4.5.2 Europe
- 4.5.3 Asia
- 4.5.4 Middle East & Africa
Note: Emerging Market Opportunity Scorecards will be included based on relevance and strategic importance. Regions listed are indicative and may vary depending on data availability and market dynamics.
Chapter 5. PFAS Filtration Import-Export Analysis & Trade Flows
- 5.1 Global Trade Overview
- 5.1.1 Global Export Value by Country (2024)
- 5.1.2 Global Export Volume by Country (2024)
- 5.1.3 Global Import Value by Country (2024)
- 5.1.4 Global Import Volume by Country (2024)
- 5.1.5 Net Trade Balance by Country (2024)
- 5.2 Export Analysis – Segment
- 5.2.1 Type 1 (HS Code)
- 5.2.2 Type 2 (HS Code)
- 5.2.3 Type 3 (HS Code)
- 5.2.4 Type 4 (HS Code)
- 5.2.5 Type 5 (HS Code)
- 5.3 Import Analysis – Segment
- 5.3.1 Type 1 (HS Code)
- 5.3.2 Type 2 (HS Code)
- 5.3.3 Type 3 (HS Code)
- 5.3.4 Type 4 (HS Code)
- 5.3.5 Type 5 (HS Code)
- 5.4 Average Unit Trade Prices
- 5.4.1 Average Export Price – Segment & Country
- 5.4.2 Average Import Price – Segment & Source Country
- 5.4.3 Price Trends (2024)
- 5.5 Key Trade Route Analysis
- 5.5.1 Trade Route 1
- 5.5.2 Trade Route 2
- 5.5.3 Trade Route 3
- 5.5.4 Trade Route 4
- 5.5.5 Trade Route 5
- 5.6 Trade Policy Impact Assessment
- 5.6.1 US Anti-Dumping & Section 301 Tariffs
- 5.6.2 EU Customs Union Impact
- 5.6.3 Major Free Trade Agreements
- 5.6.4 USMCA Rules of Origin
Note: Trade policy analysis will be included only where relevant to the PFAS Filtration market.
Chapter 6. Competitive Landscape & Company Benchmarking
- 6.1 PFAS Filtration Market Concentration & Structure
- 6.1.1 Herfindahl-Hirschman Index (HHI) – vs. 2024
- 6.1.2 Tier 1, Tier 2 & Tier 3 Market Structure
- 6.1.3 Global, Regional & Local Player Dynamics
- 6.2 PFAS Filtration Market Share Analysis – 2024
- 6.2.1 Global Revenue Share by Company
- 6.2.2 Global Volume Share by Company
- 6.2.3 Regional Revenue Share
- 6.2.4 Market Share Evolution ( vs. 2024)
- 6.2.5 OEM Segment Share by Company
- 6.2.6 Replacement Segment Share by Company
- 6.3 Production/Delivery Capacity & Facility Analysis
- 6.3.1 Global Installed Capacity
- 6.3.2 Capacity Utilization Rates
- 6.3.3 Production/Output Volume
- 6.3.4 Facility Locations & Capacity Map
- 6.3.5 Planned Capacity Additions
- 6.4 PFAS Filtration Competitive Benchmarking Matrix
- 6.4.1 Revenue, Volume, CAGR & Profitability Comparison
- 6.4.2 Channel Revenue Mix
- 6.4.3 Geographic Revenue Exposure
- 6.4.4 R&D Intensity
- 6.4.5 Sustainability Maturity
- 6.5 Strategic Developments in PFAS Filtration (Last 24 Months)
- 6.5.1 Mergers, Acquisitions & Divestments
- 6.5.2 New PFAS Filtration Launches
- 6.5.3 Facility Expansions
- 6.5.4 Strategic Alliances, Joint Ventures & Partnerships
- 6.5.5 Distribution Expansion & Market Entry
- 6.5.6 Sustainability & ESG Initiatives
- 6.6 Competitive Strategy Mapping
- 6.6.1 Leader, Challenger, Follower & Niche Classification
- 6.6.2 Pricing Strategy Comparison
- 6.6.3 Channel Strategy Matrix
Note: Strategic developments are included based on their materiality and the availability of reliable information.
Chapter 7. Global PFAS Filtration Market – By Distribution Channel
- 7.1 Segment Overview
- 7.1.1 Volume & Revenue Split by Channel (2024 & 2032)
- 7.1.2 Channel Mix Evolution (2024-2032)
Chapter 8. Regional Market Analysis – Global Overview
- 8.1 Global Regional Overview
- 8.1.1 Regional Volume Share
- 8.1.2 Regional Revenue Share
- 8.1.3 Regional Volume by Region
- 8.1.4 Regional Revenue by Region
- 8.1.5 Regional Forecast Through 2032
- 8.2 Cross-Regional Segment Analysis
- 8.2.1 By Distribution Channel
- 8.2.2 By Brand/Price Tier
Chapter 9. North America PFAS Filtration Market
- 9.1 United States
- 9.2 Canada
- 9.3 Mexico
Chapter 10. Europe PFAS Filtration Market
- 10.1 Germany
- 10.2 France
- 10.3 Italy
- 10.4 United Kingdom
- 10.5 Spain
- 10.6 Poland
- 10.7 Russia
- 10.8 Netherlands
- 10.9 Belgium
- 10.10 Sweden
- 10.11 Denmark
- 10.12 Norway
- 10.13 Rest of Europe
Chapter 11. Asia Pacific PFAS Filtration Market
- 11.1 China
- 11.2 India
- 11.3 Japan
- 11.4 South Korea
- 11.5 Thailand
- 11.6 Indonesia
- 11.7 Vietnam
- 11.8 Malaysia
- 11.9 Australia
- 11.10 Rest of Asia Pacific
Chapter 12. Latin America PFAS Filtration Market
- 12.1 Brazil
- 12.2 Argentina
- 12.3 Colombia
- 12.4 Chile
- 12.5 Rest of Latin America
Chapter 13. Middle East PFAS Filtration Market
- 13.1 Saudi Arabia
- 13.2 United Arab Emirates
- 13.3 Turkey
- 13.4 Israel
- 13.5 Iran
- 13.6 Rest of the Middle East
Chapter 14. Africa PFAS Filtration Market
- 14.1 South Africa
- 14.2 Egypt
- 14.3 Nigeria
- 14.4 Morocco
- 14.5 Rest of Africa
Chapter 15. PFAS Filtration Company Profiles
- 15.1 [Company 01]
- 15.1.1 Company Overview
- 15.1.2 Key Management Personnel
- 15.1.3 Products & Services Portfolio
- 15.1.4 Financial Performance
- 15.1.5 Key Market Focus & Geographic Presence
- 15.1.6 Recent Developments & Strategic Initiatives
Note: The company profile list is preliminary and may change based on research findings, market developments, data availability, and client requirements.
Chapter 16. Appendices
- Appendix A – List of Abbreviations & Acronyms
- Appendix B – Industry Classification Code Reference – Full Series
- Appendix C – Production & Capacity Data Tables
- Appendix D – End-Use & Demand Base Tables
- Appendix E – Consumption & Replacement Rate Assumptions
- Appendix F – ASP Reference Tables
- Appendix G – Manufacturing & Facility Database
- Appendix H – Import-Export Data Tables
- Appendix I – Regulatory Summary Tables
- Appendix J – Primary Research Participant List (Anonymized)
- Appendix K – Primary Research Questionnaire Framework
- Appendix L – Data Sources & Bibliography
- Appendix M – Market Size Divergence & Source Comparison
Chapter 17. Research Methodology
- 17.1 Research Framework & Philosophy
- 17.2 Secondary Research – Sources, Hierarchy & Data Extraction
- 17.3 Data Modeling – Bottom-Up & Top-Down Market Sizing
- 17.4 Primary Research – Stakeholder Framework, LOI & Sample Sizes
- 17.5 Forecast Methodology – Regression, Scenario & Sensitivity Analysis
- 17.6 Quality Control – Four-Layer Validation Framework
- 17.7 Limitations & Standard Assumptions
- 17.8 Disclaimer
