
Silica feedstock and detergent builders anchor demand
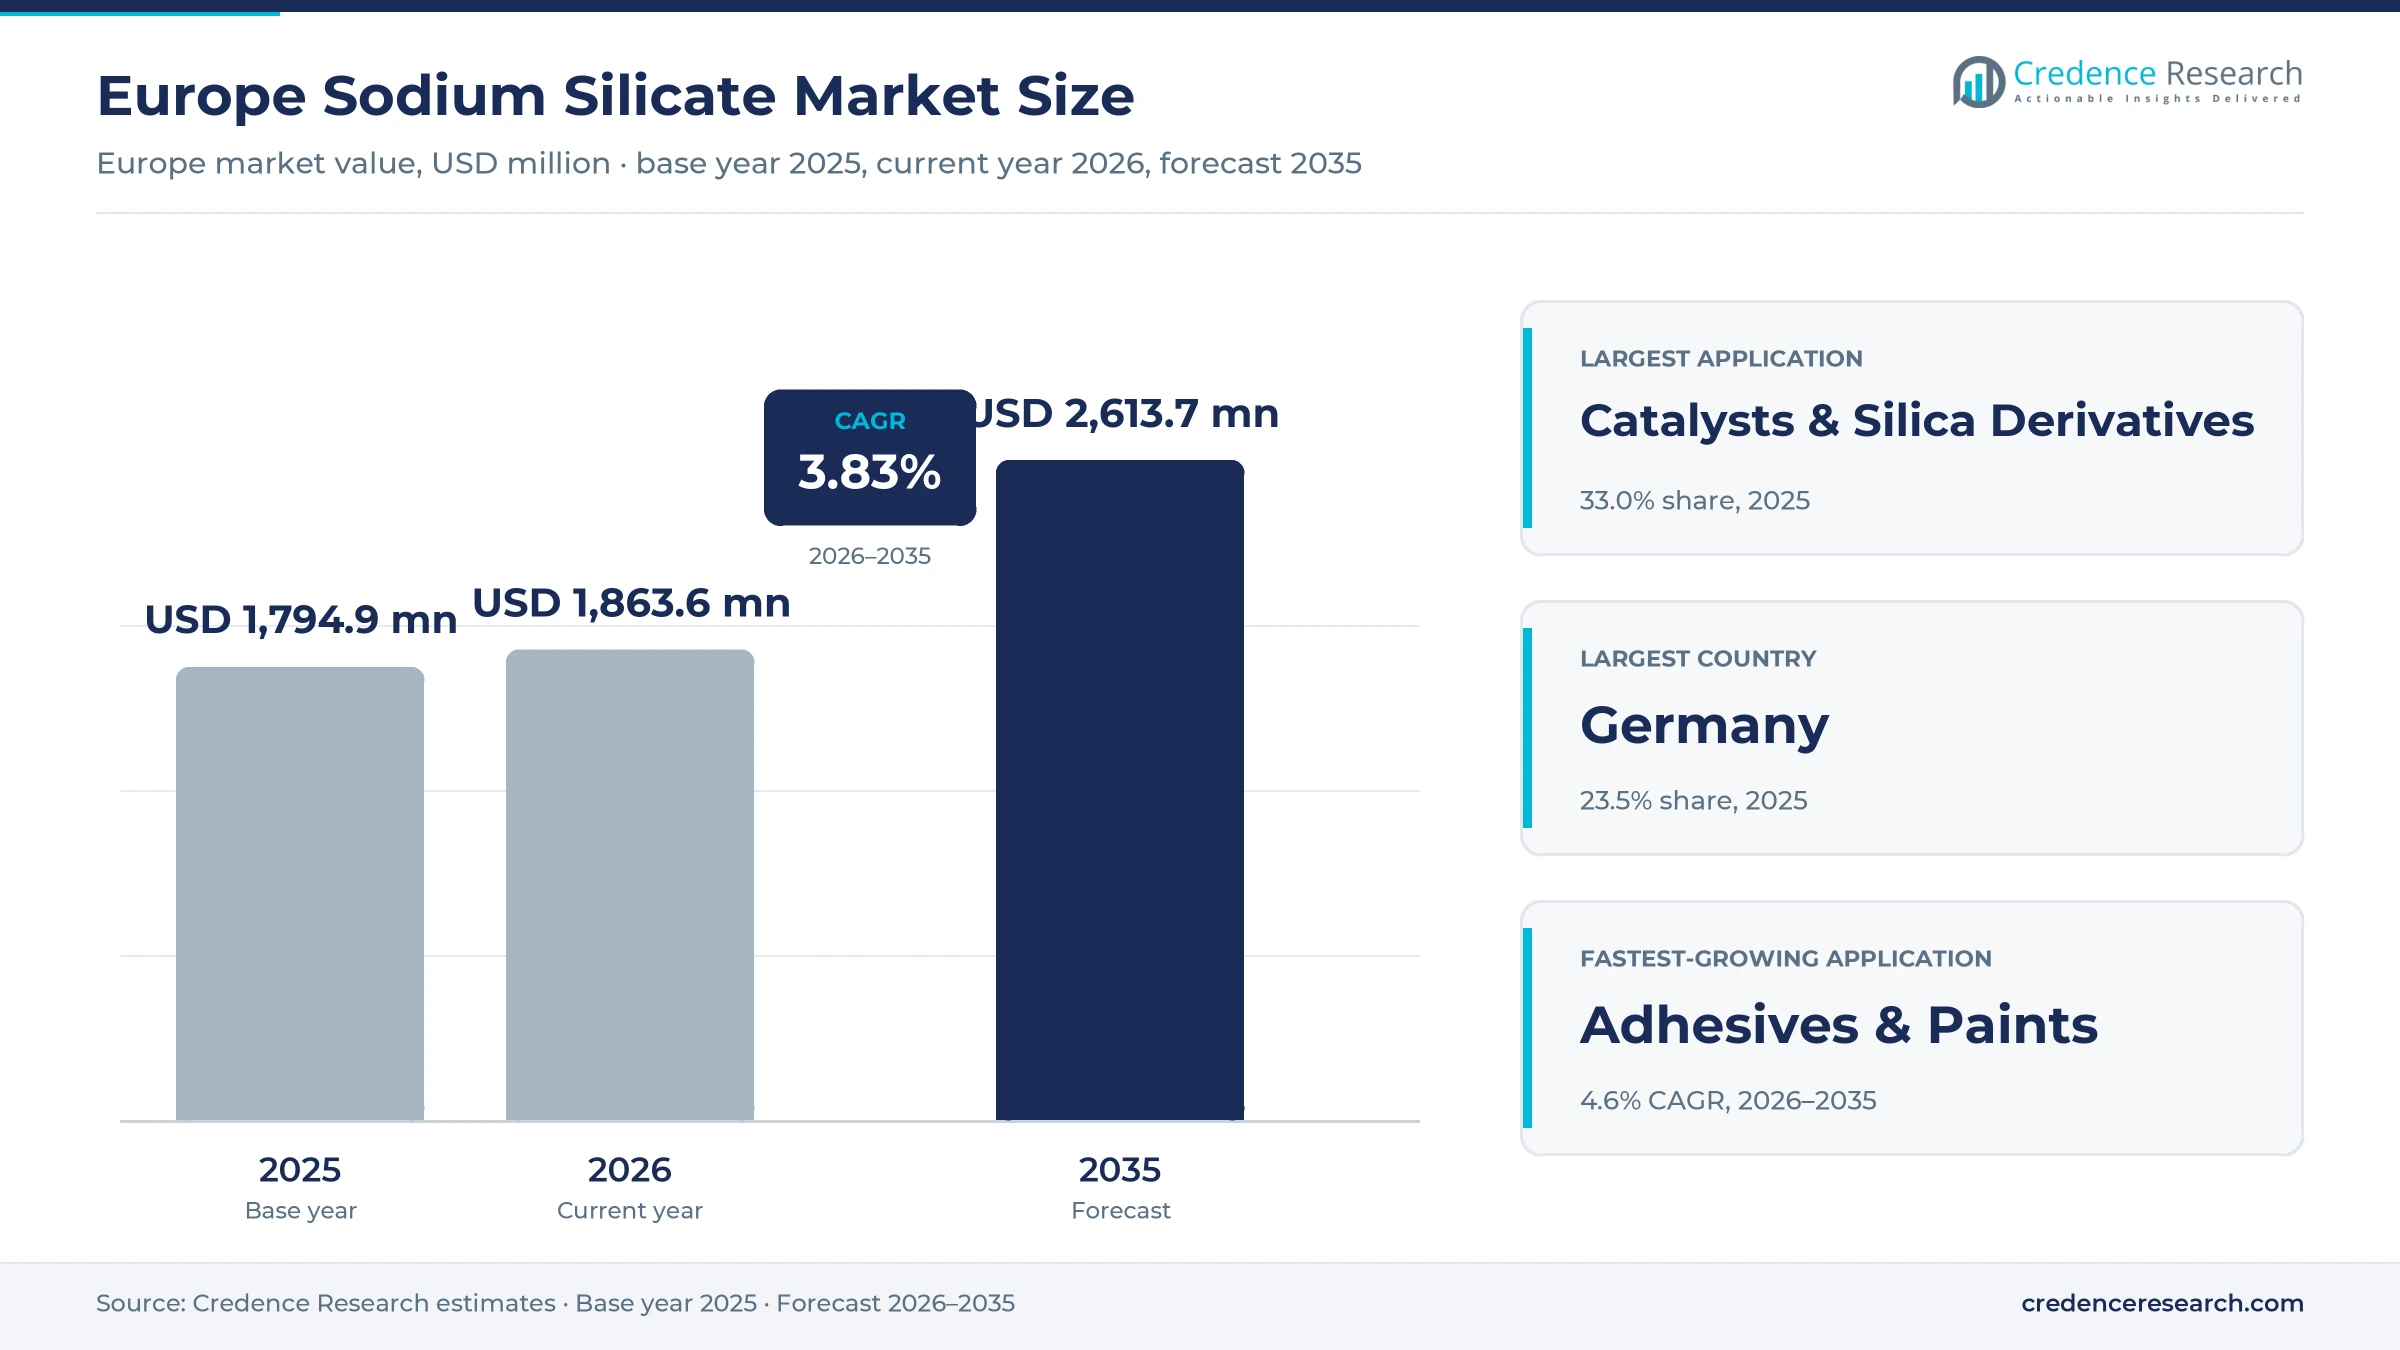
The Europe sodium silicate market was valued at USD 1.79 billion in 2025 and is projected to increase from USD 1.86 billion in 2026 to USD 2.61 billion by 2035, registering a CAGR of 3.83% during 2026–2035. Demand comes from makers of precipitated silica, zeolites and catalysts, detergent and cleaning product formulators, pulp and paper mills, and producers of paints, adhesives, refractories and construction chemicals. Germany held the largest share, 23.5% in 2025, because it combines large detergent, chemical and paint industries with several producing furnaces. Poland is the fastest-growing country at 4.7% a year, as its large export-oriented furnace capacity feeds silica plants across the region. The main commercial shift is consolidation, with PQ agreeing in May 2026 to buy the silicates business of BASF after earlier purchases in Switzerland and Sweden.
Which silicate grades and buyers does the estimate count?
The estimate counts sodium silicate glass in lumps and powders, liquid water glass in its various silica to soda ratios, and crystalline metasilicates, valued at the first sale by the producer or at transfer value when a silica plant melts its own glass. Buyers purchase liquid grades by tanker on annual contracts, while glassy lumps travel by truck and rail to plants that dissolve them on site.
Potassium silicates, precipitated silica itself and zeolite powders sit outside the estimate, although they draw on the same furnaces. Europe here includes the EU-27, the United Kingdom, Switzerland, Norway and Turkey. Producers compete on delivered cost, because a liquid grade is mostly water and rarely ships more than a few hundred kilometers, which keeps the market regional and gives local furnaces a natural service area.
Europe Sodium Silicate Market Insights
- The market is valued at USD 1.79 billion in 2025 and is projected to reach USD 2.61 billion by 2035, growing at a 3.83% CAGR as silica, detergent and binder makers absorb more silicate.
- Germany led with 23.5% of 2025 value, because it combines large detergent, chemical and paint industries with several silicate furnaces.
- Catalysts & Silica Derivatives held 33.0% of 2025 value, as tire makers buy highly dispersible silica made from dissolved silicate glass.
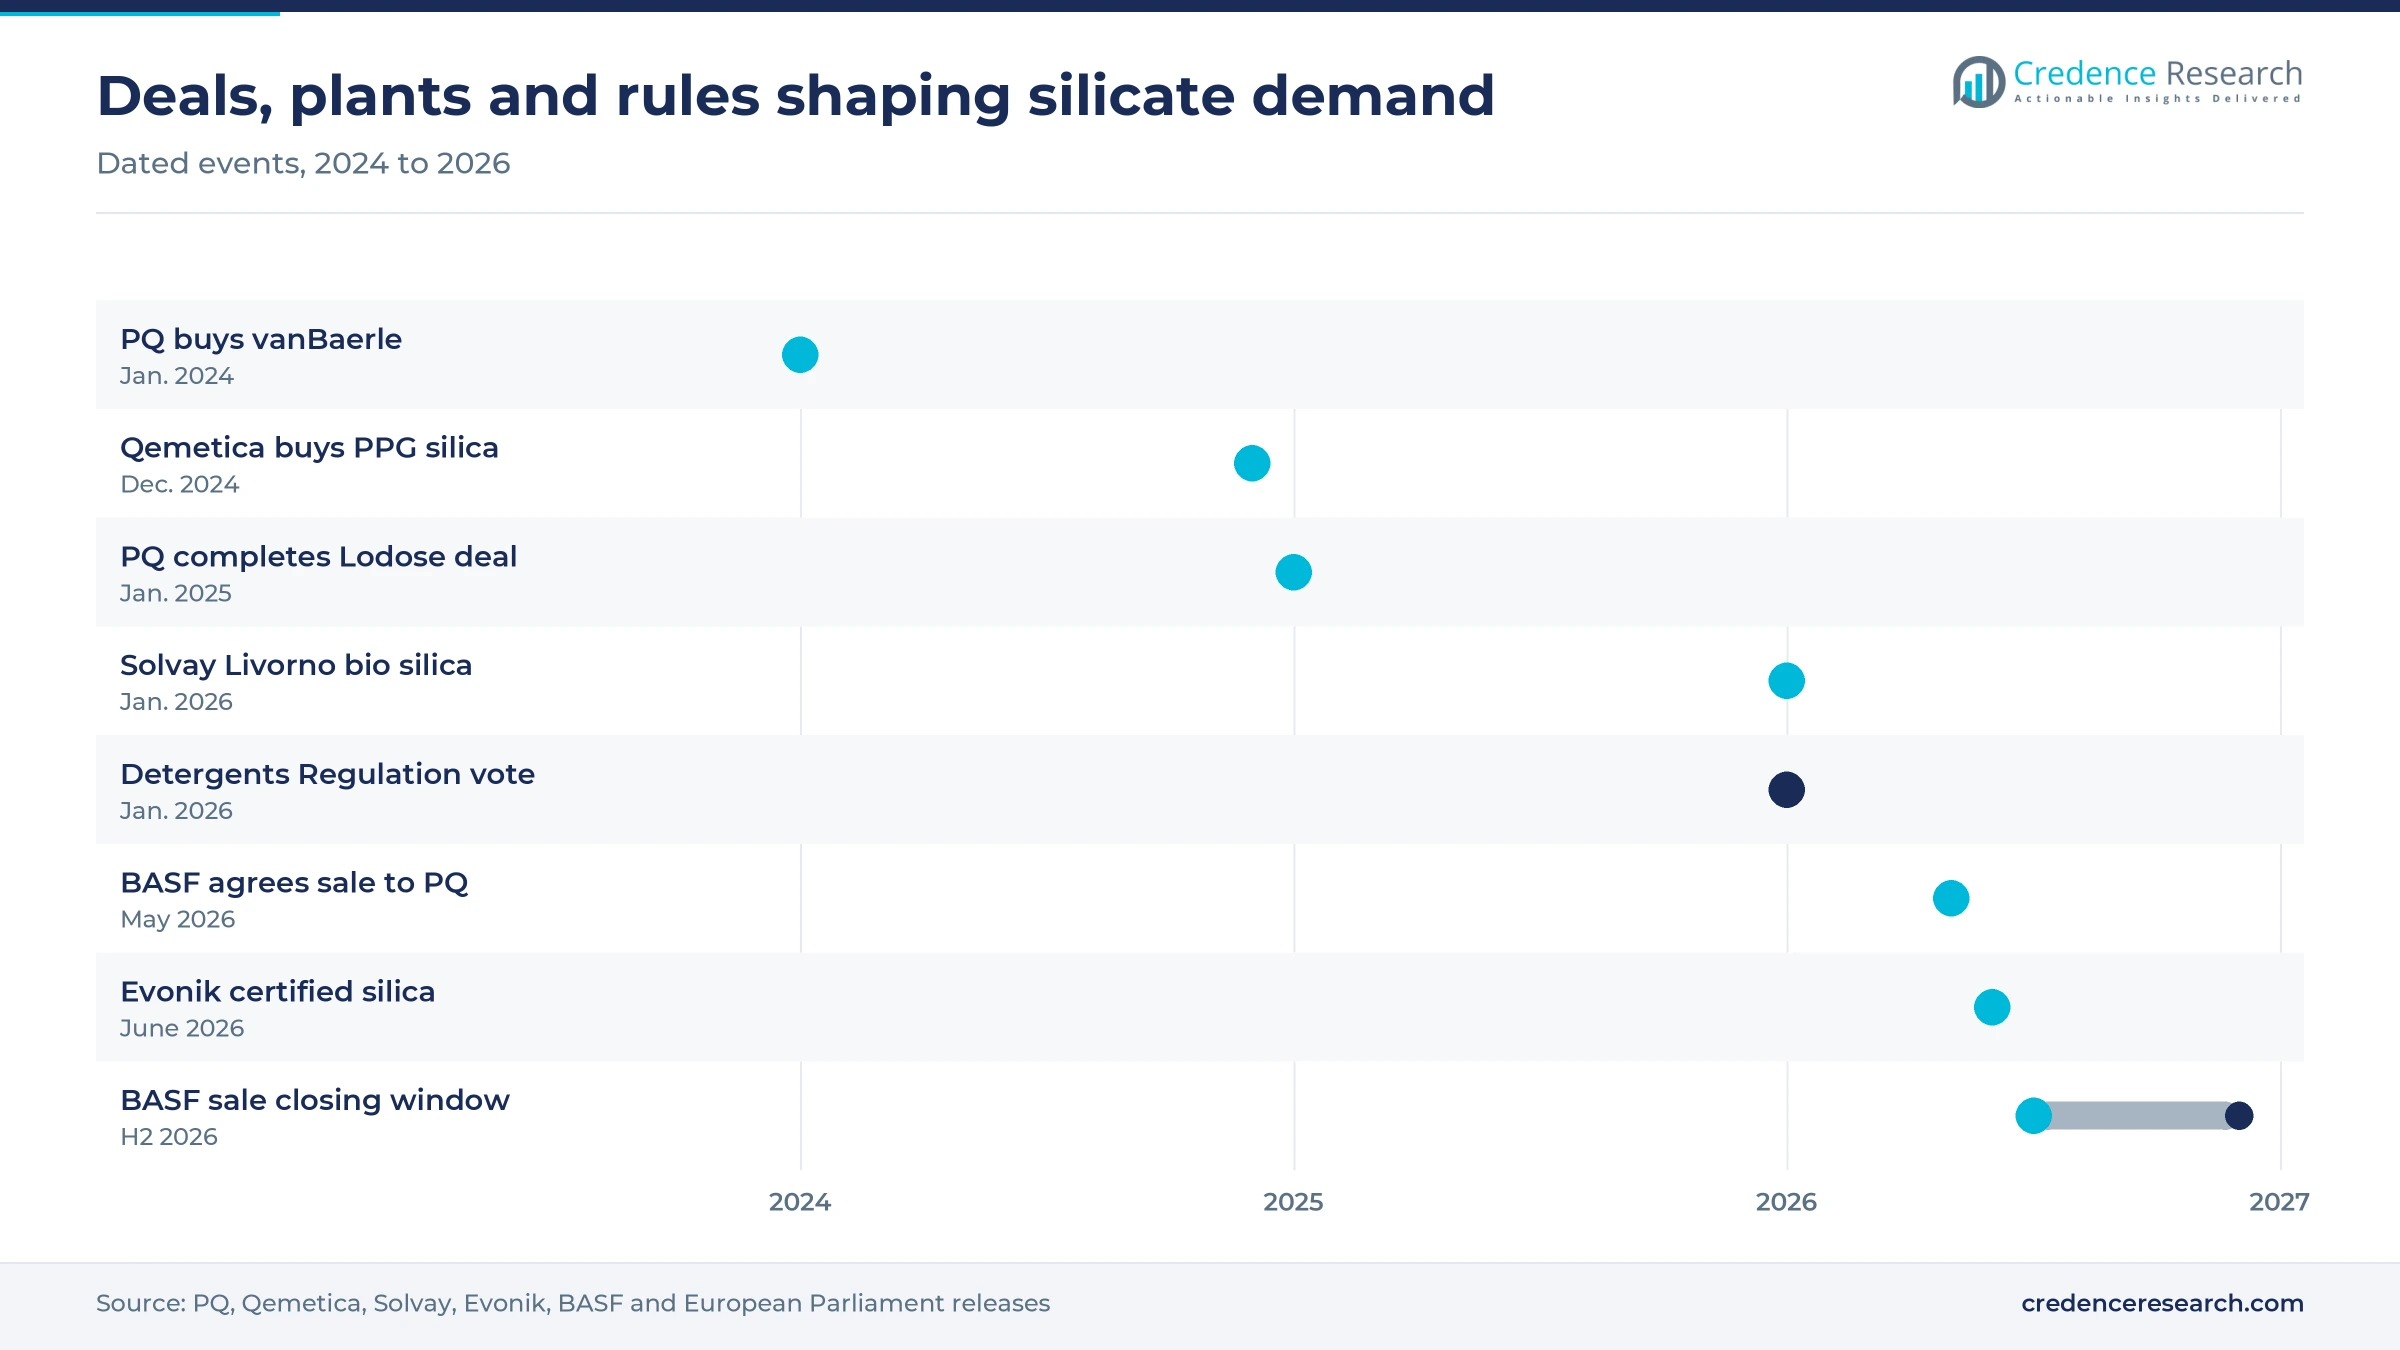
- BASF agreed on May 20, 2026 to sell its silicates business at Duesseldorf to PQ, with closing expected in the second half of 2026.
- Solvay opened a unit in Livorno, Italy in January 2026 that makes tire silica from bio-based silicate derived from rice husk ash.
Liquid grades lead while silicate binders grow fastest
Why do liquid grades lead while solid grades grow faster?
Based on type, the market is categorized into liquid and solid. Liquid grades led with 61.0% of 2025 value because detergent, paper, construction and water treatment buyers take solutions by tanker, and drinking water utilities buy them to the EN 1209 standard for sodium silicate. Solid grades grow fastest at 4.1% a year as silica plants buy glassy lumps to dissolve on site, and Qemetica raised capacity at Zary, Poland, by about 30% to roughly 240,000 metric tons a year with a furnace commissioned in 2021.
Why does anhydrous glass lead as metasilicates grow faster?
Based on form, the market is categorized into anhydrous and crystalline. Anhydrous glass led with 72.0% of 2025 value because furnace glass is the starting point for almost every liquid grade and for silica plants. Crystalline metasilicates grow fastest at 4.2% a year as dishwasher and industrial cleaner makers need alkaline builders that carry no phosphorus, since EU law has capped consumer automatic dishwasher detergents at 0.3 grams of phosphorus per dose since Jan. 1, 2017. UN Comtrade data show German metasilicate exports at about USD 1,802 per metric ton in 2024.
Why do silica derivatives lead while binders grow fastest?
Based on application, the market is categorized into catalysts and silica derivatives, detergents, pulp and paper, adhesives and paints, refractories, food preservation and others. Catalysts & Silica Derivatives led with 33.0% of 2025 value because precipitated silica plants dissolve large volumes of glass, and Qemetica became the third-largest European silica producer when it bought the business of PPG, including Delfzijl, in December 2024. Adhesives & Paints grows fastest at 4.6% a year as PQ adds specialty binders, having bought vanBaerle, a supplier for paints and welding electrodes, in January 2024.
| Segment Group | Leading Sub-segment | Share, 2025 | Fastest-growing Sub-segment | CAGR, 2026–2035 |
|---|---|---|---|---|
| By Type | Liquid | 61.0% | Solid | 4.1% |
| By Form | Anhydrous | 72.0% | Crystalline | 4.2% |
| By Application | Catalysts & Silica Derivatives | 33.0% | Adhesives & Paints | 4.6% |
Bulk silicate sells near cost while specialties earn more
Pricing starts with sand, soda ash and the natural gas used to melt them, and bulk glass sells close to that cost. A revolving hearth furnace burns about 120 normal cubic meters of gas per metric ton of glass, according to the German Federal Environment Agency. At the 2025 EU average of USD 11.91 per MMBtu, that fuel costs roughly USD 45 per ton of glass, about 2.7 times the 2019 level, by Credence Research calculation. Bulk exports sell for USD 330 to 390 per ton, so gas swings move margins sharply. Metasilicates and specialty grades sell at four to five times bulk prices and carry steadier margins.
| Product or reference | Typical price or fee | Basis |
|---|---|---|
| Other sodium silicates, German exports, 2024 | USD 334 per metric ton | UN Comtrade, HS 283919, 2024 |
| Other sodium silicates, Polish exports, 2024 | USD 383 per metric ton | UN Comtrade, HS 283919, 2024 |
| Other sodium silicates, Spanish exports, 2024 | USD 370 per metric ton | UN Comtrade, HS 283919, 2024 |
| Other sodium silicates, Dutch exports, 2024 | USD 1,695 per metric ton | UN Comtrade, HS 283919, 2024 |
| Sodium metasilicates, German exports, 2024 | USD 1,802 per metric ton | UN Comtrade, HS 283911, 2024 |
| Natural gas, EU, 2025 average | USD 11.91 per MMBtu | IMF primary commodity prices, 2026 |
Request a Free Sample
Fill in your details and we'll send you a free sample report.
- Sample data tables & charts
- Research methodology
Tire silica, phosphate limits and water rules lift use
Tire silica plants are the largest single outlet
Precipitated silica for low rolling resistance tires is the largest single use of sodium silicate in Europe, because each ton of silica starts as dissolved silicate glass. Qemetica completed its purchase of the PPG silica business in December 2024, adding the Delfzijl plant in the Netherlands and about 200,000 metric tons of combined silica capacity, which made it the third-largest European producer. Solvay opened a unit in Livorno, Italy, in January 2026 that makes highly dispersible silica from bio-based sodium silicate, with about 35% lower carbon emissions per ton. Evonik began commercial production of ISCC Plus-certified silica at Adapazari, Turkey, in June 2026. Silicate producers located close to these plants, and to makers of green tires, gain steady base-load volumes.
Phosphate limits keep silicates in detergents
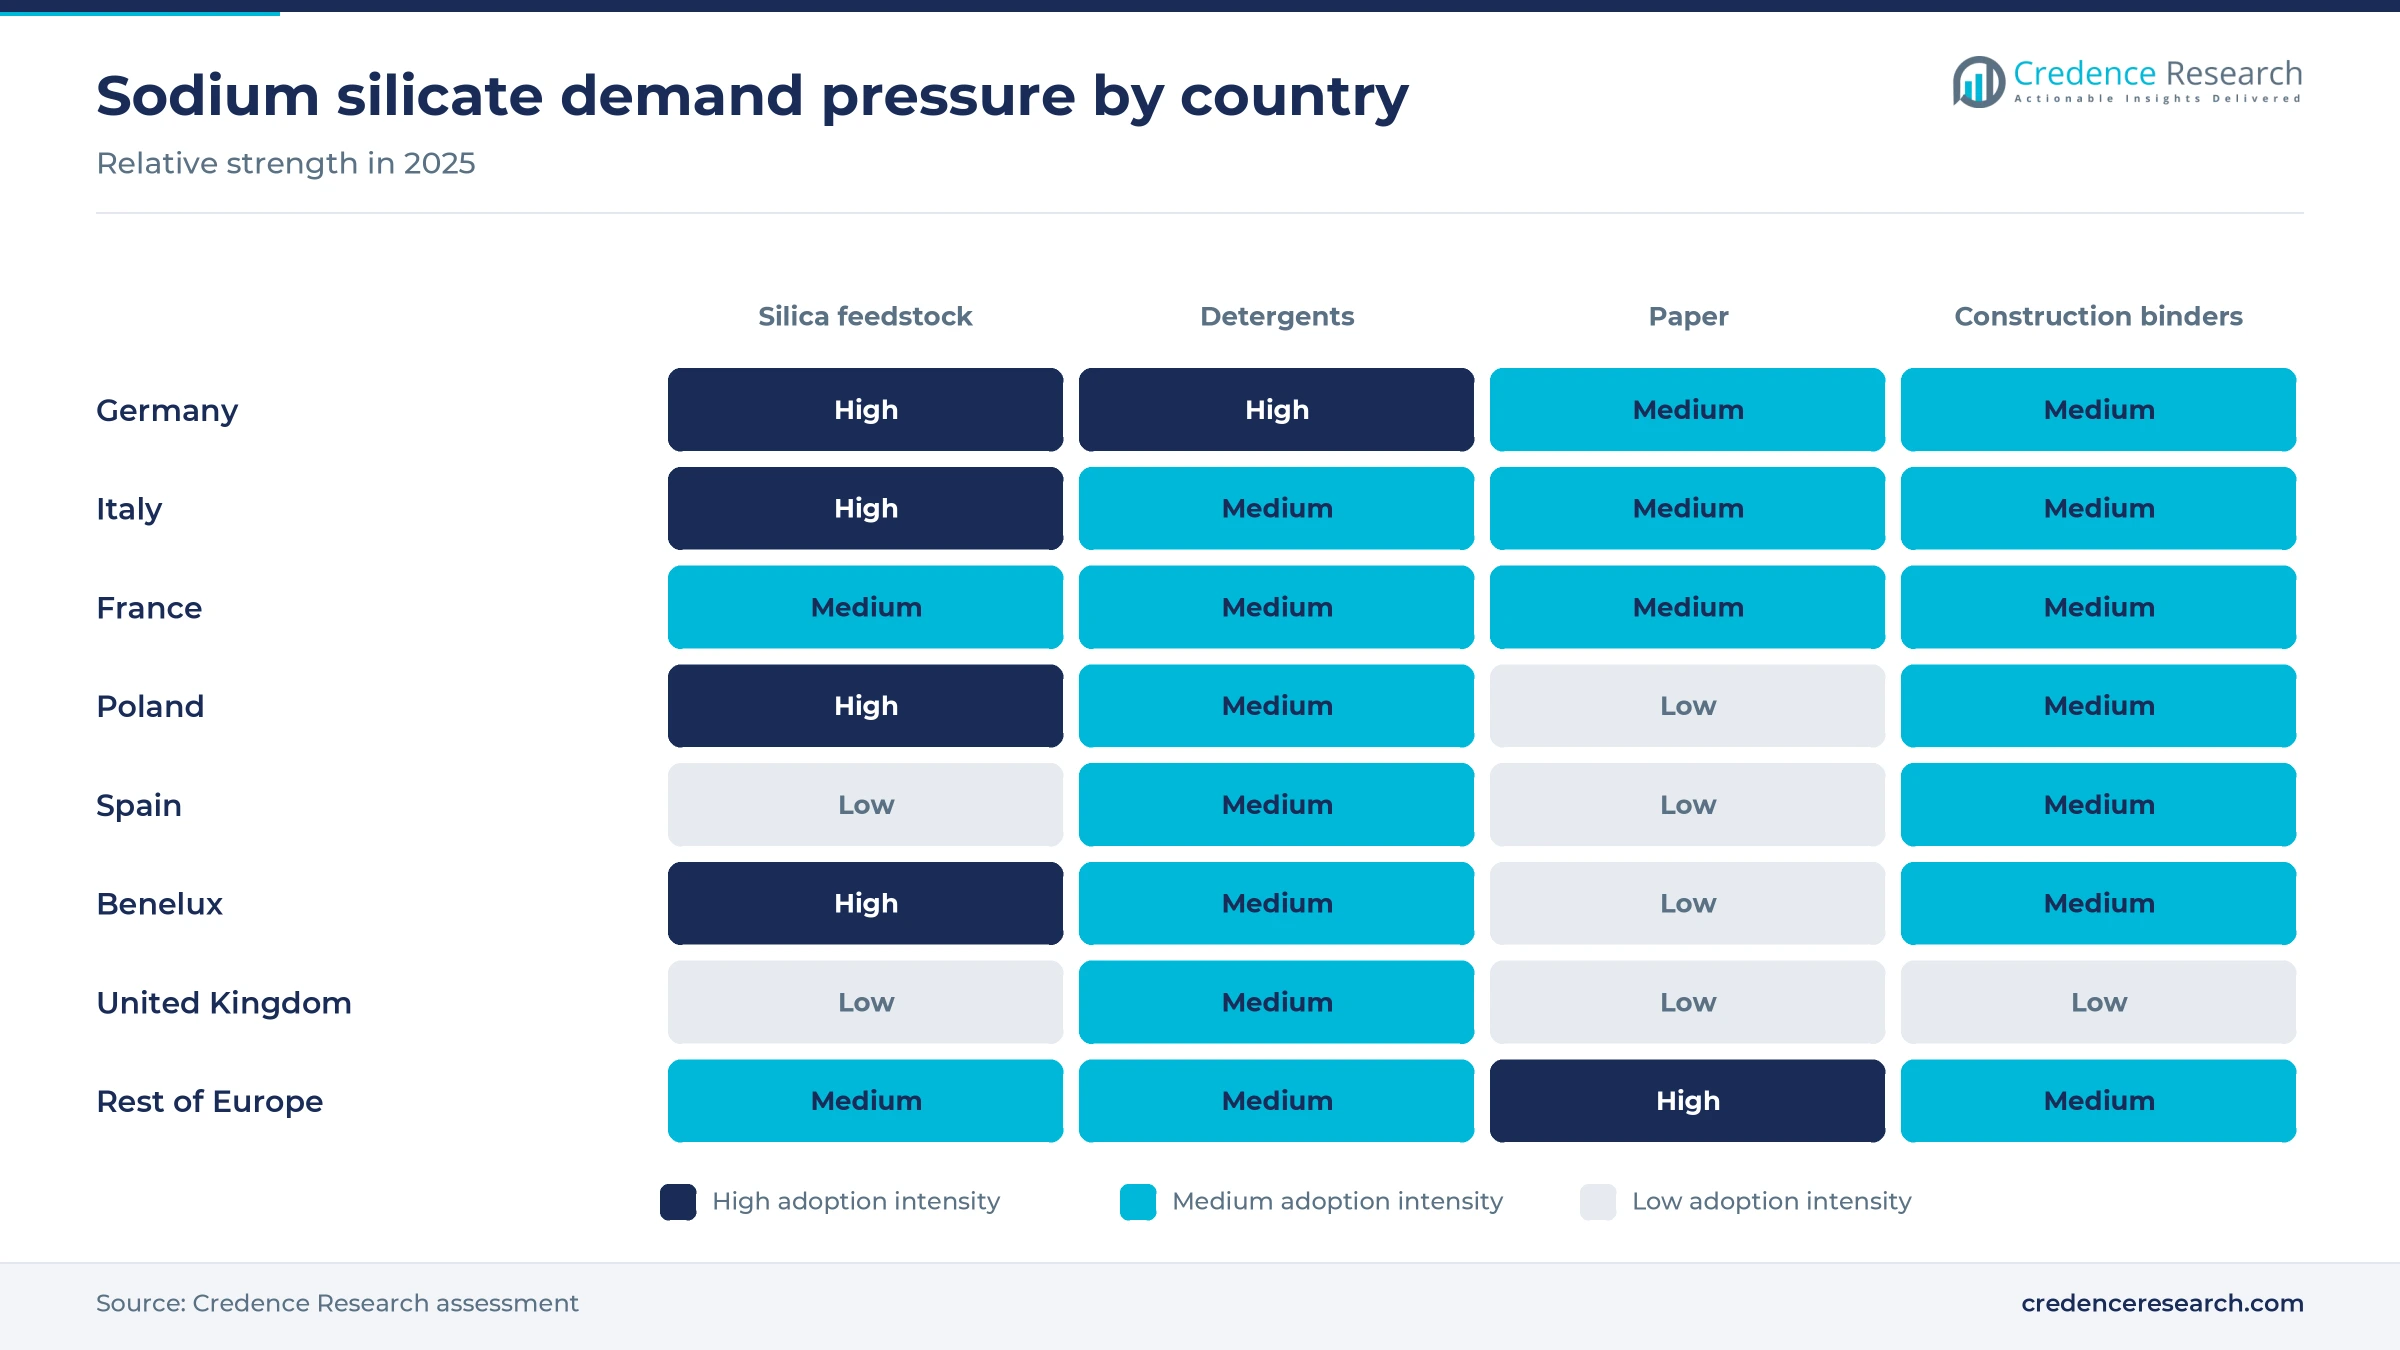
EU limits on phosphorus in consumer detergents keep sodium silicate and silicate-based builders in laundry and dishwasher formulas, because silicates supply alkalinity, corrosion protection for machines and soil suspension. Regulation (EU) No 259/2012 bars consumer laundry detergents with 0.5 grams or more of phosphorus per dose from June 30, 2013, and dishwasher detergents with 0.3 grams or more from Jan. 1, 2017. The European Parliament adopted a revised Detergents Regulation on Jan. 22, 2026, which asks the Commission to study lower phosphorus limits within two years. Silicate is also the raw material for detergent zeolites, so tighter phosphorus rules would reinforce demand for both.
Drinking water rules widen treatment uses
Stricter drinking water rules support sodium silicate as a corrosion inhibitor and coagulant aid, because it forms a protective film on old pipes and helps hold metals in place. The recast Drinking Water Directive 2020/2184 cuts the lead limit at the tap from 10 to five micrograms per liter, with compliance required by January 2036, Engineers Ireland reported. Water utilities buy silicate to the European standard EN 1209, which defines sodium silicate for treating water intended for human consumption. PQ says its silicates aid the delivery of safer drinking water by removing heavy metals. Suppliers of certified grades and other water treatment chemicals gain from that 2036 deadline.
Construction binders add higher-value volumes
Construction chemicals add higher-value demand, because silicates bind silicate paints, soil grouts, sealers and low-carbon geopolymer cement formulations. EU construction output rose 0.5% in 2025 while the euro area stayed flat, Eurostat reported in February 2026, so growth comes from product mix rather than volume. PQ bought the specialty silicate business of vanBaerle in January 2024, adding binders for facade and interior paints and construction uses. BASF lists geotechnical applications among the uses of the silicates business it agreed to sell to PQ. Producers with formulated binder grades earn more per ton than bulk sellers.
Producer consolidation and bio-based feedstock emerge
Producers shift toward consolidated regional networks
Silicate producers are shifting toward fewer, larger regional networks to spread furnace costs, creating openings for specialty grades across detergents, tires and construction. PQ completed its purchase of the specialty silicate business of Sibelco at Lodose, Sweden, in January 2025, after buying vanBaerle in Switzerland a year earlier. BASF agreed on May 20, 2026 to sell its silicates business at Duesseldorf to PQ, with closing expected in the second half of 2026 subject to regulatory approval. Qemetica, which says it is the largest supplier and third-largest maker of sodium silicate in Europe, has added silica capacity instead. Buyers face fewer independent suppliers in Germany and the Nordics.
Silica makers turn to bio-based and certified feedstocks
Silica makers are shifting toward bio-based and mass-balance certified feedstocks to meet tire makers' recycled and renewable content targets, creating openings for low-carbon silicate grades. Solvay says its Livorno silica lets tire makers reach up to 15% recycled or renewable content, supporting a 40% target by 2030, and Continental plans to use more of it. Evonik launched ULTRASIL eCO from Adapazari in June 2026 under ISCC Plus mass balance rules. Qemetica says its 2021 Zary furnace cut carbon emissions per ton of silicate by about 20%. Producers that can document lower carbon glass will hold silica contracts as tire makers audit suppliers.
Low-carbon furnaces open a cost and carbon gap
Furnace upgrades open a supply gap that efficient producers can fill, because older tank furnaces lose money when gas prices stay high, as the gas benchmark in the pricing table shows, and a ton of glass needs several MMBtu of fuel. Qemetica spent PLN 80 million on its Zary furnace, adding about 30% capacity, and the German Federal Environment Agency notes that tank furnaces hold the melt for 12 to 18 hours, so idle or oversized units waste a large share of their fuel. Producers that electrify or recover heat can win volume from closing furnaces, and producers with secure soda ash contracts gain a further cost edge over rivals that buy raw materials on the spot market.
Recycled paper keeps a steady deinking outlet
Recycled fiber offers a steady opening for silicate in deinking and peroxide bleaching, even as total paper output falls, because silicate stabilizes hydrogen peroxide and disperses ink. Cepi puts the European paper recycling rate at 76.4%, and its 2025 statistics show market pulp output up 1.0% while paper and board output slipped. Woellner sells process enhancement chemicals for industrial water circuits and the pulp and paper industry alongside its silicates. Suppliers that pair silicate with stabilizers and on-site application service can hold mill contracts as capacity consolidates into larger recycled-fiber lines, while bulk-only sellers compete on price alone.
Gas costs, paper decline and tire imports weigh on demand
High gas prices squeeze bulk glass producers
Melting sand and soda ash is energy intensive, and EU gas prices remain well above prewar levels. The IMF EU gas benchmark averaged USD 11.91 per MMBtu in 2025, about 2.7 times its 2019 level, which adds roughly USD 28 to the fuel cost of each ton of glass at hearth furnace rates. Small independent producers with one old furnace are most exposed, because bulk glass sells near cost and buyers can switch to larger suppliers.
Shrinking paper output cuts a traditional outlet
European paper and board output fell 1.6% to 77.4 million metric tons in 2025, extending a three-year loss of production assets that Cepi described in its 2025 statistics. Each closed graphic paper or newsprint mill removes a steady buyer of silicate for deinking and bleaching. Producers in Finland, Sweden and Germany that sell mainly to mills are most exposed, unless they shift volumes toward packaging grades and other industrial customers.
Tire imports erode local silica demand
Imported tires reduce European tire output and with it the silica that local plants make from silicate. Tyres Europe reported in February 2026 that consumer replacement tire sales fell 2% in 2025 to about 224.1 million units, citing rising import penetration, and China supplied about 76% of car tire imports in September and October. Michelin set early 2026 as the end of production at Cholet, France and silicate makers serving silica plants near closing tire factories are most exposed.
Fewer suppliers raise buyer concentration risk
Consolidation gives buyers fewer sources, and the BASF sale to PQ announced on May 20, 2026 removes one independent seller in Germany once it closes, expected in the second half of 2026. Detergent and paint makers that qualified two suppliers may now find both under one owner. Mid-sized formulators without long-term contracts are most exposed to higher prices, and qualifying a third supplier takes months of testing.
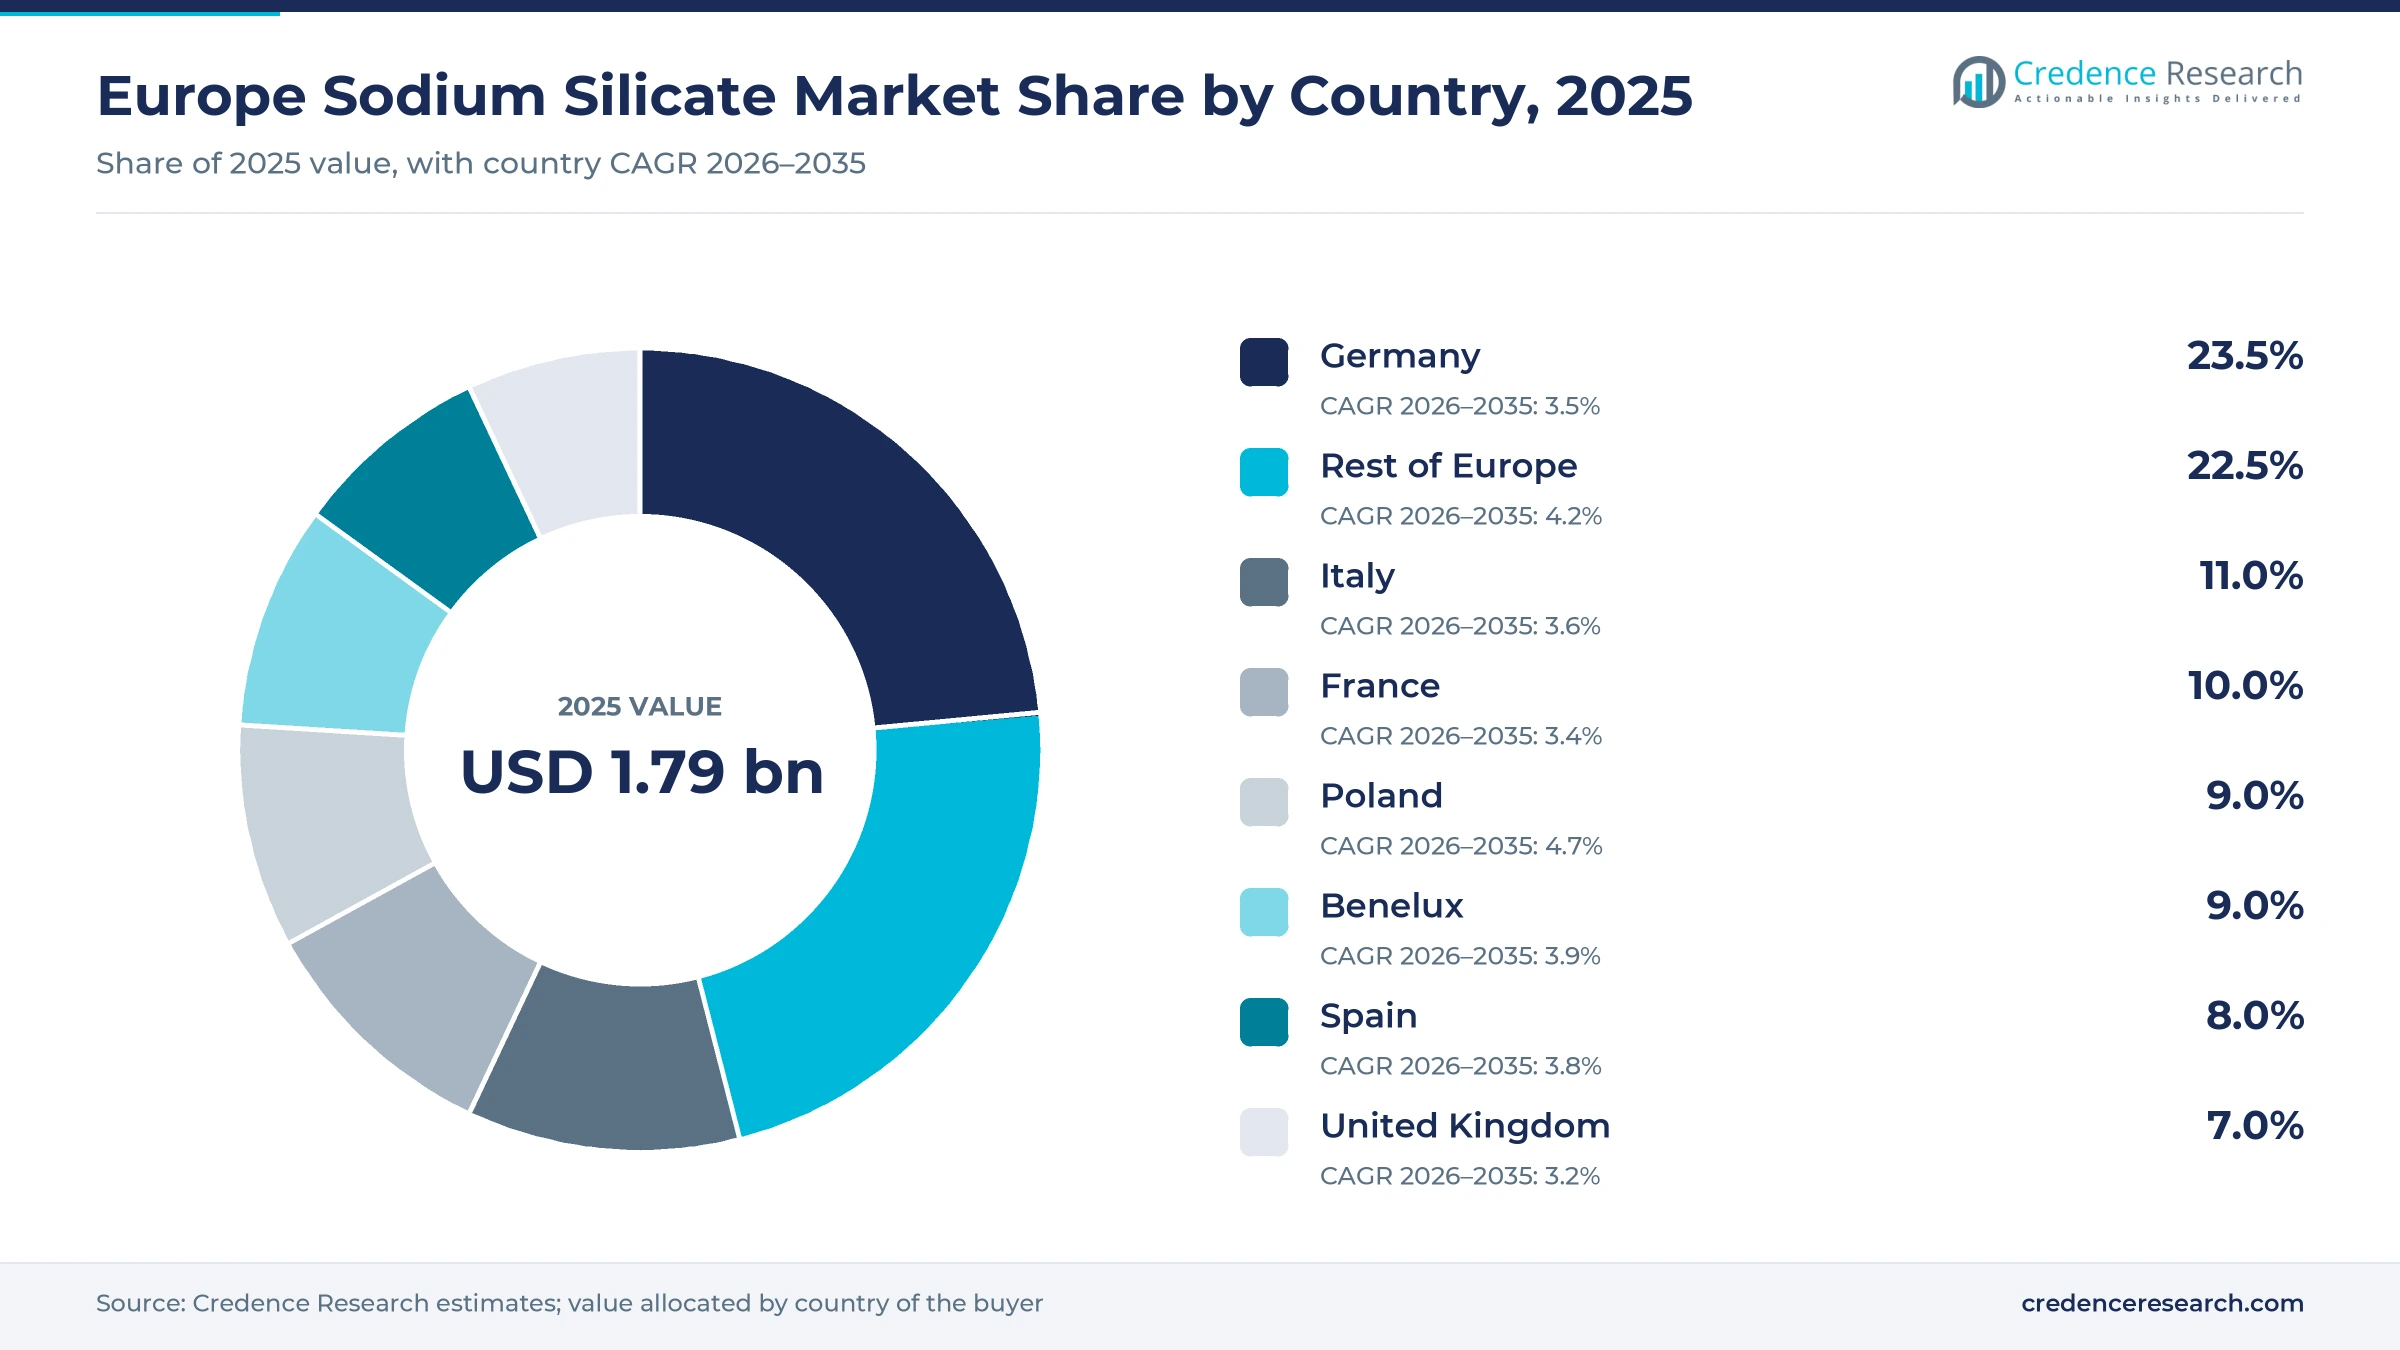
Germany leads as Poland grows fastest
| Country | Value, 2025 (USD billion) | Share, 2025 | CAGR, 2026–2035 |
|---|---|---|---|
| Germany | 0.42 | 23.5% | 3.5% |
| Rest of Europe | 0.40 | 22.5% | 4.2% |
| Italy | 0.20 | 11.0% | 3.6% |
| France | 0.18 | 10.0% | 3.4% |
| Poland | 0.16 | 9.0% | 4.7% |
| Benelux | 0.16 | 9.0% | 3.9% |
| Spain | 0.14 | 8.0% | 3.8% |
| United Kingdom | 0.13 | 7.0% | 3.2% |
Germany leads on detergent, chemical and paint demand
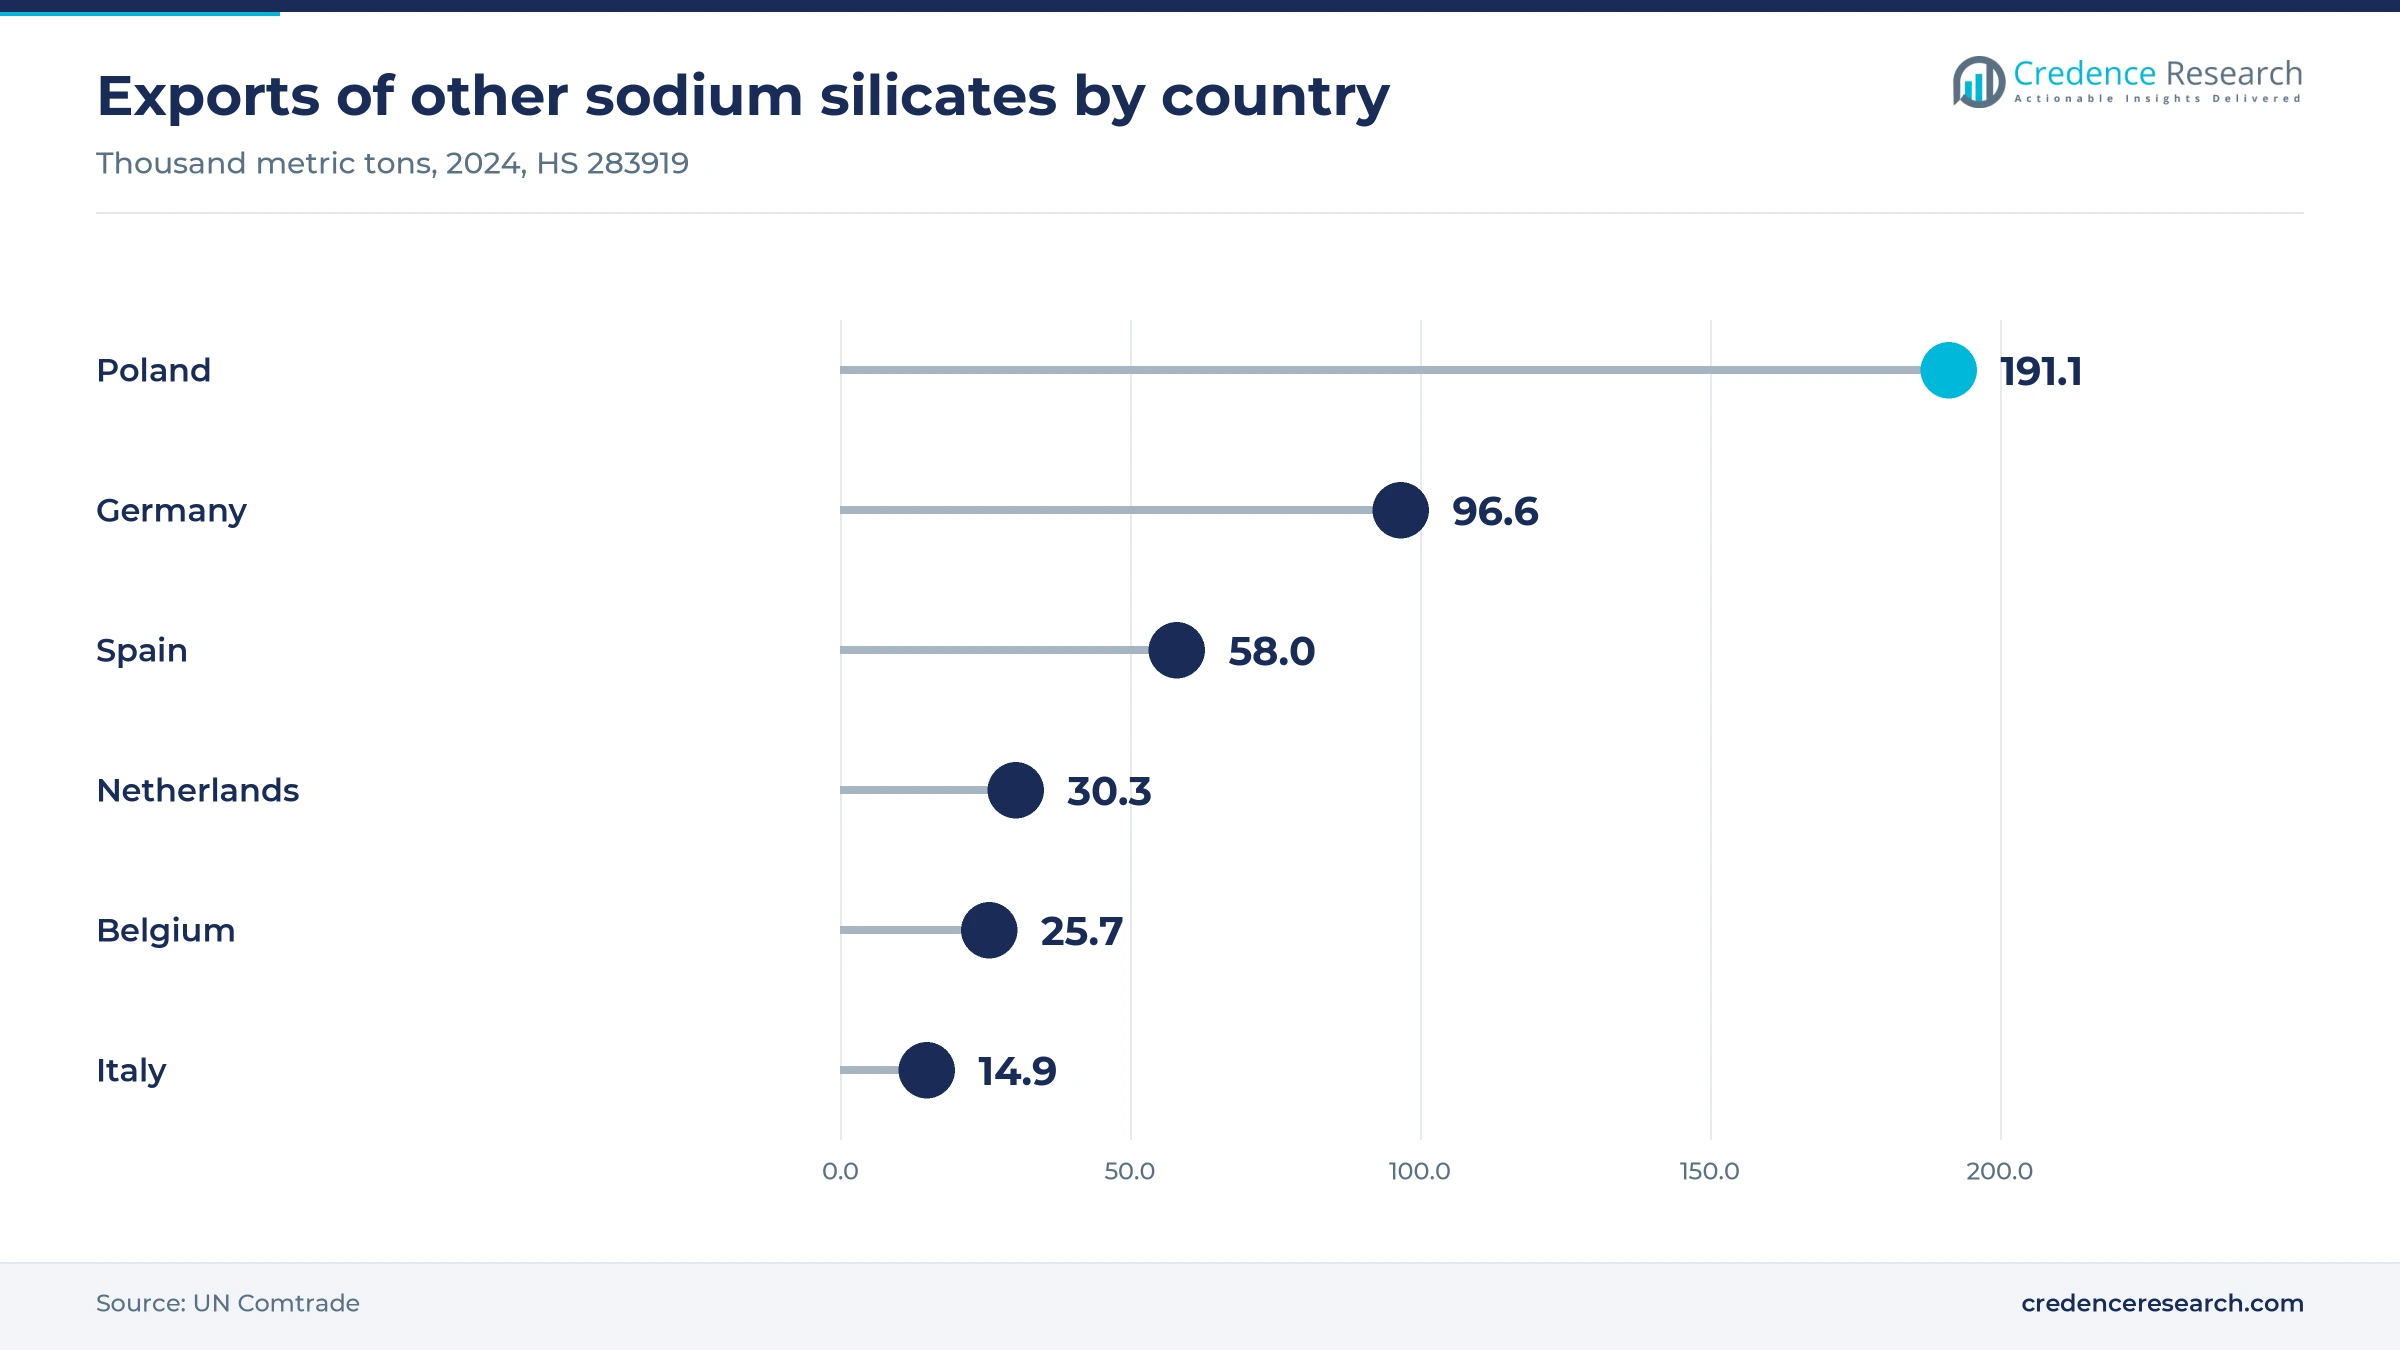
Germany held 23.5% of 2025 value and grows at 3.5% a year, because it hosts the region's largest detergent, chemical and paint industries and several furnaces. Germany exported about 96,600 metric tons of other sodium silicates in 2024 and imported about 68,800 tons, UN Comtrade data show, so it trades heavily in both directions. The BASF plant at Duesseldorf, which is being sold to PQ, and the Woellner plant in Ludwigshafen anchor local supply. Weak construction output in Germany keeps growth slightly below the regional average.
Italy builds on tire silica and local producers
Italy held 11.0% of 2025 value and grows at 3.6% a year, close to the regional rate, because its silica, ceramics and detergent industries buy steady volumes. The Livorno silica unit noted above gives Italian silicate demand a bio-based outlet tied to tire makers. Ingessil, a Verona producer active since 1956, says it leads Italian sodium silicate production and makes sodium and potassium silicates. Italy exported about 14,900 tons of other sodium silicates in 2024 at about USD 520 per ton, UN Comtrade data show, a sign of a specialty mix.
France loses tire volume while detergents hold
France held 10.0% of 2025 value and grows at 3.4% a year, below the regional rate, because tire and paper closures cut industrial demand. Michelin announced in November 2024 that it would end production at Cholet and Vannes by early 2026, affecting 1,254 employees, after Cholet output fell from about 4.4 million to about 2.6 million tires since 2019. Public data on French silicate output are thin, so this share is a Credence Research estimate with a wide error range.
Poland grows fastest on export furnace capacity
Poland held 9.0% of 2025 value and grows fastest at 4.7% a year, because its furnaces serve silica and detergent plants across the region. Poland exported about 191,100 metric tons of other sodium silicates in 2024 at about USD 383 per ton, the largest volume in Europe, UN Comtrade data show. Qemetica runs plants at Zary and Ilowa, and Zaklady Chemiczne Rudniki, which calls itself the leader of the Polish silicate market, sells sodium silicate glass, liquid water glass and dried sodium silicate. Low-cost furnace capacity and nearby silica buyers support further share gains for Polish producers.
Spain relies on a large Zaragoza producer
Spain held 8.0% of 2025 value and grows at 3.8% a year, slightly above the regional rate, because detergent, ceramics and construction buyers draw on domestic supply. Industrias Quimicas del Ebro runs a silicate manufacturing plant in the Malpica area of Zaragoza, which engineering firm IDOM helped expand. Spain exported about 58,000 metric tons of other sodium silicates in 2024 at about USD 370 per ton, UN Comtrade data show, while Spanish construction output fell 3.9% in December 2025 from a year earlier.
Benelux combines silica plants and specialty makers
Benelux held 9.0% of 2025 value and grows at 3.9% a year, because it pairs a large silica plant with specialty producers. Qemetica's Delfzijl silica plant in the Netherlands dissolves silicate for tire and industrial silica, and Silmaco in Belgium sells liquid, granular and powdered silicates for detergents, foundries, grouting and water treatment. Dutch exports averaged about USD 1,695 per ton in 2024, more than four times the Belgian average, UN Comtrade data show, reflecting a specialty-heavy Dutch mix.
United Kingdom relies on domestic supply
The United Kingdom held 7.0% of 2025 value and grows at 3.2% a year, the slowest rate, because paper and tire output have declined. PQ Silicas U.K. holds an Environment Agency permit for its Warrington silicas installation, which serves British buyers from within the country. The U.K. imported only about 1,400 metric tons of other sodium silicates in 2024, UN Comtrade data show, which suggests that domestic plants meet most bulk demand.
Rest of Europe gains on Nordic and Turkish silica
The rest of Europe held 22.5% of 2025 value and grows at 4.2% a year, faster than the region, as Turkish and Nordic silica and silicate plants expand. Evonik's Adapazari site in Turkey began commercial production of certified circular silica in June 2026, and PQ now runs the Lodose plant in Sweden. Switzerland adds specialty demand for binders through vanBaerle, based in Muenchenstein and now part of PQ. Public data on Turkish silicate output are thin, so this share carries a wide error range.
PQ deals, BASF exit and circular silica launches
| Development | Status and market relevance |
|---|---|
| In January 2024, PQ acquired the specialty silicate business of vanBaerle of Muenchenstein, Switzerland. | Completed acquisition; adds binders for welding electrodes, paints and construction to the PQ network in Europe. |
| In December 2024, Qemetica completed its purchase of the PPG precipitated silica business, including Delfzijl in the Netherlands. | Completed acquisition; makes Qemetica the third-largest European silica producer and a larger captive user of its own silicate. |
| In January 2025, PQ completed its acquisition of the Sibelco specialty silicate business at Lodose, Sweden. | Completed acquisition; extends PQ supply to Nordic detergent, paper and industrial customers. |
| In January 2026, Solvay inaugurated a unit in Livorno, Italy, making tire silica from bio-based sodium silicate. | Operational launch; the first European bio-circular silica plant, with about 35% lower carbon emissions per ton. |
| In May 2026, BASF agreed to sell its silicates business, including assets at Duesseldorf, to PQ. | Signed agreement; closing expected in the second half of 2026 subject to regulatory approvals and customary conditions. |
Furnace route and ratio control set product value
- Tank furnace melting fuses quartz sand and soda ash at 1,300 to 1,400 degrees Celsius into glass with a silica to soda ratio of about 3.3.
- Revolving hearth furnaces melt at 1,100 to 1,200 degrees Celsius in about five hours, using about 120 cubic meters of gas per ton of glass.
- Hydrothermal dissolution reacts sand with caustic soda under pressure to make low-ratio liquid grades without a glass furnace.
- Ratio and viscosity control tunes solutions for detergents, paper, grouts and paints, which is where specialty producers earn premiums.
Need a Custom Version of This Report?
Tailor the scope, geography, or segments to your exact requirements.
- Custom geography or segment scope
- Direct access to our analyst team
PQ and Qemetica set the pace among regional makers
Competition turns on delivered cost, furnace efficiency, ratio range and qualification with silica, detergent and paint makers rather than on branding. PQ is building the widest network, having added vanBaerle, Lodose and, once closed, the BASF business at Duesseldorf. Qemetica competes on scale from its Polish furnaces and on its own silica plant at Delfzijl. Woellner, Silmaco, IQE, Rudniki and Ingessil serve customers within delivery range and compete on custom grades and service. Buyers of liquid grades usually stay with the nearest furnace, while silica plants sign multiyear glass contracts. Public data on the output of individual producers are not available, so producer shares are an evidence gap. The eight companies profiled below cover bulk glass, liquid grades and specialty silicates.
Where do margins sit along the supply chain?
The supply side of the market runs in three distinct tiers. Large multi-site producers, led by PQ and Qemetica, run several furnaces and sell glass, liquid and specialty grades across borders. Silica makers such as Evonik and Solvay melt or buy glass for their own silica plants, so part of the volume never reaches the open market. A third tier of regional producers, including Woellner, Silmaco, IQE, Rudniki and Ingessil, serves buyers within delivery range. Entry barriers sit in furnace capital, emission permits and customer qualification. Margins are thin in bulk glass and highest in metasilicates, binders and certified water treatment grades.
Companies profiled and their roles in this market
| Company | Type | Role in the market |
|---|---|---|
| PQ | Multi-site producer | Makes liquid, solid and specialty silicates; buying the BASF Duesseldorf business |
| Qemetica | Multi-site producer | Makes glassy and liquid sodium silicate at Zary and Ilowa, Poland |
| BASF SE | Producer, exiting | Sells sodium silicates from Duesseldorf until the sale to PQ closes |
| Wöllner GmbH | Regional producer | Makes industrial silicates and derivatives in Ludwigshafen, Germany |
| Silmaco NV | Regional producer | Makes customized liquid, granular and powdered silicates in Belgium |
| Industrias Químicas del Ebro (IQE) | Regional producer | Makes sodium silicates at its Zaragoza plant in Spain |
| Zakłady Chemiczne Rudniki | Regional producer | Makes sodium silicate glass, water glass and dried silicates in Poland |
| Ingessil | Regional producer | Makes sodium and potassium silicates in Verona, Italy |
Consolidation favors energy-efficient furnace owners
Credence Research's view is that consolidation and energy costs will decide who earns money from European sodium silicate over the next decade. PQ and Qemetica are building scale from different directions, PQ through acquisitions and Qemetica through furnace capacity and its own silica plant. Bulk glass will stay a low-margin product, while metasilicates, binders and certified water treatment grades carry better returns. Buyers should secure multiyear contracts with a second qualified supplier before the BASF sale closes, and producers with old tank furnaces should plan heat recovery or partners.
Earlier estimate rolled forward and tested on output
The report uses 2025 as the base year and forecasts to 2035. The earlier Credence Research estimate for 2024 was rolled forward one year at its own growth rate and tested against producer capacity, UN Comtrade trade volumes and unit values, and furnace energy data. Country and segment shares are Credence Research estimates based on furnace locations, silica, detergent and paper output, and trade flows. Sources include Eurostat, the IMF, UN Comtrade, EU legislation, company releases and trade associations. No interviews or surveys were conducted for this update of the estimate.
Silica and binder demand carry growth to 2035
Growth to 2035 depends on European gas prices, on how much tire and paper capacity stays in the region and on how quickly silica makers adopt certified feedstocks. The base case assumes gas prices ease, detergent rules stay as adopted and silica output holds. Binders for paints, grouts and geopolymers should gain share, while pulp and paper uses lose ground. Poland and the rest of Europe gain from export furnaces and new silica capacity, while Germany remains the largest single country market.
Gas prices and tire output set the range of outcomes
The spread of outcomes depends mainly on European gas prices and on how much tire and paper capacity stays in the region. High gas prices would close older furnaces and push buyers toward imported silica. Stable gas prices and more silica made in Europe for low rolling resistance tires would lift volumes. Binder demand from low-carbon construction and certified water treatment is the main upside to the base case.
| Scenario | CAGR, 2026–2035 | Value, 2035 | What has to hold |
|---|---|---|---|
| Downside | 2.6% | USD 2.35 billion | Gas stays above USD 15 per MMBtu and more tire and paper mills close |
| Base | 3.83% | USD 2.61 billion | Gas prices ease, silica output holds and detergent rules stay as adopted |
| Upside | 4.8% | USD 2.85 billion | Tire silica expands in Europe and silicate binders win low-carbon construction work |
Frequently Asked Questions
How big is the Europe sodium silicate market?
Which application uses the most sodium silicate in Europe?
Which country leads the European sodium silicate market?
Who are the main sodium silicate producers in Europe?
Who supplies sodium silicate in the U.K.?
Is BASF selling its sodium silicate business?
How much does sodium silicate cost in Europe?
Which application grows fastest in Europe?
Table of Content
Chapter 1 Market Segmentation
- 1.1 Segmentation Framework
- 1.1.1 Product and Service Classification
- 1.1.2 Application and End-Use Classification
- 1.1.3 Technology and Solution Classification
- 1.1.4 Customer and Distribution Channel Classification
- 1.1.5 Geographic Segmentation
- 1.1.6 Market Segment Definitions and Boundaries
- 1.2 By Type
- 1.2.1 Liquid
- 1.2.2 Solid
- 1.3 By Form
- 1.3.1 Anhydrous
- 1.3.2 Crystalline
- 1.4 By Application
- 1.4.1 Catalysts & Silica Derivatives
- 1.4.2 Detergents
- 1.4.3 Pulp & Paper
- 1.4.4 Adhesives & Paints
- 1.4.5 Refractories
- 1.4.6 Food Preservation
- 1.4.7 Others
- 1.5 By Country
- 1.5.1 Germany
- 1.5.2 Italy
- 1.5.3 France
- 1.5.4 Poland
- 1.5.5 Spain
- 1.5.6 Benelux
- 1.5.7 United Kingdom
- 1.5.8 Rest of Europe
Chapter 2 Introduction
- 2.1 Report Objectives and Scope
- 2.2 Product Definition and Industry Terminology
- 2.3 Market Inclusions and Exclusions
- 2.4 Research Process
- 2.4.1 Primary Research and Expert Interviews
- 2.4.2 Secondary Research and Source Review
- 2.4.3 Top-Down and Bottom-Up Estimation
- 2.4.4 Data Triangulation and Verification
- 2.5 Market Size Measurement Basis
- 2.5.1 2025: USD 1.79 billion → 2035: USD 2.61 billion
- 2.6 Historical and Forecast Reference Periods
- 2.6.1 Historical Period: 2018-2025
- 2.6.2 Base Year: 2025
- 2.6.3 Forecast Period: 2025-2035
- 2.7 Research Assumptions and Limitations
Chapter 3 Executive Summary
- 3.1 Market Snapshot and Key Findings
- 3.2 Base-Year Market Size, 2025
- 3.3 Forecast Market Size, 2035
- 3.4 Revenue and Volume Growth Outlook
- 3.5 Key Demand and Supply Indicators
- 3.6 Leading Market Segments
- 3.7 Fastest-Growing Market Opportunities
- 3.8 Regional Performance Highlights
- 3.9 Technology and Industry Transformation
- 3.10 Competitive Landscape Summary
- 3.11 Analyst View and Strategic Implications
Chapter 4 Europe Sodium Silicate Market Trends and Developments
- 4.1 Historical Industry Development, 2018-2025
- 4.2 Recent Market Trends and Developments
- 4.3 Demand and Customer Behavior Trends
- 4.4 Technology and Product Innovation
- 4.5 Artificial Intelligence, Automation and Digitalization
- 4.6 Local Manufacturing and Supply Chain Realignment
- 4.7 Industry Partnerships, Mergers and Acquisitions
- 4.8 Sustainability and Circular Economy Developments
- 4.9 Government and Private Sector Investment Trends
- 4.10 Emerging Business Models and Commercialization
- 4.11 Industry Developments and Announcements
Chapter 5 Europe Sodium Silicate Market Production, Supply and Demand Analysis
- 5.1 Demand Trend and Consumption Analysis, 2018-2025
- 5.2 Demand Forecast, 2025-2035
- 5.3 Production and Output Trend, 2018-2025
- 5.4 Production and Output Forecast, 2025-2035
- 5.5 Installed Capacity and Capacity Utilization
- 5.6 Company-Wise Production Plants and Statistics
- 5.6.1 Installed Production Capacity
- 5.6.2 Actual Production
- 5.6.3 Planned Capacity and Expansion Targets
- 5.7 Supply Chain Structure and Procurement Trends
- 5.8 Supply-Demand Gap and Bottlenecks
- 5.9 Import Dependence and Sourcing Structure
- 5.10 Contract Manufacturing and Outsourcing
- 5.11 Regional Supply and Demand Concentration
Chapter 6 Europe Sodium Silicate Market Pricing Analysis
- 6.1 Pricing Structure and Measurement
- 6.2 Historical Pricing Trends, 2018-2025
- 6.3 Pricing Outlook, 2025-2035
- 6.4 Average Selling Price and Unit Economics
- 6.5 Pricing by Product and Market Segment
- 6.6 Geographic Pricing Differences
- 6.7 Key Input, Energy, Labor and Logistics Costs
- 6.8 Contract Pricing and Purchasing Models
- 6.9 Pricing Sensitivity and Competitive Positioning
- 6.10 Price, Margin and Profitability Implications
Chapter 7 Europe Sodium Silicate Market Dynamics
- 7.1 Market Growth Drivers
- 7.1.1 Demand-Side Drivers
- 7.1.2 Technology and Innovation Drivers
- 7.1.3 Infrastructure and Investment Drivers
- 7.1.4 Regulatory and Policy Drivers
- 7.2 Market Restraints
- 7.2.1 Cost and Affordability Constraints
- 7.2.2 Technology and Adoption Barriers
- 7.2.3 Supply Chain and Operational Constraints
- 7.3 Market Challenges
- 7.3.1 Competitive Pressure and Margin Erosion
- 7.3.2 Skills, Infrastructure and Implementation Gaps
- 7.4 Emerging Market Opportunities
- 7.5 Market Dynamics Impact and Time-Horizon Assessment
Chapter 8 Europe Sodium Silicate Value Chain Analysis
- 8.1 Industry Value Chain Overview
- 8.2 Upstream Suppliers and Critical Inputs
- 8.3 Technology and Component Providers
- 8.4 Manufacturing or Service Delivery
- 8.5 Distribution, Channel Partners and Integrators
- 8.6 Downstream Applications and End Users
- 8.7 Value Addition and Profit Pools
- 8.8 Vertical Integration and Outsourcing
- 8.9 Supplier Concentration and Risk
- 8.10 Supply Chain Localization and Resilience
Chapter 9 Europe Sodium Silicate Market Regulations and Policies
- 9.1 Relevant Laws, Standards and Compliance Frameworks
- 9.2 Product, Service, Safety and Quality Requirements
- 9.3 Government Policies, Incentives and Subsidies
- 9.4 Imports, Exports and Trade Barriers
- 9.5 Public Procurement and Local Content Requirements
- 9.6 Environmental and Sustainability Compliance
- 9.7 Upcoming Policy Changes and Market Implications
Chapter 10 Europe Sodium Silicate Market Hotspots and Opportunities
- 10.1 Market Opportunity Mapping and Growth Hotspots
- 10.2 High-Growth Applications and Customer Groups
- 10.3 Underserved Markets and White-Space Opportunities
- 10.4 Emerging Technology and Product Opportunities
- 10.5 New Capacity and Investment Hotspots
- 10.6 Market Entry and Expansion Opportunities
- 10.7 Distribution and Partnership Opportunities
- 10.8 Near-Term and Long-Term Commercial Potential
- 10.9 Opportunity Attractiveness and Execution Risks
Chapter 11 Europe Sodium Silicate Market Outlook, 2025-2035
- 11.1 Market Size and Analysis
- 11.1.1 Revenue (Market Measurement: 2025: USD 1.79 billion → 2035: USD 2.61 billion)
- 11.1.2 Market Volume and Quantity Sold
- 11.1.3 Historical Market Size, 2018-2025
- 11.1.4 Base-Year Market Size, 2025
- 11.2 Market Forecast, 2025-2035
- 11.2.1 Revenue Forecast to 2035
- 11.2.2 Volume Forecast to 2035
- 11.2.3 CAGR and Year-on-Year Growth
- 11.2.4 Incremental Revenue Opportunity
- 11.3 Forecast Assumptions and Scenario Analysis
- 11.3.1 Base-Case Forecast
- 11.3.2 Optimistic and Conservative Scenarios
- 11.3.3 Technology, Pricing and Policy Sensitivities
- 11.4 Market Attractiveness and Growth Outlook
Chapter 12 Europe Sodium Silicate Market Segmentation and Outlook
- 12.1 Segmentation Summary and Market Shares, 2025
- 12.2 Largest and Fastest-Growing Segments
- 12.3 By Type - Market Size and Forecast, 2025-2035
- 12.3.1 Segment Definition and Scope
- 12.3.2 Historical Market Size, 2018-2025
- 12.3.3 Revenue Forecast, 2025-2035
- 12.3.4 Volume Forecast, 2025-2035
- 12.3.5 Base-Year Market Share, 2025
- 12.3.6 Segment CAGR and Growth Drivers
- 12.3.7 Subsegment Market Size and Forecast
- 12.3.7.1 Liquid
- 12.3.7.2 Solid
- 12.3.8 Subsegment Pricing and Adoption Trends
- 12.3.9 Leading Suppliers and Competition
- 12.3.10 Regional Demand and Opportunities
- 12.4 By Form - Market Size and Forecast, 2025-2035
- 12.4.1 Segment Definition and Scope
- 12.4.2 Historical Market Size, 2018-2025
- 12.4.3 Revenue Forecast, 2025-2035
- 12.4.4 Volume Forecast, 2025-2035
- 12.4.5 Base-Year Market Share, 2025
- 12.4.6 Segment CAGR and Growth Drivers
- 12.4.7 Subsegment Market Size and Forecast
- 12.4.7.1 Anhydrous
- 12.4.7.2 Crystalline
- 12.4.8 Subsegment Pricing and Adoption Trends
- 12.4.9 Leading Suppliers and Competition
- 12.4.10 Regional Demand and Opportunities
- 12.5 By Application - Market Size and Forecast, 2025-2035
- 12.5.1 Segment Definition and Scope
- 12.5.2 Historical Market Size, 2018-2025
- 12.5.3 Revenue Forecast, 2025-2035
- 12.5.4 Volume Forecast, 2025-2035
- 12.5.5 Base-Year Market Share, 2025
- 12.5.6 Segment CAGR and Growth Drivers
- 12.5.7 Subsegment Market Size and Forecast
- 12.5.7.1 Catalysts & Silica Derivatives
- 12.5.7.2 Detergents
- 12.5.7.3 Pulp & Paper
- 12.5.7.4 Adhesives & Paints
- 12.5.7.5 Refractories
- 12.5.7.6 Food Preservation
- 12.5.7.7 Others
- 12.5.8 Subsegment Pricing and Adoption Trends
- 12.5.9 Leading Suppliers and Competition
- 12.5.10 Regional Demand and Opportunities
- 12.6 By Country - Market Size and Forecast, 2025-2035
- 12.6.1 Segment Definition and Scope
- 12.6.2 Historical Market Size, 2018-2025
- 12.6.3 Revenue Forecast, 2025-2035
- 12.6.4 Volume Forecast, 2025-2035
- 12.6.5 Base-Year Market Share, 2025
- 12.6.6 Segment CAGR and Growth Drivers
- 12.6.7 Subsegment Market Size and Forecast
- 12.6.7.1 Germany
- 12.6.7.2 Italy
- 12.6.7.3 France
- 12.6.7.4 Poland
- 12.6.7.5 Spain
- 12.6.7.6 Benelux
- 12.6.7.7 United Kingdom
- 12.6.7.8 Rest of Europe
- 12.6.8 Subsegment Pricing and Adoption Trends
- 12.6.9 Leading Suppliers and Competition
- 12.6.10 Regional Demand and Opportunities
- 12.7 Segment Growth Comparison
- 12.8 Segment Attractiveness and Priority Matrix
Chapter 13 Europe Sodium Silicate End-Use and Application Market Outlook
- 13.1 End-Use Industry and Customer Demand Structure
- 13.2 Leading Applications and Customer Groups
- 13.3 End-Use Market Size, Share and Forecast
- 13.4 Major End-Use Industry Deep Dives
- 13.4.1 Customer Requirements and Use Cases
- 13.4.2 Demand and Replacement Cycles
- 13.4.3 Technical and Regulatory Considerations
- 13.4.4 Purchasing and Procurement Models
- 13.4.5 Leading Vendors and Distribution Channels
- 13.4.6 Forecast and Commercial Opportunities
- 13.5 Emerging Applications and Cross-Segment Demand
- 13.6 End-Use Industry Investment Priorities
Chapter 14 Europe Sodium Silicate Geographic Market Outlook, 2025-2035
- 14.1 Regional Market Size and Country-Level Shares, 2025
- 14.2 Country Market Size Comparison, 2025
- 14.3 Country Market Forecasts, 2025-2035
- 14.4 Subregional Industrial and Demand Clusters
- 14.5 Intra-Regional Pricing and Cost Differences
- 14.6 Cross-Border Trade and Supply Networks
- 14.7 Regional Supply and Demand Balances
- 14.8 Country Opportunity Comparison and Prioritization
Note: Every listed country is covered on the structure shown under the first country.
Chapter 15 Europe Sodium Silicate Technology, Innovation and Sustainability Outlook
- 15.1 Technology Landscape and Maturity
- 15.2 Product, Process and Service Innovation
- 15.3 AI, Automation and Digital Tools in the Industry
- 15.4 Technology Adoption and Performance Benchmarking
- 15.5 Innovation Pipeline and R&D Investment
- 15.6 Patent and Intellectual Property Trends
- 15.7 Energy Efficiency and Resource Management
- 15.8 Sustainability, Recycling and Circularity
- 15.9 Technology Roadmap, 2025-2035
- 15.10 Risks of Obsolescence and Technology Substitution
Chapter 16 Europe Sodium Silicate Market Key Strategic Imperatives
- 16.1 Growth and Market Entry Priorities
- 16.2 High-Return Products and Segments
- 16.3 Pricing, Profitability and Cost Optimization
- 16.4 Technology Investment and Product Differentiation
- 16.5 Supply Chain Localization and Resilience
- 16.6 Distribution and Customer Acquisition
- 16.7 Partnership, Acquisition and Capacity Strategy
- 16.8 Regional Expansion Priorities
- 16.9 Short-, Medium- and Long-Term Actions
Chapter 17 Competition Outlook
- 17.1 Industry Competition Characteristics
- 17.2 Market Structure and Concentration
- 17.3 Market Share and Competitive Positioning, 2025
- 17.4 Company-Wise Revenue and Product Benchmarking
- 17.5 Production and Service Capacity Benchmarking
- 17.6 Technology, Pricing and Differentiation
- 17.7 Regional Footprint and Distribution Strength
- 17.8 Mergers, Acquisitions and Strategic Alliances
- 17.9 New Entrants and Competitive Threats
- 17.10 Porter's Five Forces and Industry Attractiveness
- 17.11 Competitive Outlook, 2025-2035
Chapter 18 Company Profiles
- 18.1 Company Coverage and Selection Criteria
- 18.2 PQ
- 18.2.1 Business Description
- 18.2.2 Company Ownership and Geographic Presence
- 18.2.3 Product and Service Portfolio
- 18.2.4 Manufacturing and Operating Footprint
- 18.2.5 Production Capacity and Expansion Plans
- 18.2.6 Financial Performance and Investment
- 18.2.7 Market Share and Competitive Position
- 18.2.8 Technology and Innovation Capabilities
- 18.2.9 Strategic Alliances or Partnerships
- 18.2.10 Recent Developments
- 18.2.11 Growth Strategy and Outlook
- 18.3 Qemetica
- 18.4 BASF SE
- 18.5 Wöllner GmbH
- 18.6 Silmaco NV
- 18.7 Industrias Químicas del Ebro (IQE)
- 18.8 Zakłady Chemiczne Rudniki
- 18.9 Ingessil
- 18.10 Other Relevant Market Participants
Note: Every listed company is profiled on the structure shown under the first company. The company list is preliminary and may change based on research findings, market developments, data availability and client requirements.
Chapter 19 Disclaimer
- 19.1 Research and Forecast Disclaimer
- 19.2 Data Source and Estimation Limitations
Note: The depth of individual sections depends on data availability for this market. Volume, capacity, trade and other unit-based metrics are included where applicable.

