
Older fleets and tighter oil specs keep value rising
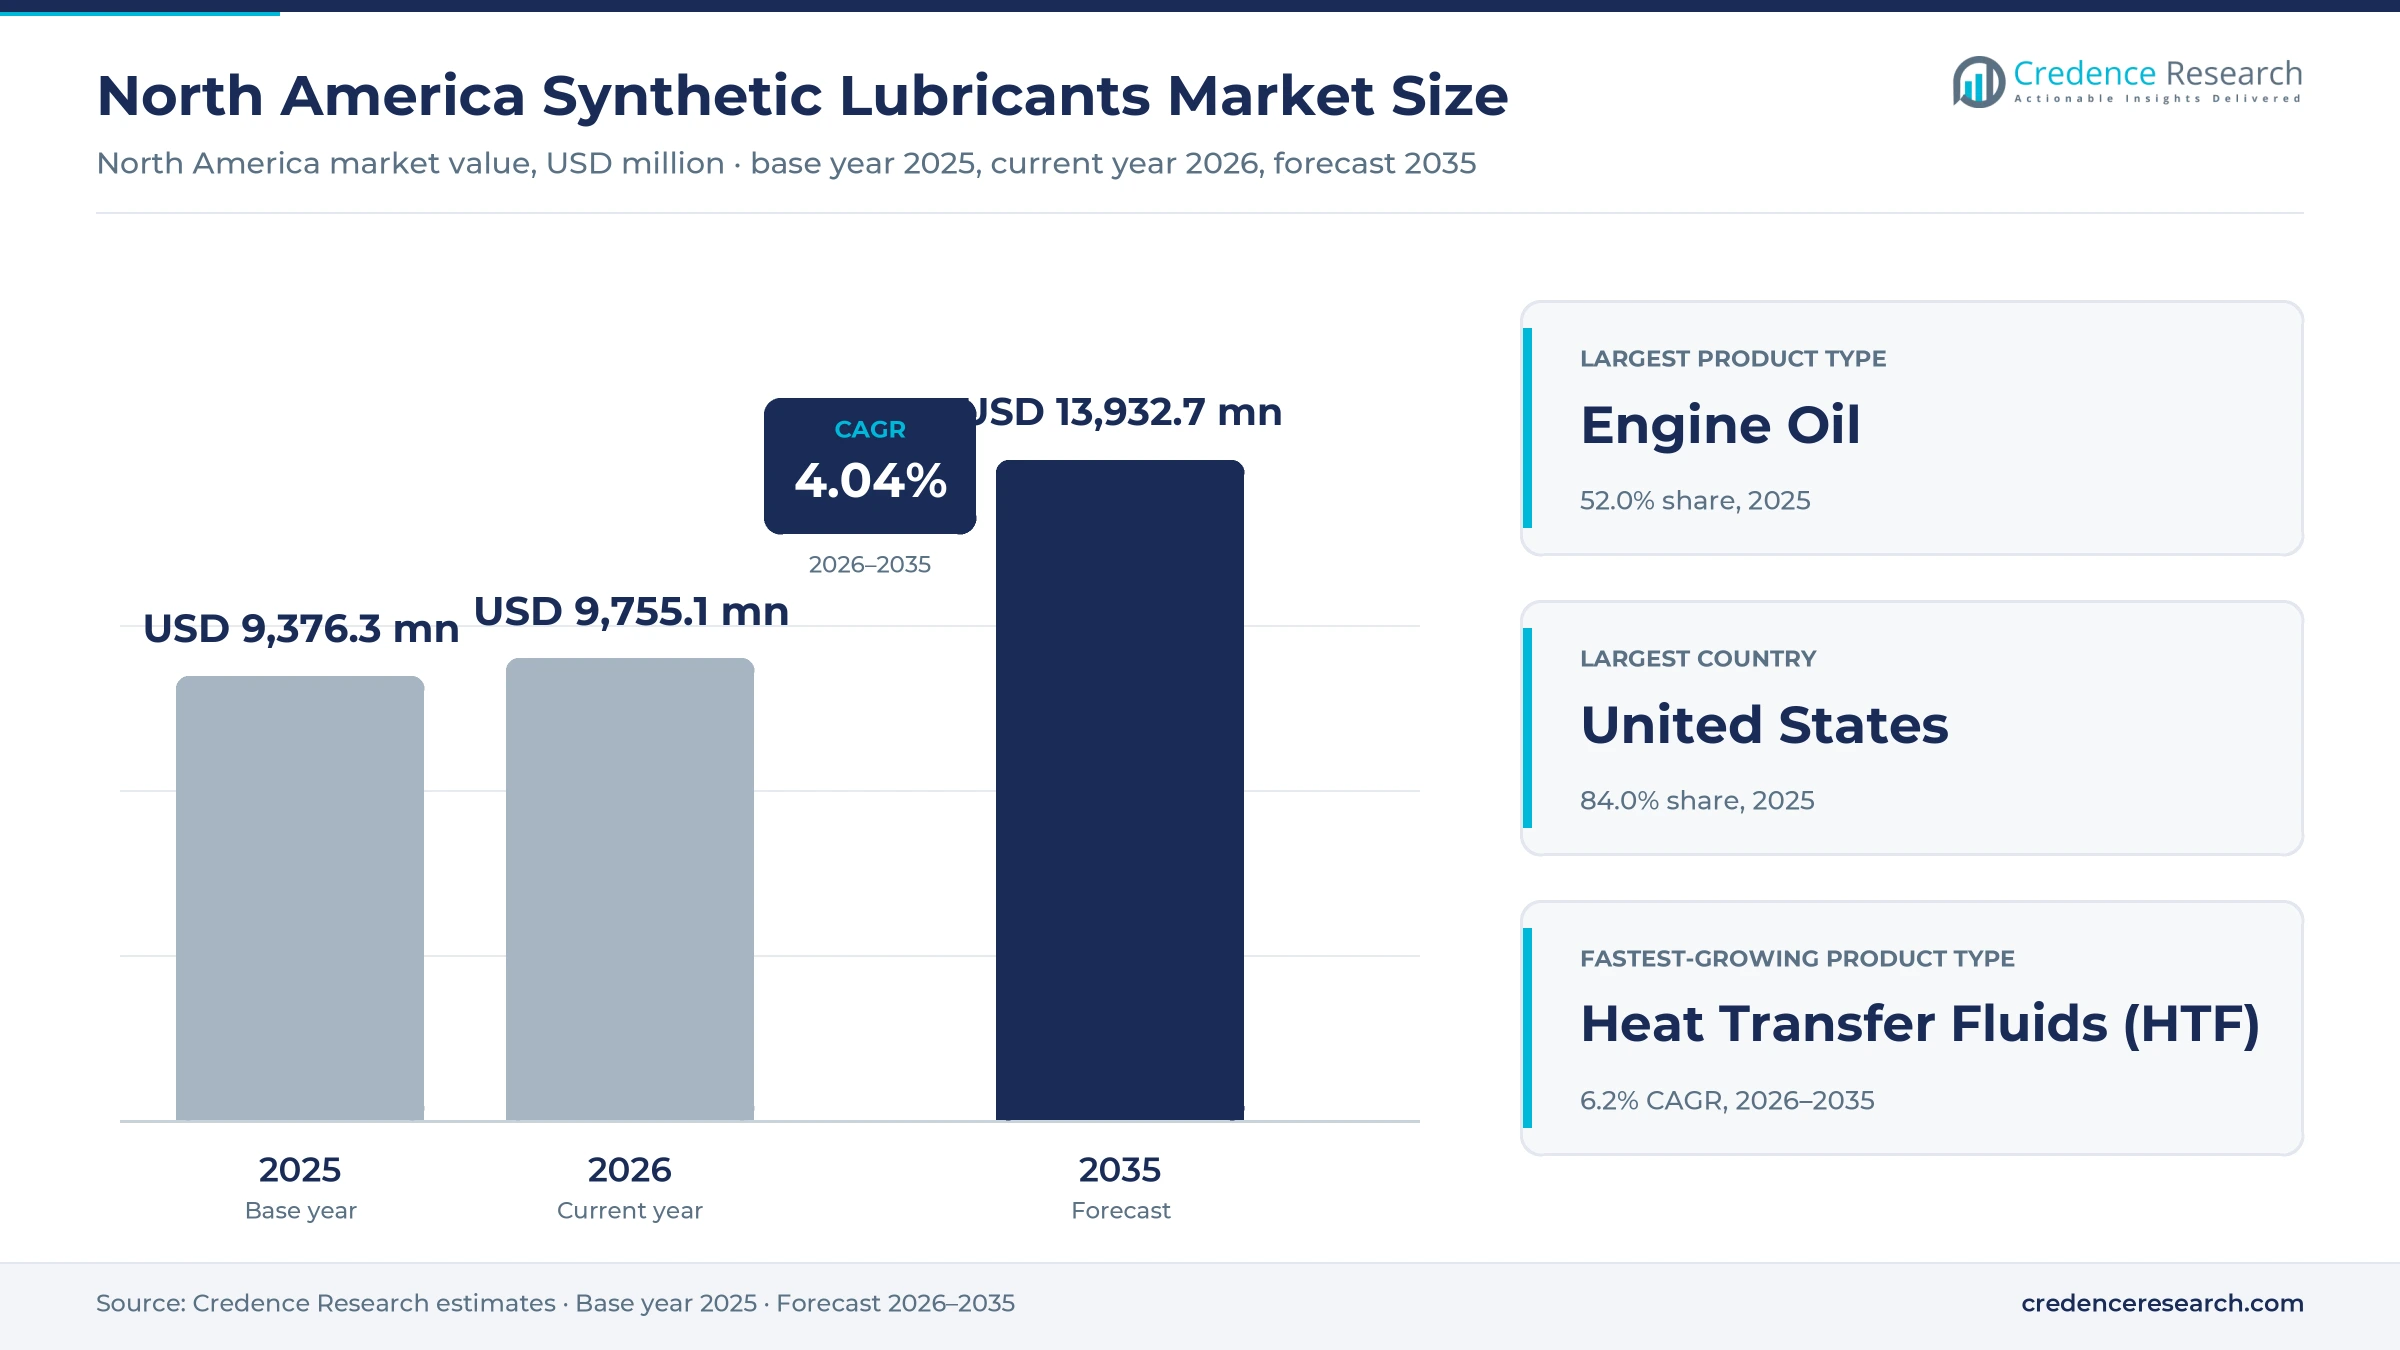
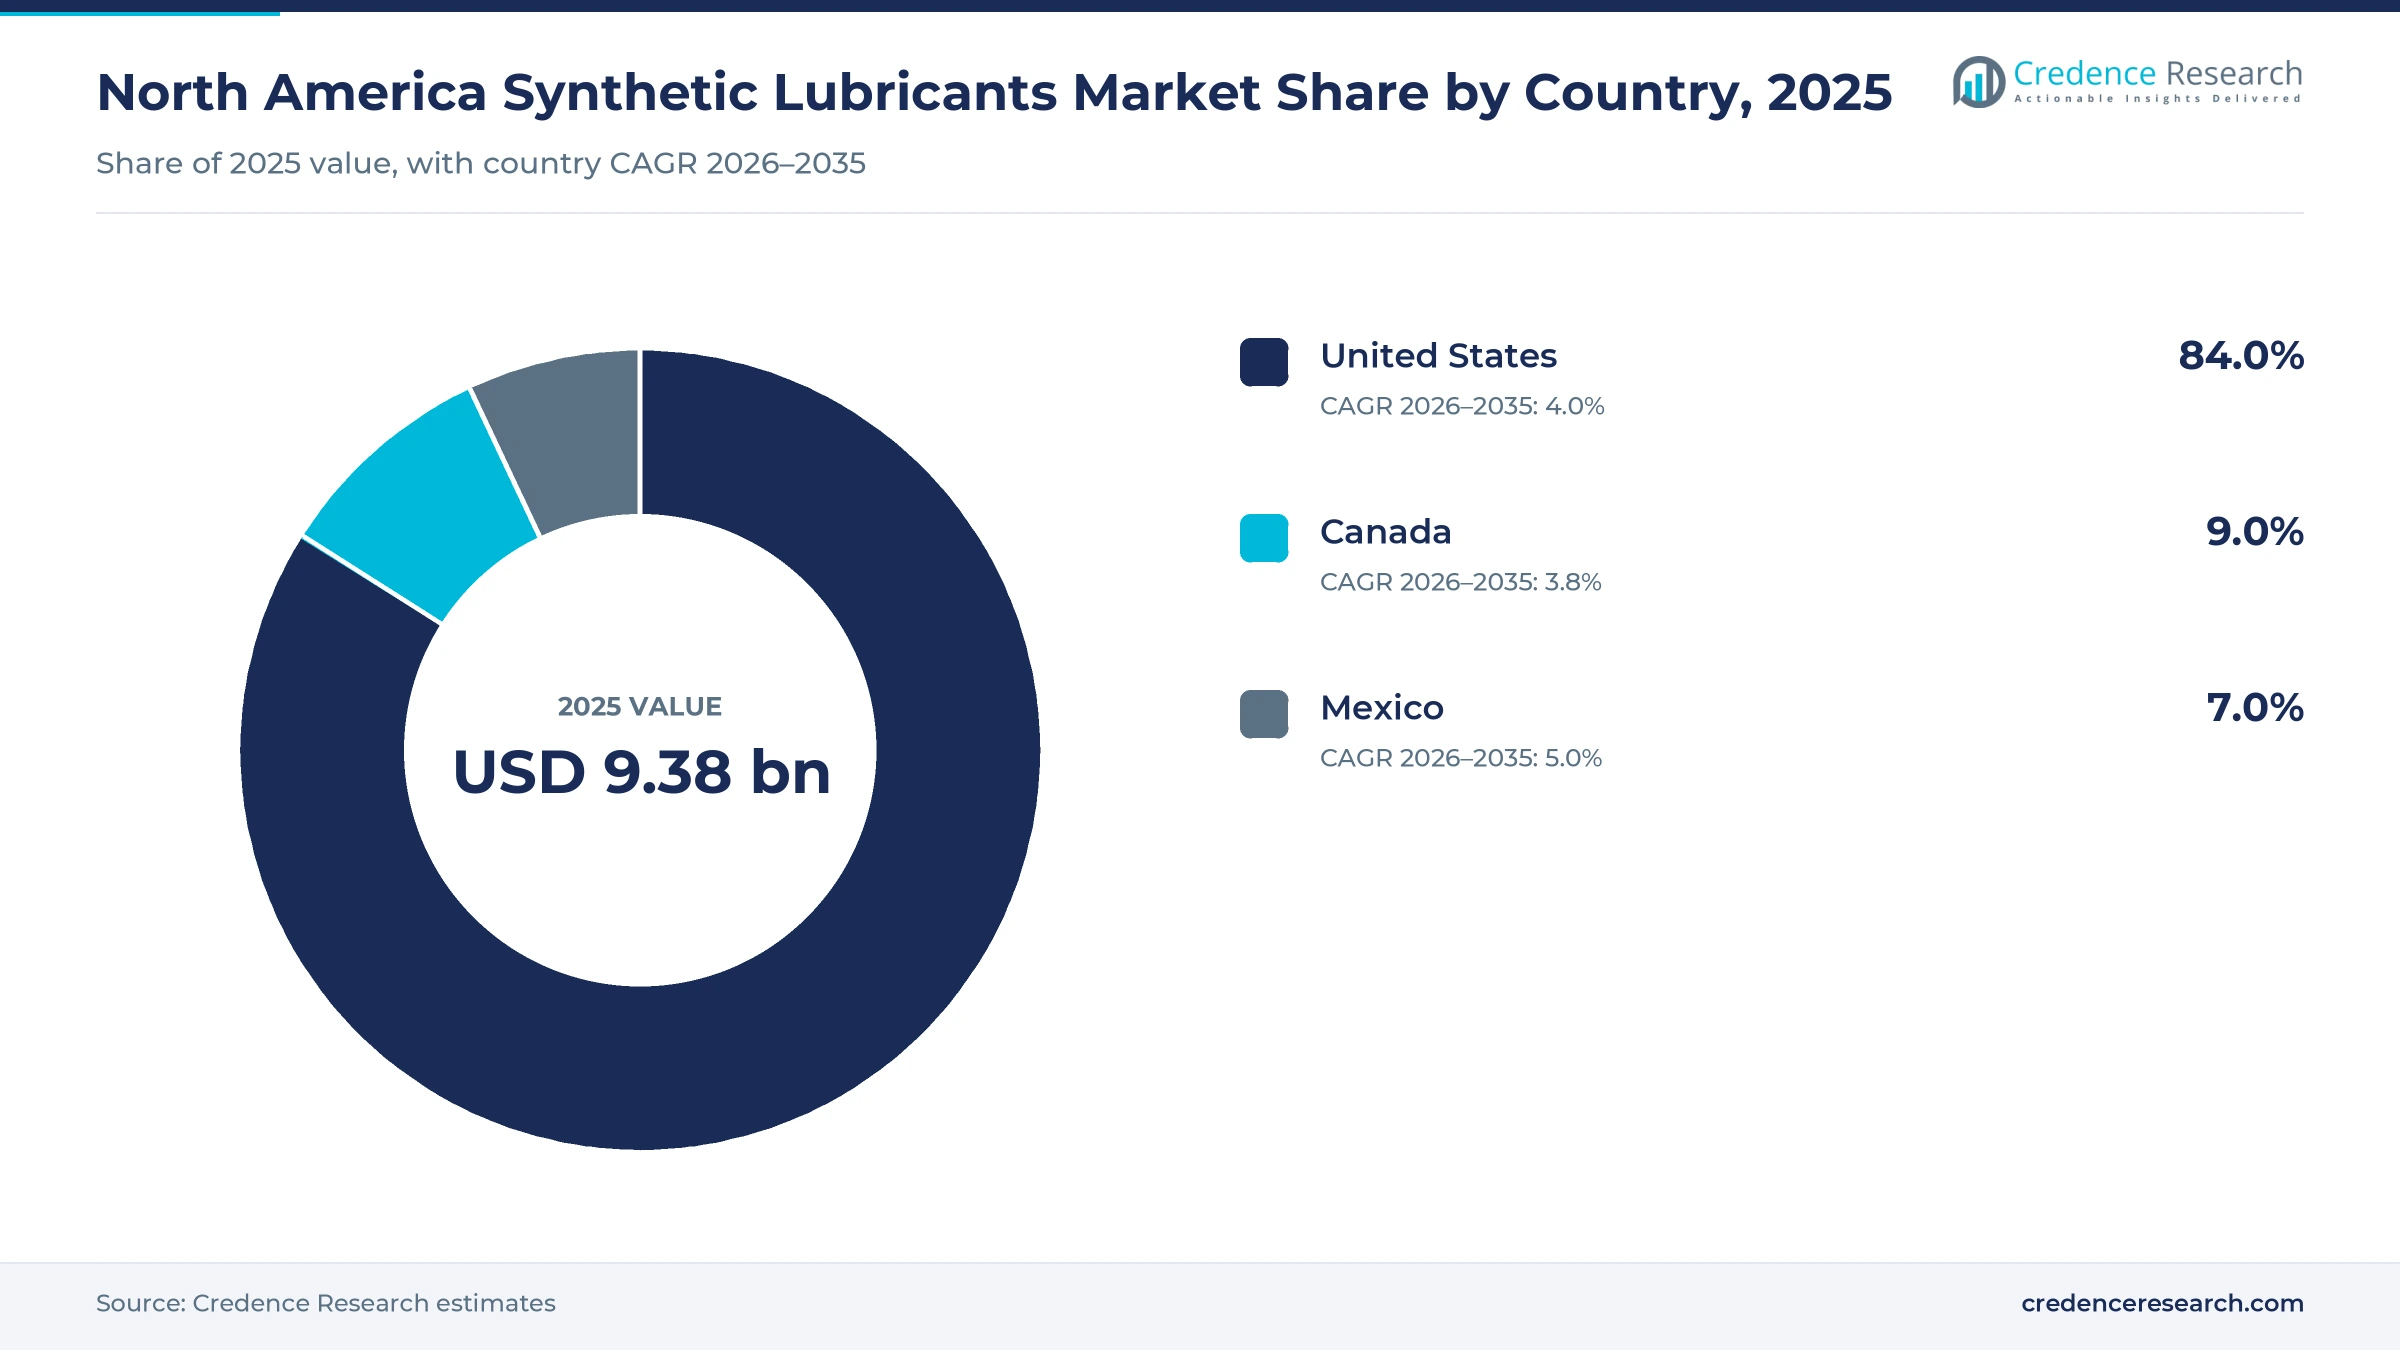
The North America synthetic lubricants market was valued at USD 9.38 billion in 2025 and is projected to increase from USD 9.76 billion in 2026 to USD 13.93 billion by 2035, registering a CAGR of 4.04% during 2026–2035. Demand comes from passenger car and heavy-duty engine oils, automatic and electric drivetrain fluids, industrial gear and compressor oils, heat transfer fluids and metalworking fluids bought by fleets, quick-lube chains, carmakers, utilities and factories. The United States held the largest share, 84.0% in 2025, because it combines the largest vehicle fleet with Gulf Coast base stock and additive production. Mexico is the fastest-growing country at 5.0% a year, as vehicle assembly for export keeps factory-fill and plant maintenance volumes rising. The main commercial change is the move to lower-viscosity engine oil categories for cars in 2025 and for heavy-duty diesel engines in 2027, which raises the share of fully synthetic formulations in each liter sold.
Finished synthetic fluids are counted at first sale
The estimate measures the value of finished lubricants formulated on polyalphaolefin, synthetic ester, polyalkylene glycol and other synthetic base stocks, including Group III-based oils sold as full synthetic, across the United States, Canada and Mexico. It covers engine oils, heat transfer fluids, transmission fluids, metalworking fluids, greases, gear oils and compressor oils sold through retail, quick-lube, dealer, distributor and direct industrial channels.
The estimate excludes mineral and semi-synthetic blends, base stocks and additives sold to other blenders, process oils and fuels. Value is counted at the first sale of the finished lubricant, so retail markups and oil change labor are not included, and re-exports outside the region are left out.
North America Synthetic Lubricants Market Insights
- The North America synthetic lubricants market was valued at USD 9.38 billion in 2025 and is projected to reach USD 13.93 billion by 2035, registering a CAGR of 4.04% during 2026–2035.
- The United States held 84.0% of 2025 value, because it pairs a fleet of 289 million light vehicles with most of the region's base stock capacity.
- Engine oil led product types with 52.0% of 2025 value, because ILSAC GF-7 and API SQ oils took effect on March 31, 2025.
- U.S. EV sales took 7.8% of the new vehicle market in 2025, down from 8.1% in 2024, which keeps engine oil demand larger for longer.
- Ownership is shifting, as Shell sold Jiffy Lube in July 2026 and BP completed the sale of 65% of Castrol in November 2026.
PAO engine oils lead while power and cooling fluids gain
Why does PAO hold the largest share of base stock value?
Based on type, the market is categorized into PAO, esters, PAG and others. PAO led with 46.0% of 2025 value, because it combines low pour points with oxidation stability in engine, gear and compressor oils, and Chevron Phillips Chemical makes it at Cedar Bayou in Baytown, Texas, under the Synfluid brand. Esters grow fastest at 5.1% a year, as vessel operators prepare for the discharge standards described in the trends, which favor biodegradable esters. The Others group, led by Group III-based full synthetics, competes on price in 5-quart retail packs.
How do heat transfer fluids outgrow engine oils?
Based on product type, the market is categorized into engine oil, heat transfer fluids (HTF), transmission fluids, metalworking fluids and others. Engine Oil led with 52.0% of 2025 value, because carmakers now specify 0W-16 and 0W-20 grades and mass retailers stock 0W-16 full synthetic packs such as Mobil 1 Advanced Fuel Economy. Heat Transfer Fluids (HTF) grow fastest at 6.2% a year, as direct-to-chip and immersion cooling in data centers adds a new synthetic fluid category, described in the trends below.
Why is power generation the fastest-growing end user?
Based on end user, the market is categorized into power generation, automotive and other transportation, metallurgy and metalworking, chemical manufacturing and others. Automotive and Other Transportation led with 60.0% of 2025 value, because 289 million light vehicles and the Class 8 truck fleet consume most engine and driveline fluids. Power Generation grows fastest at 5.7% a year, as the U.S. Wind Turbine Database counted 77,839 turbines in September 2026, each needing synthetic gear oil and greases during wind turbine maintenance cycles.
| Segment Group | Leading Sub-segment | Share, 2025 | Fastest-growing Sub-segment | CAGR, 2026–2035 |
|---|---|---|---|---|
| By Type | PAO | 46.0% | Esters | 5.1% |
| By Product Type | Engine Oil | 52.0% | Heat Transfer Fluids (HTF) | 6.2% |
| By End User | Automotive and Other Transportation | 60.0% | Power Generation | 5.7% |
Retail packs show synthetic oil price premiums clearly
Pricing follows the base stock and the approval list printed on the bottle, so a PAO or ester gear oil sells well above a Group III-based engine oil even at equal volume. Retail engine oil packs set the visible benchmark, with a 5-quart Mobil 1 jug listed at USD 31.97 at Walmart in November 2026, or about USD 6.76 per liter before tax. Industrial and fleet buyers pay on contract, usually indexed to base oil and additive costs, so the producer price jump described under the challenges reaches them faster than motorists. The industrial and bulk ranges in the table are Credence Research estimates, because suppliers rarely publish contract prices.
| Offer or segment | Typical price or fee | Basis |
|---|---|---|
| Full synthetic engine oil, 5-quart retail jug | USD 31.97 per jug (about USD 6.76 per liter) | Walmart list price, November 2026 |
| Full synthetic oil change at a quick-lube chain | USD 80 to 130 per service | Credence Research estimate from posted service menus, 2026 |
| PAO industrial gear or compressor oil, 208-liter drum | USD 1,800 to 3,200 per drum | Credence Research estimate from distributor lists, 2026 |
| Synthetic heat transfer fluid, bulk delivery | USD 8 to 15 per liter | Credence Research estimate from distributor quotes, 2026 |
Request a Free Sample
Fill in your details and we'll send you a free sample report.
- Sample data tables & charts
- Research methodology
Fleet age, new specs and grid build-out lift demand
How does an older vehicle fleet keep oil service demand high?
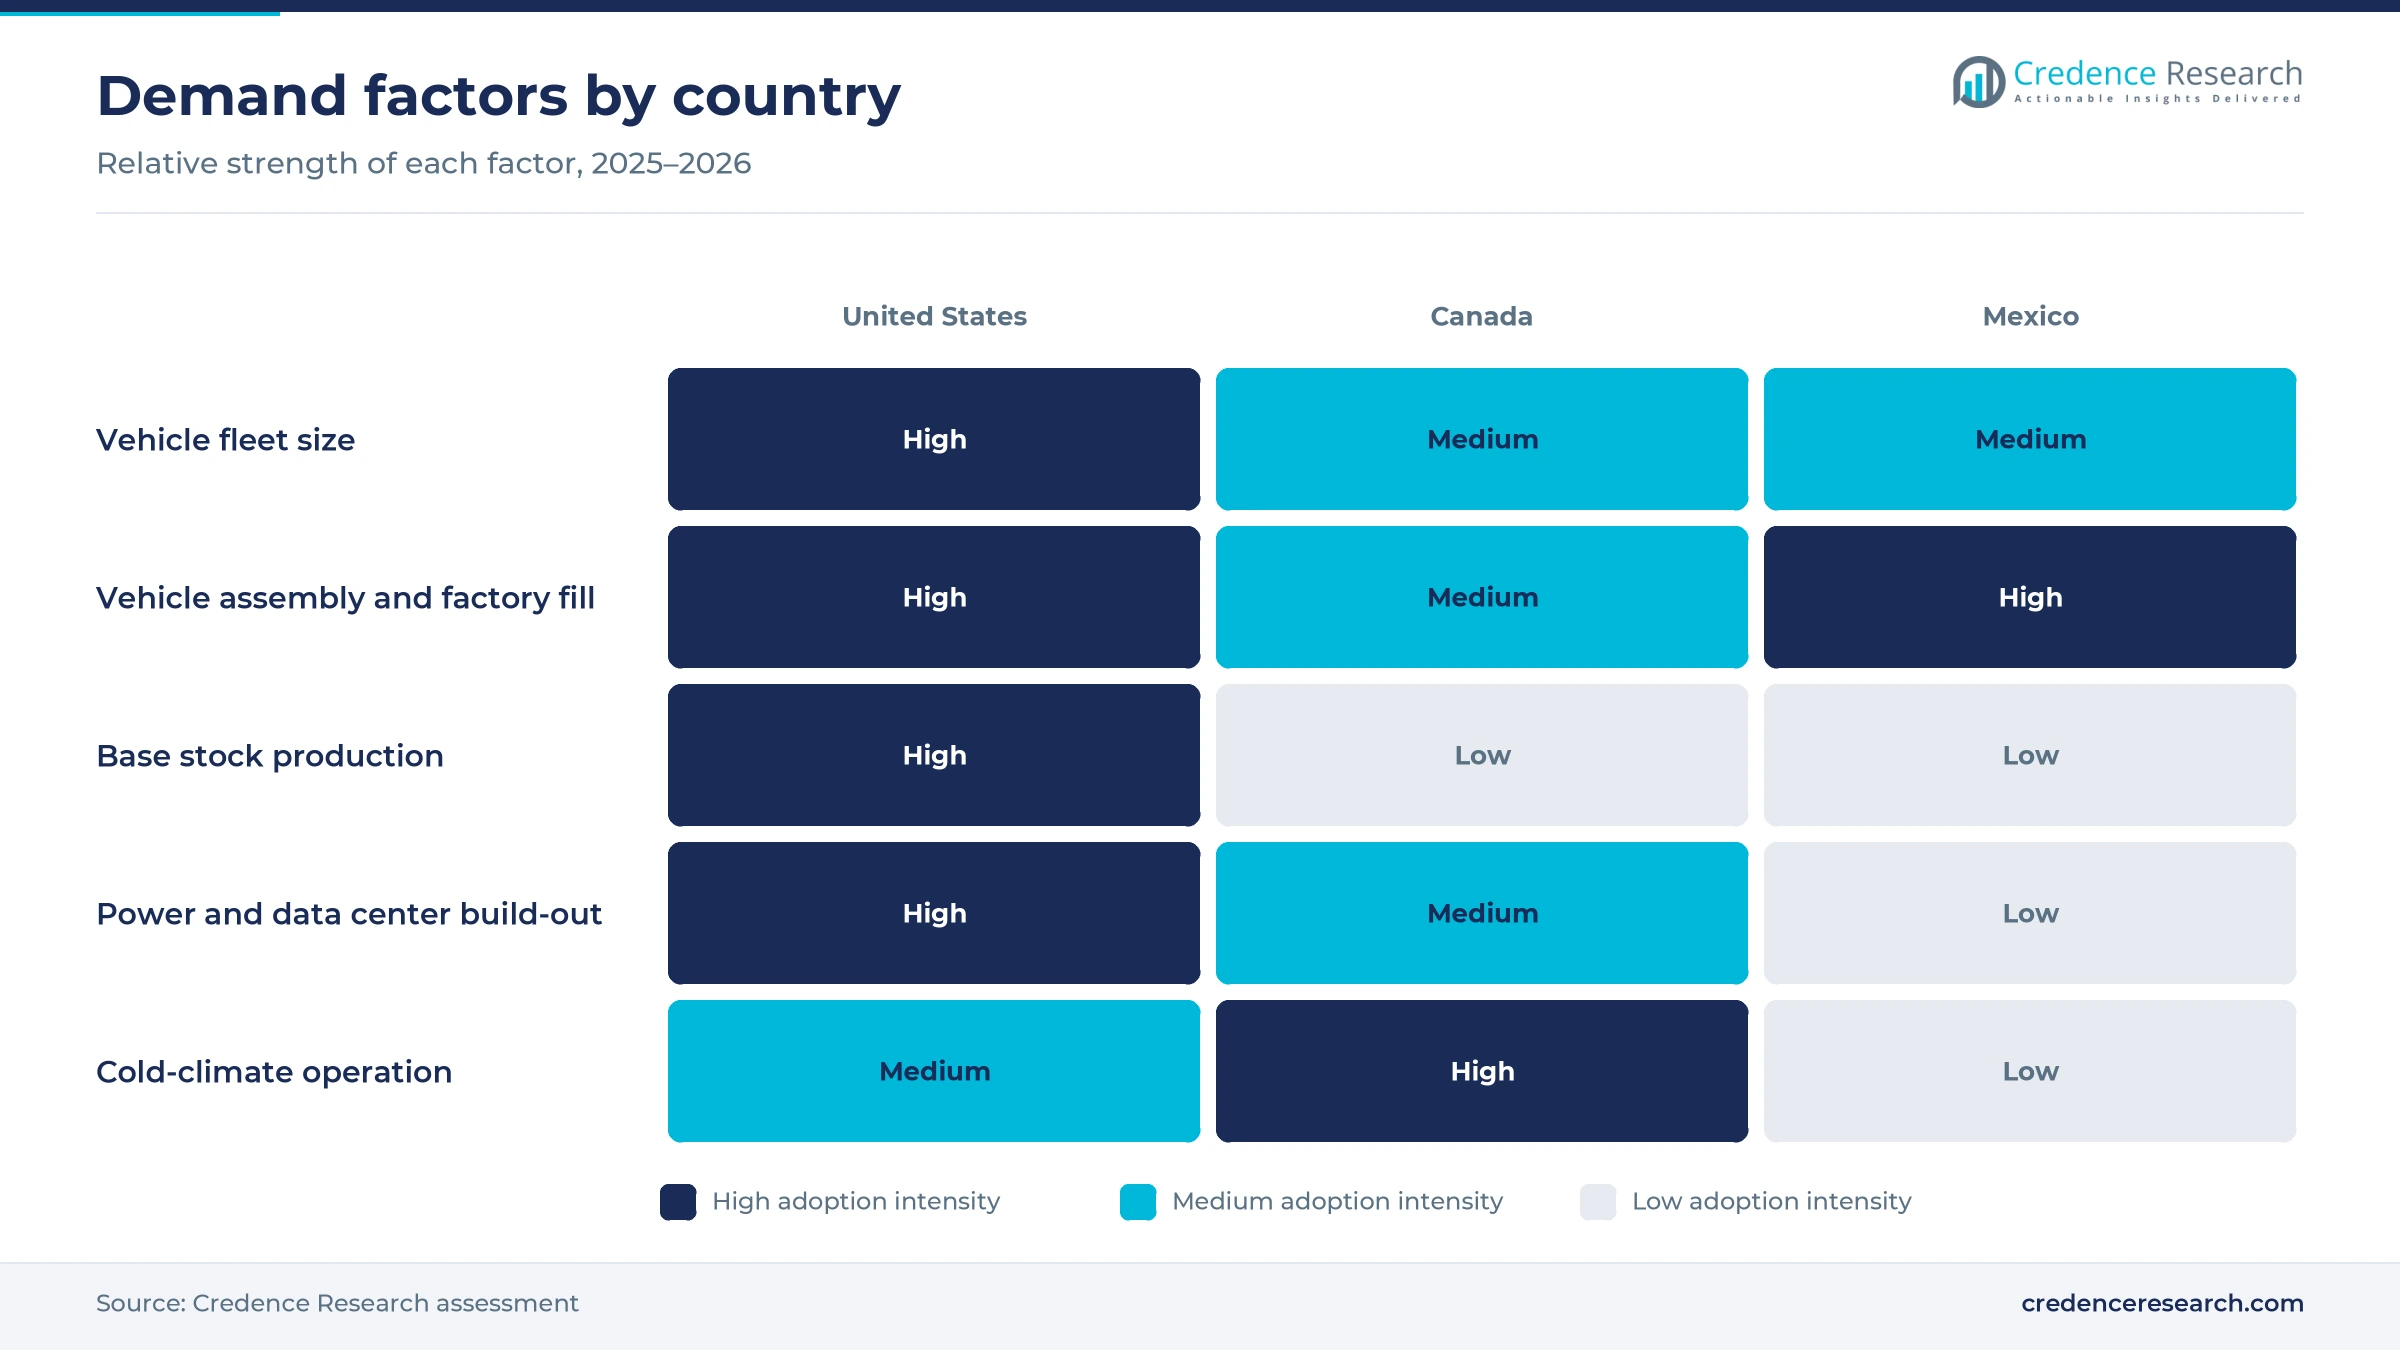
Cars kept for 13 years or more return for oil changes once or twice a year long after warranty ends, which sustains paid service demand. The average U.S. light vehicle reached 12.8 years in 2025, and the fleet in operation grew by 3 million to 289 million, according to S&P Global Mobility. The same release said vehicles from the heavy 2015 to 2019 registration years are now leaving warranty. Valvoline Inc. ran 2,180 service centers on Sept. 30, 2025, up 8.5% in a year. Each added service center widens the outlet base for packaged synthetic oil, and automotive and other transportation buyers hold 60.0% of 2025 value.
Why do lower-viscosity oil categories raise synthetic content?
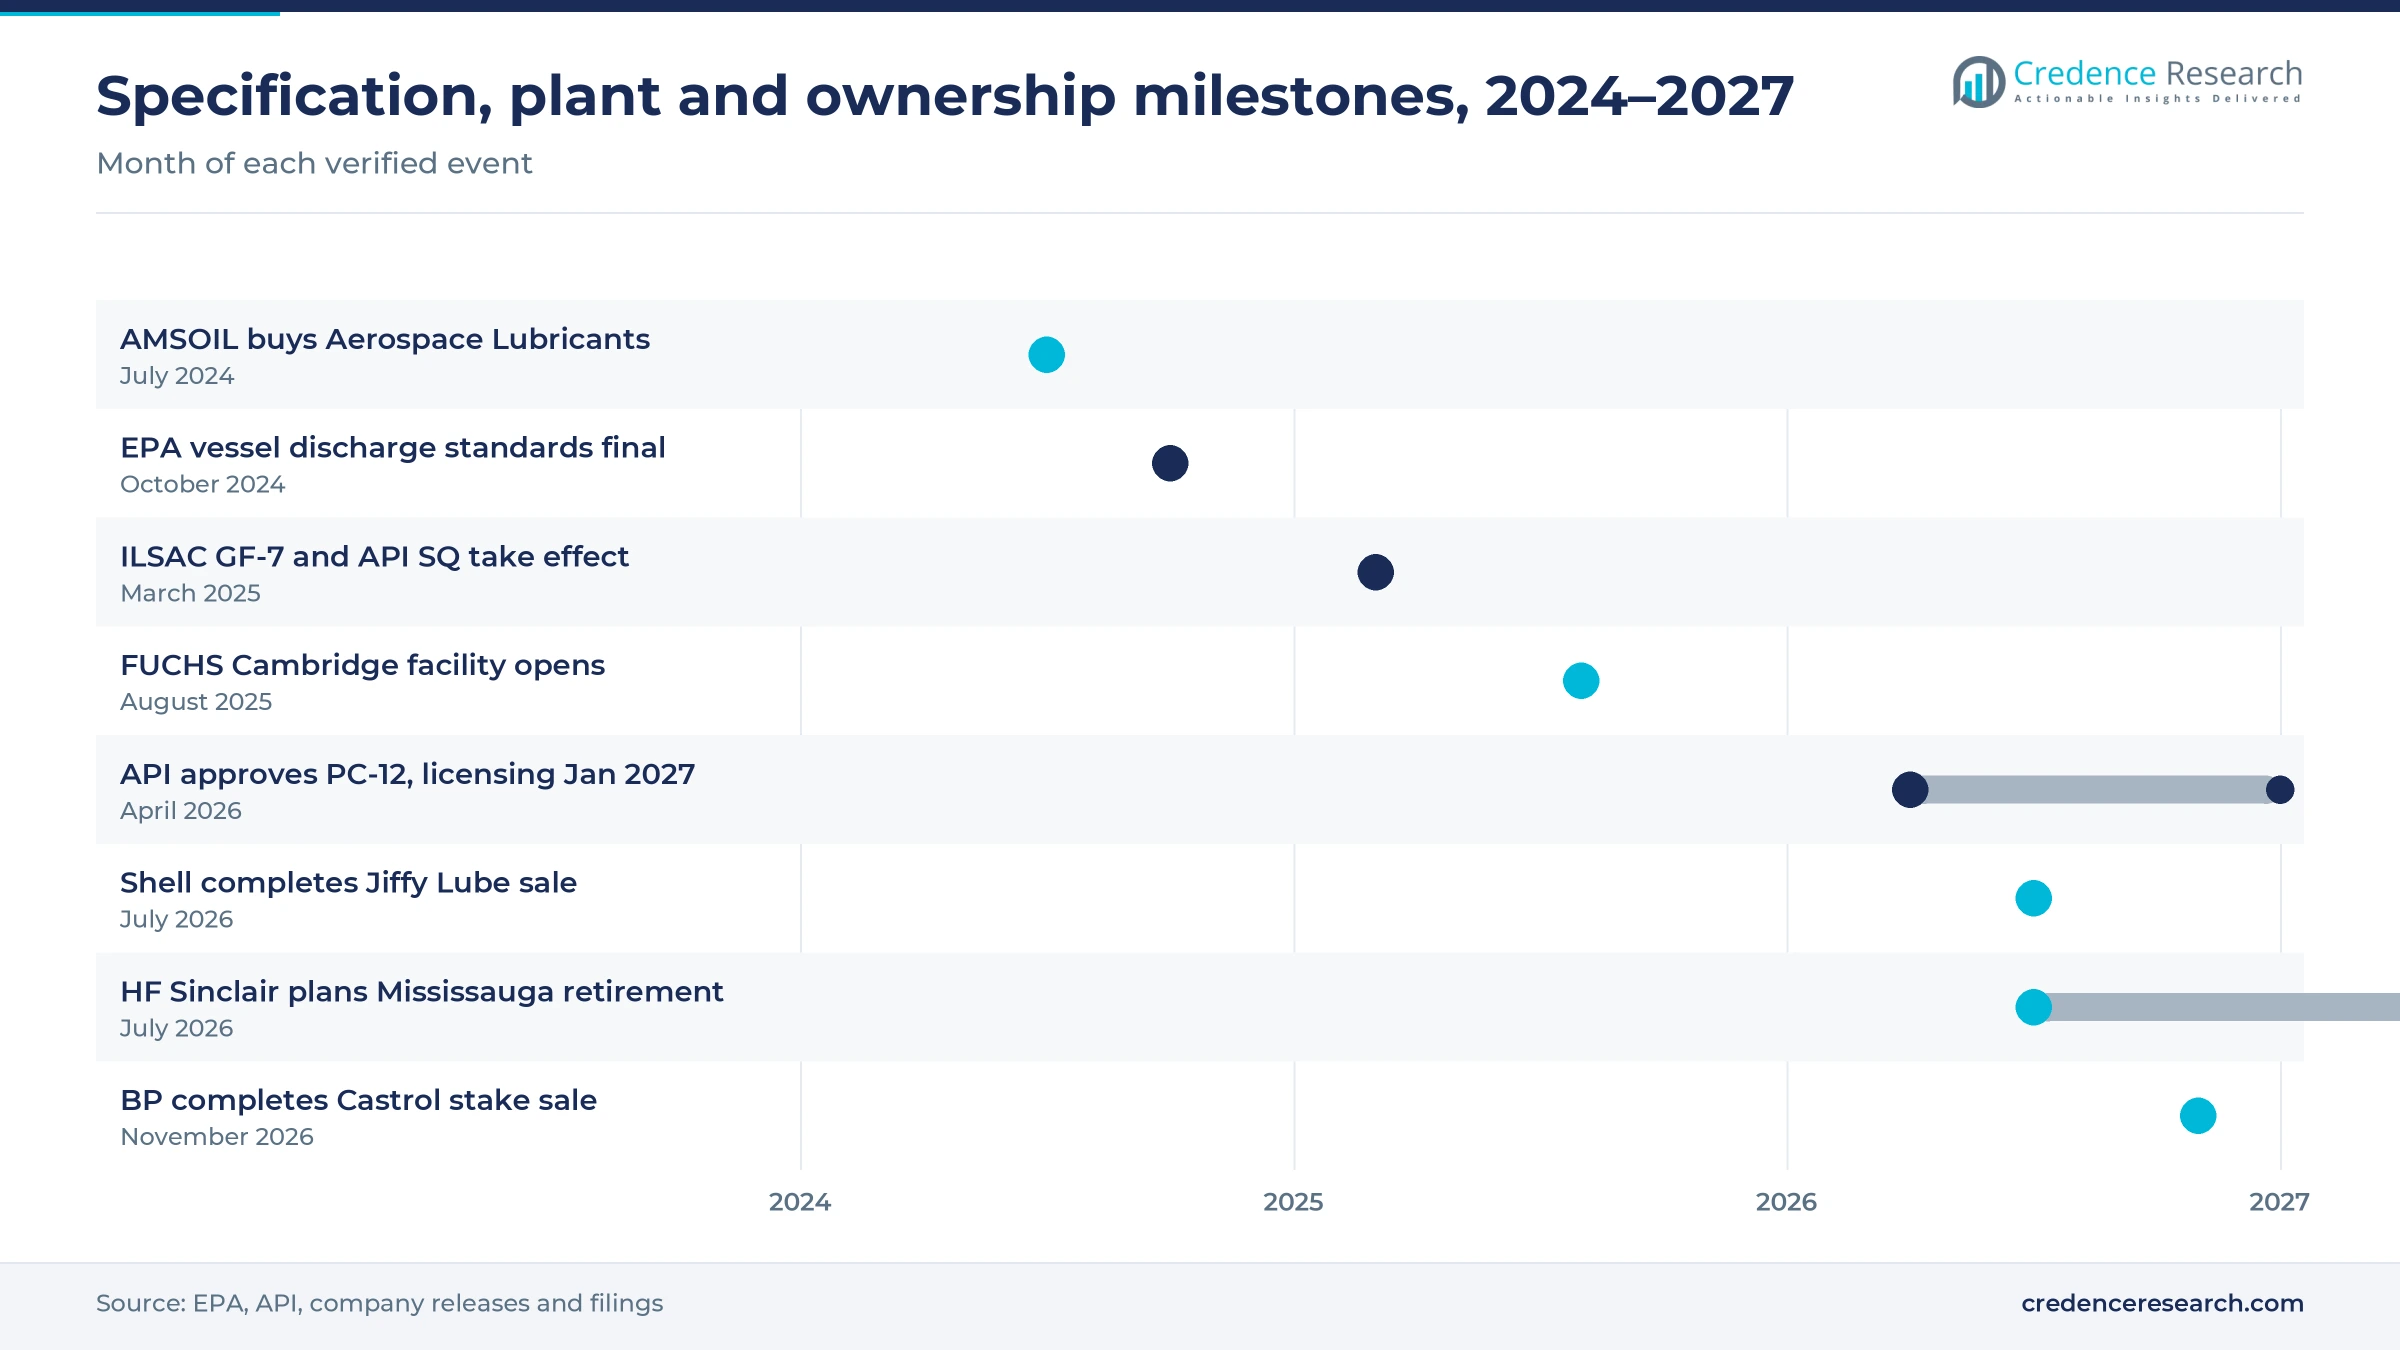
Thinner engine oil grades must still pass tougher wear, deposit and timing chain tests, and only high-viscosity-index synthetic base stocks deliver both at once. ILSAC GF-7 and API SQ took effect on March 31, 2025, and after March 31, 2026 the ILSAC Starburst defines only API SQ oils, according to Lubes'n'Greases. Valvoline Global Operations launched GF-7 formulas for the U.S. and Canada on April 1, 2025, citing a 500,000-mile single-engine test. API approved the PC-12 heavy-duty category in April 2026, with API CL-4 and FB-4 licensing from Jan. 1, 2027 and support for lower-viscosity grades. Each new category lifts the synthetic share of every engine oil liter sold in the region.
How does grid expansion raise demand from power plants?
Wind gearboxes, gas turbines, hydraulic pitch systems and transformer cooling all need long-life synthetic fluids, so new capacity adds fills. U.S. developers added 27.2 GW of solar and 15 GW of battery storage in 2025 and planned 11.8 GW of wind in 2026, more than double the prior year, according to the U.S. Energy Information Administration. The U.S. Wind Turbine Database lists a median turbine size of 2,000 kW, and larger gearboxes need PAO gear oils that last several years between changes. Gas plants built to serve new industrial and computing load add turbine oil fills. These fills make power generation the fastest-growing end user at 5.7% a year.
Why does Mexican vehicle assembly support factory-fill demand?
Every vehicle built in Mexico leaves the plant filled with engine oil, transmission fluid and greases specified by the carmaker. Mexico produced 3,953,494 light vehicles in 2025, down 0.9% from 2024, according to INEGI data. Exports of Mexican-built light vehicles reached 3,385,785 units in the same year. The output keeps blending, packaging and technical service close to assembly plants in Coahuila, Guanajuato, Puebla and Nuevo Leon. Export models leave the line on low-viscosity grades such as 0W-20 that depend on synthetic base stocks, so each vehicle carries more synthetic content even when unit output dips. With 78.4% of exports going to the United States, factory-fill demand in Mexico depends more on U.S. vehicle demand than on local car sales.
Slower EV uptake and brand sales reshape the supply side
How is slower EV adoption extending the engine oil cycle?
Each year of hybrid and gasoline sales adds cars that will need oil changes into the late 2030s, which lengthens the engine oil cycle. EVs took 7.8% of U.S. new vehicle sales in 2025, down from 8.1% in 2024, according to Cox Automotive. Fourth-quarter sales fell to 234,000 units after federal purchase incentives ended at the start of October 2025. In Canada, zero-emission vehicles fell to 9.5% of new registrations from 14.6% in 2024, according to Statistics Canada. With EVs still a small minority of new sales in both countries, engine oil demand keeps its base for longer, and e-fluid demand stays small relative to 2025 engine oil volumes. Blenders are shifting e-fluid launches later while expanding hybrid-ready 0W-16 and 0W-20 synthetic engine oils.
Why are brand owners separating lubricants from other assets?
Oil companies and refiners are splitting lubricant brands from fuel and retail assets, so that a standalone business can pursue its own capital and pricing plans. Shell completed the sale of Jiffy Lube to Monomoy Capital Partners on July 1, 2026, while keeping Pennzoil, Quaker State and Rotella and a long-term supply agreement with the chain. BP completed the sale of a 65% stake in Castrol to Stonepeak in November 2026, leaving Castrol as a standalone company. HF Sinclair said on July 28, 2026 that it plans to separate its lubricants and specialties segment within 12 to 18 months. Independent blenders gain room to win private-label and fleet contracts during these transitions.
Can data center cooling open a new fluid category?
Direct-to-chip and immersion systems need dielectric fluids with tight purity and thermal limits that synthetic base stocks meet, which creates a distinct fluid category. Data centers used 176 TWh, or 4.4% of U.S. electricity, in 2023, and could use 325 to 580 TWh by 2028, according to the U.S. Department of Energy. Shell launched Shell DLC Fluid S3 for direct liquid cooling in 2025 and said its immersion fluids were the first to be certified by Intel. Suppliers selling into data center cooling projects can earn specialty margins on bulk volumes. This new category is the main reason heat transfer fluids grow fastest at 6.2% a year.
Is the marine discharge rule an opening for ester fluids?
Vessels with oil-to-sea interfaces, such as stern tubes, thrusters and rudder bearings, must manage oil releases under national standards, which favors biodegradable ester fluids. EPA published the final Vessel Incidental Discharge National Standards of Performance on Oct. 9, 2024, effective Nov. 8, 2024. The rule defines environmentally acceptable lubricants, which are generally biodegradable, oxygen-containing chemistries. The Coast Guard has two years from EPA publication to issue the implementing rules that make the standards enforceable. Ester suppliers, which grow at 5.1% a year, can win tug, ferry and barge operators that prepare before enforcement, starting with fleets on the Gulf Coast and the Great Lakes.
Input costs, imports and refinery exits test blenders
How do rising producer prices squeeze blender margins?
Fixed-price fleet and distributor contracts lag cost changes, so price spikes reach blender margins first. The producer price index for petroleum lubricating oil and grease manufacturing rose from 628.4 in December 2025 to 770.2 in October 2026, according to U.S. Bureau of Labor Statistics data. Independent blenders with short supply contracts and thin inventories feel this squeeze first. Many respond with surcharges, shorter quote validity and indexation clauses in new industrial contracts.
Why does reliance on imported base stocks raise supply risk?
Much of the Group III supply used in synthetic engine oils arrives by sea from a few exporting countries, so a disruption at one source quickly raises costs for blenders. South Korea supplied 24% of U.S. base oil and lubricant imports in 2024, or 532,300 metric tons, and the Mideast Gulf supplied 46%, or about 1 million tons, according to Argus. Blenders on the East and West Coasts are most exposed, and term contracts with Gulf Coast producers are their main hedge against shortages.
How does a Canadian refinery exit tighten base oil supply?
Ontario blenders are set to lose a nearby source and must rely on imported or long-haul product. HF Sinclair plans to retire its 15,600 barrel-a-day Mississauga base oil refinery, largely by the end of 2027. The company signed supply deals for Group III base stock from SK Enmove and Group II from Chevron in August 2026. Smaller Canadian blenders without term contracts face higher freight costs and longer lead times.
Why does volatile volume make capacity planning harder?
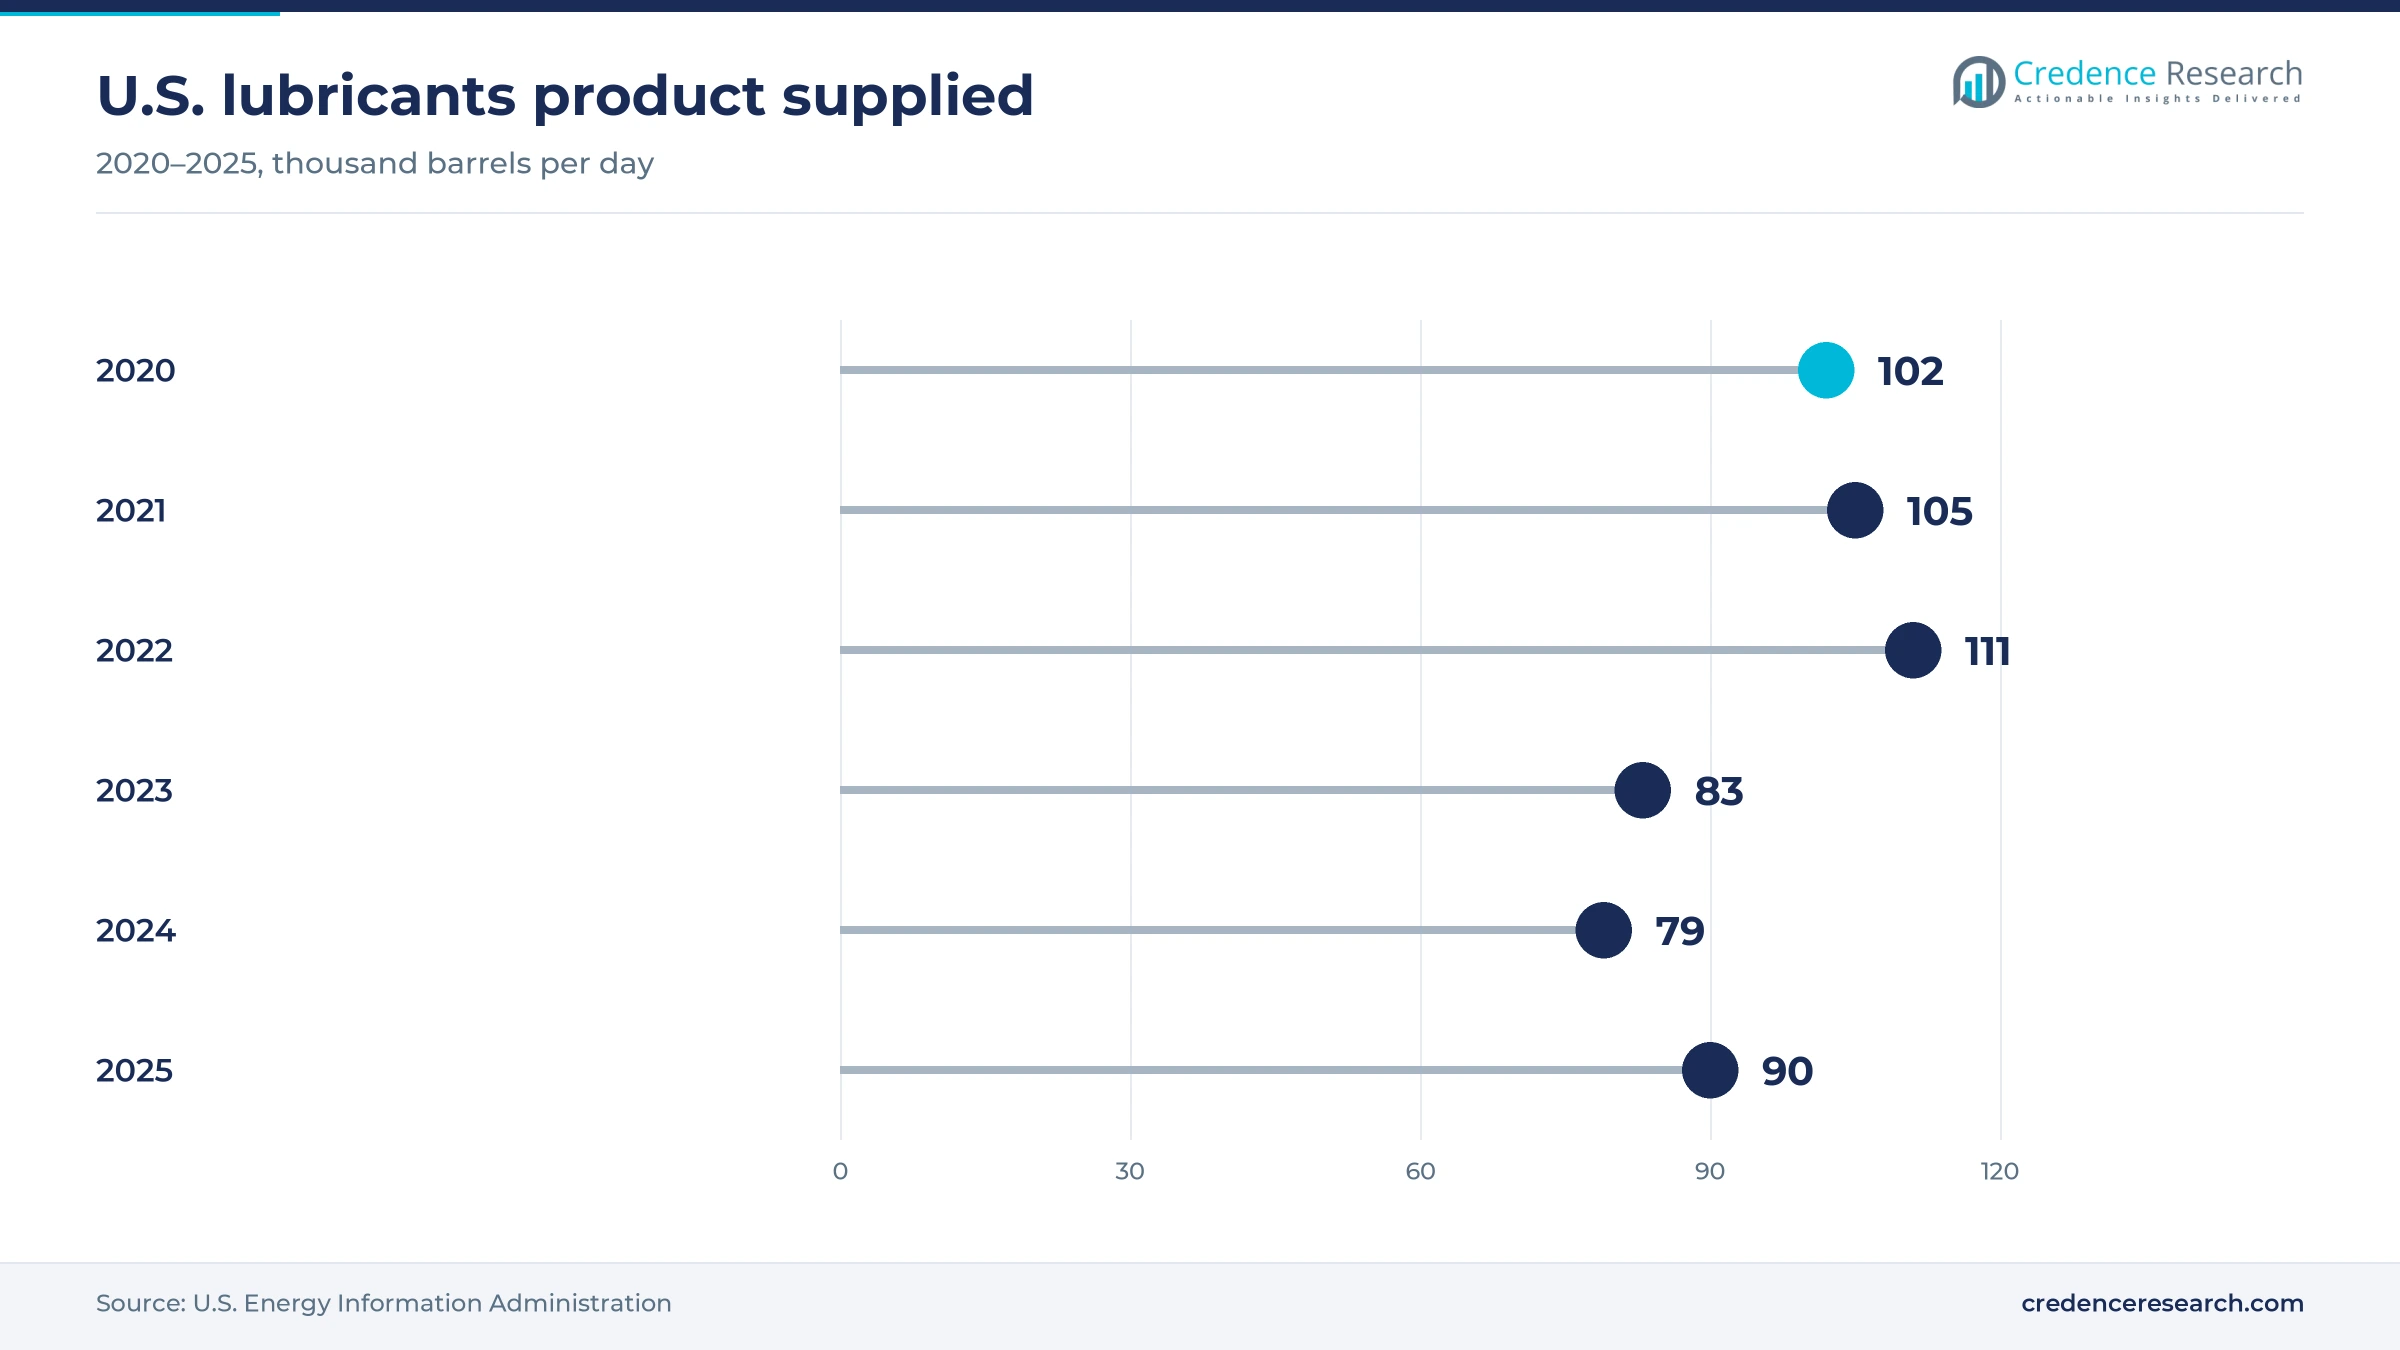
Blenders size filling lines and stocks on liters, while demand swings with freight and industrial output, which complicates capacity planning. U.S. lubricants product supplied fell from 111,000 barrels a day in 2022 to 79,000 in 2024, then rose to 90,000 in 2025, according to EIA data. Commodity-grade blenders without premium or specialty lines are most exposed. Many respond with toll blending, shared warehousing and flexible filling lines.
The United States leads while Mexico grows the fastest
| Country | Value, 2025 (USD billion) | Share, 2025 | CAGR, 2026–2035 |
|---|---|---|---|
| United States | 7.88 | 84.0% | 4.0% |
| Canada | 0.84 | 9.0% | 3.8% |
| Mexico | 0.66 | 7.0% | 5.0% |
Why does the United States hold most regional value?
The United States held 84.0% of 2025 value and grows at 4.0% a year, because it has the largest fleet, most quick-lube outlets and nearly all PAO and Group III base stock capacity in the region. ExxonMobil broke ground on a Baytown, Texas, project that will raise its Group III production to about 8,000 barrels a day, with startup planned for 2028, according to ExxonMobil. AMSOIL bought Ohio grease maker Aerospace Lubricants in July 2024 to control specialty grease supply. Domestic capacity gives U.S. blenders shorter lead times than importers on either coast. The added supply should ease demand for imported Group III cargoes after 2028.
How do Canadian fleets and logistics shape demand?
Canada held 9.0% of 2025 value and grows at 3.8% a year, because cold-weather operation favors low pour-point synthetic oils in cars, trucks, mining and forestry equipment. New motor vehicle registrations reached 1,866,714 in 2025, up 0.7%, according to Statistics Canada. FUCHS opened a facility of more than 50,000 square feet in Cambridge, Ontario, in August 2025 to shorten lead times across Eastern Canada. The Mississauga refinery retirement discussed above makes supply contracts more important for Canadian buyers. Because cold-weather grades carry a high synthetic share, Canada's smaller fleet yields more synthetic value than Mexico's, as the country table shows.
Why is Mexico the fastest-growing country?
Mexico held 7.0% of 2025 value and grows fastest at 5.0% a year, because export assembly plants, parts suppliers and machine shops buy factory-fill fluids and synthetic industrial oils under carmaker specifications. Canada took 376,251 Mexican-built light vehicles in 2025, or 11.1% of exports, according to INEGI. Factory fill at the assembly plants noted above is the main channel for synthetic demand in Mexico. Aftermarket demand is smaller, since many older cars still use mineral oils, and public data on synthetic oil use in Mexico remains thin. Growth therefore depends on assembly volumes and on regional trade terms.
Specification, plant and ownership moves since 2024
| Development | Status and market relevance |
|---|---|
| In March 2025, ILSAC GF-7 and API SQ engine oil standards took effect, and licensed oils could carry the new marks. | Standard in force; it moves car oils toward thinner full synthetic grades |
| In August 2025, FUCHS opened its new Cambridge, Ontario, facility to serve customers across Eastern Canada. | Completed and operating; it shortens delivery times for Canadian buyers |
| In April 2026, API formally approved the PC-12 heavy-duty engine oil categories, with licensing from January 2027. | Approval granted; heavy-duty oils move to new formulations in 2027 |
| In July 2026, Shell completed the sale of Jiffy Lube to Monomoy Capital Partners while keeping a supply agreement. | Completed; Pennzoil keeps the chain as a supply customer |
| In November 2026, BP completed the sale of a 65% stake in Castrol to Stonepeak, keeping 35%. | Completed; Castrol now operates as a standalone company |
Four base stock families set performance and price
- Polyalphaolefins give engine, gear and compressor oils stable viscosity from arctic cold to high load, which suits wind gearboxes and fleets.
- Synthetic esters dissolve additives well and biodegrade quickly, which suits jet engine oils, refrigeration compressors and marine stern tubes.
- Polyalkylene glycols resist sludge and fire in hydraulic, gear and compressor service, which suits chemical plants and food processing lines.
- Group III and gas-to-liquids base stocks reach high viscosity index at lower cost than PAO, which lets blenders sell full synthetic engine oils at mass-market prices.
Need a Custom Version of This Report?
Tailor the scope, geography, or segments to your exact requirements.
- Custom geography or segment scope
- Direct access to our analyst team
Oil majors and specialists compete on approvals and reach
Competition is led by integrated majors with base stock capacity, OEM approvals and national distribution, alongside specialists that win on niche performance. ExxonMobil sells Mobil 1 and industrial Mobil SHC lines and makes base stocks on the Gulf Coast. Shell sells Pennzoil, Quaker State and Rotella, while Chevron sells Havoline and Delo. Valvoline Global Operations, owned by Aramco, supplies retail and installer channels, and Castrol now competes as a standalone company owned mostly by Stonepeak. AMSOIL sells through dealers and online, and FUCHS focuses on industrial customers and buyers of metalworking fluids. TotalEnergies, Phillips 66 with Kendall, and Petro-Canada Lubricants serve fleets, industry and Canadian buyers. Rivals compete on OEM approvals, technical service, distributor reach and the ability to secure base stocks during supply disruptions.
Where do margins sit along the synthetic supply chain?
The synthetic supply side is concentrated upstream and fragmented downstream across the region. A few chemical makers produce PAO, and a handful of additive companies supply most performance packages, so these firms hold pricing power. Finished lubricant brands buy those inputs and earn their margin on approvals, packaging and channel access, while hundreds of regional blenders compete for fleet and industrial contracts on service and delivery. Entry barriers sit in OEM approval testing, which costs years of engine sequence work, and in access to base stock supply. Margins are highest in specialty industrial fluids and lowest in bulk fleet engine oil. Specialty fluids hold a smaller share of 2025 volume but a large part of the regional margin pool.
Which suppliers shape regional synthetic fluid supply?
| Company | Type | Role in the market |
|---|---|---|
| ExxonMobil Corporation | Integrated major | Sells Mobil 1 and Mobil SHC synthetics and makes Gulf Coast base stocks |
| Shell plc (Pennzoil-Quaker State) | Integrated major | Sells Pennzoil, Quaker State and Rotella synthetic oils in the U.S. and Canada |
| Chevron Corporation | Integrated major | Sells Havoline and Delo synthetic engine oils and industrial lubricants |
| Valvoline Global Operations (Aramco) | Branded marketer | Sells Valvoline synthetic motor oils to retail, installers and fleets |
| AMSOIL Inc. | Synthetic specialist | Wisconsin maker of synthetic oils and greases sold through dealers and online |
| Castrol (Stonepeak) | Branded marketer | Sells Castrol Edge and industrial synthetics, now a standalone company |
| TotalEnergies | Integrated major | Sells Quartz and industrial synthetic lubricants to fleets and plants |
| FUCHS SE | Independent specialist | Supplies industrial, metalworking and automotive synthetics from U.S. and Canadian sites |
| Phillips 66 | Refiner and marketer | Sells Kendall and Phillips 66 synthetic engine and industrial oils |
| Petro-Canada Lubricants (HF Sinclair) | Refiner and marketer | Ontario blender of synthetic engine, hydraulic and food-grade lubricants |
Value per liter, not volume, carries the next decade
Credence Research's view is that the region will grow mainly through value per liter rather than volume, as new car and heavy-duty oil categories move buyers to fully synthetic grades. Engine oil remains the largest pool, while heat transfer fluids, esters and power generation add the fastest growth. The main risk is cost, since the producer price rise in 2026, import reliance and a Canadian refinery exit all land on blenders at once. Suppliers with their own base stocks, broad OEM approvals and specialty industrial lines should gain share, while commodity blenders lose margin.
Converting the 2024 estimate to a 2025 base year
The report uses 2025 as the base year on a calendar basis, and market values come from the Credence Research model. The 2025 value was converted from the earlier 2024 estimate at its own growth rate and then checked against public data on lubricant consumption, vehicle fleets and vehicle output. Country shares, segment splits and growth rates are Credence Research estimates. Sources used are official statistics, regulator documents, company releases and trade media, and no interviews or surveys were used.
Premium engine oils and power fluids carry growth
The North America synthetic lubricants market is expected to reach USD 13.93 billion by 2035, a 4.04% CAGR during 2026–2035, as an older fleet, new oil categories and power sector demand support value. Growth should be strongest in heat transfer fluids, esters, power generation and Mexico, because these areas gain most from data centers, marine rules and export assembly. Engine oil will stay the largest product type, though EV adoption caps its volume over time, and supply contracts will matter more as base stock sources shift.
Base stock costs and fleet mix decide the range of outcomes
The outcome depends mainly on how quickly cost increases pass through to buyers and how long the gasoline and hybrid fleet keeps growing. If producer prices settle and buyers keep moving to approved full synthetic grades, value grows above the base case. If import disruptions and base stock shortages squeeze supply while EV adoption recovers faster than expected, volume and pricing both weaken, and growth falls below the base case.
| Scenario | CAGR, 2026–2035 | Value, 2035 | What has to hold |
|---|---|---|---|
| Downside | 2.7% | USD 12.44 billion | EV share recovers quickly while import disruptions and refinery closures keep input costs high |
| Base | 4.04% | USD 13.93 billion | Fleet age stays near 13 years and PC-12 oils launch on schedule in 2027 |
| Upside | 5.1% | USD 15.32 billion | Data center and power fluids scale faster and premium engine oil mix keeps rising |
Frequently Asked Questions
How big is the North America synthetic lubricants market?
How large is the U.S. synthetic lubricant market within the region?
Which base stock type leads the market?
How old is the U.S. vehicle fleet?
How do electric vehicles affect synthetic oil demand?
Which product type grows fastest?
Who are the leading companies in the market?
What are the main challenges for synthetic lubricant suppliers?
Table of Content
Chapter 1 Market Segmentation
- 1.1 Segmentation Framework
- 1.1.1 Product and Service Classification
- 1.1.2 Application and End-Use Classification
- 1.1.3 Technology and Solution Classification
- 1.1.4 Customer and Distribution Channel Classification
- 1.1.5 Geographic Segmentation
- 1.1.6 Market Segment Definitions and Boundaries
- 1.2 By Type
- 1.2.1 PAO
- 1.2.2 Esters
- 1.2.3 PAG
- 1.2.4 Others
- 1.3 By Product Type
- 1.3.1 Engine Oil
- 1.3.2 Heat Transfer Fluids (HTF)
- 1.3.3 Transmission Fluids
- 1.3.4 Metalworking Fluids
- 1.3.5 Others
- 1.4 By End User
- 1.4.1 Power Generation
- 1.4.2 Automotive and Other Transportation
- 1.4.3 Metallurgy and Metalworking
- 1.4.4 Chemical Manufacturing
- 1.4.5 Others
- 1.5 By Country
- 1.5.1 United States
- 1.5.2 Canada
- 1.5.3 Mexico
Chapter 2 Introduction
- 2.1 Report Objectives and Scope
- 2.2 Product Definition and Industry Terminology
- 2.3 Market Inclusions and Exclusions
- 2.4 Research Process
- 2.4.1 Primary Research and Expert Interviews
- 2.4.2 Secondary Research and Source Review
- 2.4.3 Top-Down and Bottom-Up Estimation
- 2.4.4 Data Triangulation and Verification
- 2.5 Market Size Measurement Basis
- 2.5.1 2025: USD 9.38 billion → 2035: USD 13.93 billion
- 2.6 Historical and Forecast Reference Periods
- 2.6.1 Historical Period: 2018-2025
- 2.6.2 Base Year: 2025
- 2.6.3 Forecast Period: 2025-2035
- 2.7 Research Assumptions and Limitations
Chapter 3 Executive Summary
- 3.1 Market Snapshot and Key Findings
- 3.2 Base-Year Market Size, 2025
- 3.3 Forecast Market Size, 2035
- 3.4 Revenue and Volume Growth Outlook
- 3.5 Key Demand and Supply Indicators
- 3.6 Leading Market Segments
- 3.7 Fastest-Growing Market Opportunities
- 3.8 Regional Performance Highlights
- 3.9 Technology and Industry Transformation
- 3.10 Competitive Landscape Summary
- 3.11 Analyst View and Strategic Implications
Chapter 4 North America Synthetic Lubricants Market Trends and Developments
- 4.1 Historical Industry Development, 2018-2025
- 4.2 Recent Market Trends and Developments
- 4.3 Demand and Customer Behavior Trends
- 4.4 Technology and Product Innovation
- 4.5 Artificial Intelligence, Automation and Digitalization
- 4.6 Local Manufacturing and Supply Chain Realignment
- 4.7 Industry Partnerships, Mergers and Acquisitions
- 4.8 Sustainability and Circular Economy Developments
- 4.9 Government and Private Sector Investment Trends
- 4.10 Emerging Business Models and Commercialization
- 4.11 Industry Developments and Announcements
Chapter 5 North America Synthetic Lubricants Market Production, Supply and Demand Analysis
- 5.1 Demand Trend and Consumption Analysis, 2018-2025
- 5.2 Demand Forecast, 2025-2035
- 5.3 Production and Output Trend, 2018-2025
- 5.4 Production and Output Forecast, 2025-2035
- 5.5 Installed Capacity and Capacity Utilization
- 5.6 Company-Wise Production Plants and Statistics
- 5.6.1 Installed Production Capacity
- 5.6.2 Actual Production
- 5.6.3 Planned Capacity and Expansion Targets
- 5.7 Supply Chain Structure and Procurement Trends
- 5.8 Supply-Demand Gap and Bottlenecks
- 5.9 Import Dependence and Sourcing Structure
- 5.10 Contract Manufacturing and Outsourcing
- 5.11 Regional Supply and Demand Concentration
Chapter 6 North America Synthetic Lubricants Market Pricing Analysis
- 6.1 Pricing Structure and Measurement
- 6.2 Historical Pricing Trends, 2018-2025
- 6.3 Pricing Outlook, 2025-2035
- 6.4 Average Selling Price and Unit Economics
- 6.5 Pricing by Product and Market Segment
- 6.6 Geographic Pricing Differences
- 6.7 Key Input, Energy, Labor and Logistics Costs
- 6.8 Contract Pricing and Purchasing Models
- 6.9 Pricing Sensitivity and Competitive Positioning
- 6.10 Price, Margin and Profitability Implications
Chapter 7 North America Synthetic Lubricants Market Dynamics
- 7.1 Market Growth Drivers
- 7.1.1 Demand-Side Drivers
- 7.1.2 Technology and Innovation Drivers
- 7.1.3 Infrastructure and Investment Drivers
- 7.1.4 Regulatory and Policy Drivers
- 7.2 Market Restraints
- 7.2.1 Cost and Affordability Constraints
- 7.2.2 Technology and Adoption Barriers
- 7.2.3 Supply Chain and Operational Constraints
- 7.3 Market Challenges
- 7.3.1 Competitive Pressure and Margin Erosion
- 7.3.2 Skills, Infrastructure and Implementation Gaps
- 7.4 Emerging Market Opportunities
- 7.5 Market Dynamics Impact and Time-Horizon Assessment
Chapter 8 North America Synthetic Lubricants Value Chain Analysis
- 8.1 Industry Value Chain Overview
- 8.2 Upstream Suppliers and Critical Inputs
- 8.3 Technology and Component Providers
- 8.4 Manufacturing or Service Delivery
- 8.5 Distribution, Channel Partners and Integrators
- 8.6 Downstream Applications and End Users
- 8.7 Value Addition and Profit Pools
- 8.8 Vertical Integration and Outsourcing
- 8.9 Supplier Concentration and Risk
- 8.10 Supply Chain Localization and Resilience
Chapter 9 North America Synthetic Lubricants Market Regulations and Policies
- 9.1 Relevant Laws, Standards and Compliance Frameworks
- 9.2 Product, Service, Safety and Quality Requirements
- 9.3 Government Policies, Incentives and Subsidies
- 9.4 Imports, Exports and Trade Barriers
- 9.5 Public Procurement and Local Content Requirements
- 9.6 Environmental and Sustainability Compliance
- 9.7 Upcoming Policy Changes and Market Implications
Chapter 10 North America Synthetic Lubricants Market Hotspots and Opportunities
- 10.1 Market Opportunity Mapping and Growth Hotspots
- 10.2 High-Growth Applications and Customer Groups
- 10.3 Underserved Markets and White-Space Opportunities
- 10.4 Emerging Technology and Product Opportunities
- 10.5 New Capacity and Investment Hotspots
- 10.6 Market Entry and Expansion Opportunities
- 10.7 Distribution and Partnership Opportunities
- 10.8 Near-Term and Long-Term Commercial Potential
- 10.9 Opportunity Attractiveness and Execution Risks
Chapter 11 North America Synthetic Lubricants Market Outlook, 2025-2035
- 11.1 Market Size and Analysis
- 11.1.1 Revenue (Market Measurement: 2025: USD 9.38 billion → 2035: USD 13.93 billion)
- 11.1.2 Market Volume and Quantity Sold
- 11.1.3 Historical Market Size, 2018-2025
- 11.1.4 Base-Year Market Size, 2025
- 11.2 Market Forecast, 2025-2035
- 11.2.1 Revenue Forecast to 2035
- 11.2.2 Volume Forecast to 2035
- 11.2.3 CAGR and Year-on-Year Growth
- 11.2.4 Incremental Revenue Opportunity
- 11.3 Forecast Assumptions and Scenario Analysis
- 11.3.1 Base-Case Forecast
- 11.3.2 Optimistic and Conservative Scenarios
- 11.3.3 Technology, Pricing and Policy Sensitivities
- 11.4 Market Attractiveness and Growth Outlook
Chapter 12 North America Synthetic Lubricants Market Segmentation and Outlook
- 12.1 Segmentation Summary and Market Shares, 2025
- 12.2 Largest and Fastest-Growing Segments
- 12.3 By Type - Market Size and Forecast, 2025-2035
- 12.3.1 Segment Definition and Scope
- 12.3.2 Historical Market Size, 2018-2025
- 12.3.3 Revenue Forecast, 2025-2035
- 12.3.4 Volume Forecast, 2025-2035
- 12.3.5 Base-Year Market Share, 2025
- 12.3.6 Segment CAGR and Growth Drivers
- 12.3.7 Subsegment Market Size and Forecast
- 12.3.7.1 PAO
- 12.3.7.2 Esters
- 12.3.7.3 PAG
- 12.3.7.4 Others
- 12.3.8 Subsegment Pricing and Adoption Trends
- 12.3.9 Leading Suppliers and Competition
- 12.3.10 Regional Demand and Opportunities
- 12.4 By Product Type - Market Size and Forecast, 2025-2035
- 12.4.1 Segment Definition and Scope
- 12.4.2 Historical Market Size, 2018-2025
- 12.4.3 Revenue Forecast, 2025-2035
- 12.4.4 Volume Forecast, 2025-2035
- 12.4.5 Base-Year Market Share, 2025
- 12.4.6 Segment CAGR and Growth Drivers
- 12.4.7 Subsegment Market Size and Forecast
- 12.4.7.1 Engine Oil
- 12.4.7.2 Heat Transfer Fluids (HTF)
- 12.4.7.3 Transmission Fluids
- 12.4.7.4 Metalworking Fluids
- 12.4.7.5 Others
- 12.4.8 Subsegment Pricing and Adoption Trends
- 12.4.9 Leading Suppliers and Competition
- 12.4.10 Regional Demand and Opportunities
- 12.5 By End User - Market Size and Forecast, 2025-2035
- 12.5.1 Segment Definition and Scope
- 12.5.2 Historical Market Size, 2018-2025
- 12.5.3 Revenue Forecast, 2025-2035
- 12.5.4 Volume Forecast, 2025-2035
- 12.5.5 Base-Year Market Share, 2025
- 12.5.6 Segment CAGR and Growth Drivers
- 12.5.7 Subsegment Market Size and Forecast
- 12.5.7.1 Power Generation
- 12.5.7.2 Automotive and Other Transportation
- 12.5.7.3 Metallurgy and Metalworking
- 12.5.7.4 Chemical Manufacturing
- 12.5.7.5 Others
- 12.5.8 Subsegment Pricing and Adoption Trends
- 12.5.9 Leading Suppliers and Competition
- 12.5.10 Regional Demand and Opportunities
- 12.6 By Country - Market Size and Forecast, 2025-2035
- 12.6.1 Segment Definition and Scope
- 12.6.2 Historical Market Size, 2018-2025
- 12.6.3 Revenue Forecast, 2025-2035
- 12.6.4 Volume Forecast, 2025-2035
- 12.6.5 Base-Year Market Share, 2025
- 12.6.6 Segment CAGR and Growth Drivers
- 12.6.7 Subsegment Market Size and Forecast
- 12.6.7.1 United States
- 12.6.7.2 Canada
- 12.6.7.3 Mexico
- 12.6.8 Subsegment Pricing and Adoption Trends
- 12.6.9 Leading Suppliers and Competition
- 12.6.10 Regional Demand and Opportunities
- 12.7 Segment Growth Comparison
- 12.8 Segment Attractiveness and Priority Matrix
Chapter 13 North America Synthetic Lubricants End-Use and Application Market Outlook
- 13.1 End-Use Industry and Customer Demand Structure
- 13.2 Leading Applications and Customer Groups
- 13.3 End-Use Market Size, Share and Forecast
- 13.4 Major End-Use Industry Deep Dives
- 13.4.1 Customer Requirements and Use Cases
- 13.4.2 Demand and Replacement Cycles
- 13.4.3 Technical and Regulatory Considerations
- 13.4.4 Purchasing and Procurement Models
- 13.4.5 Leading Vendors and Distribution Channels
- 13.4.6 Forecast and Commercial Opportunities
- 13.5 Emerging Applications and Cross-Segment Demand
- 13.6 End-Use Industry Investment Priorities
Chapter 14 North America Synthetic Lubricants Geographic Market Outlook, 2025-2035
- 14.1 Regional Market Size and Country-Level Shares, 2025
- 14.2 Country Market Size Comparison, 2025
- 14.3 Country Market Forecasts, 2025-2035
- 14.4 Subregional Industrial and Demand Clusters
- 14.5 Intra-Regional Pricing and Cost Differences
- 14.6 Cross-Border Trade and Supply Networks
- 14.7 Regional Supply and Demand Balances
- 14.8 Country Opportunity Comparison and Prioritization
Note: Every listed country is covered on the structure shown under the first country.
Chapter 15 North America Synthetic Lubricants Technology, Innovation and Sustainability Outlook
- 15.1 Technology Landscape and Maturity
- 15.2 Product, Process and Service Innovation
- 15.3 AI, Automation and Digital Tools in the Industry
- 15.4 Technology Adoption and Performance Benchmarking
- 15.5 Innovation Pipeline and R&D Investment
- 15.6 Patent and Intellectual Property Trends
- 15.7 Energy Efficiency and Resource Management
- 15.8 Sustainability, Recycling and Circularity
- 15.9 Technology Roadmap, 2025-2035
- 15.10 Risks of Obsolescence and Technology Substitution
Chapter 16 North America Synthetic Lubricants Market Key Strategic Imperatives
- 16.1 Growth and Market Entry Priorities
- 16.2 High-Return Products and Segments
- 16.3 Pricing, Profitability and Cost Optimization
- 16.4 Technology Investment and Product Differentiation
- 16.5 Supply Chain Localization and Resilience
- 16.6 Distribution and Customer Acquisition
- 16.7 Partnership, Acquisition and Capacity Strategy
- 16.8 Regional Expansion Priorities
- 16.9 Short-, Medium- and Long-Term Actions
Chapter 17 Competition Outlook
- 17.1 Industry Competition Characteristics
- 17.2 Market Structure and Concentration
- 17.3 Market Share and Competitive Positioning, 2025
- 17.4 Company-Wise Revenue and Product Benchmarking
- 17.5 Production and Service Capacity Benchmarking
- 17.6 Technology, Pricing and Differentiation
- 17.7 Regional Footprint and Distribution Strength
- 17.8 Mergers, Acquisitions and Strategic Alliances
- 17.9 New Entrants and Competitive Threats
- 17.10 Porter's Five Forces and Industry Attractiveness
- 17.11 Competitive Outlook, 2025-2035
Chapter 18 Company Profiles
- 18.1 Company Coverage and Selection Criteria
- 18.2 ExxonMobil Corporation
- 18.2.1 Business Description
- 18.2.2 Company Ownership and Geographic Presence
- 18.2.3 Product and Service Portfolio
- 18.2.4 Manufacturing and Operating Footprint
- 18.2.5 Production Capacity and Expansion Plans
- 18.2.6 Financial Performance and Investment
- 18.2.7 Market Share and Competitive Position
- 18.2.8 Technology and Innovation Capabilities
- 18.2.9 Strategic Alliances or Partnerships
- 18.2.10 Recent Developments
- 18.2.11 Growth Strategy and Outlook
- 18.3 Shell plc (Pennzoil-Quaker State)
- 18.4 Chevron Corporation
- 18.5 Valvoline Global Operations (Aramco)
- 18.6 AMSOIL Inc.
- 18.7 Castrol (Stonepeak)
- 18.8 TotalEnergies
- 18.9 FUCHS SE
- 18.10 Phillips 66
- 18.11 Petro-Canada Lubricants (HF Sinclair)
- 18.12 Other Relevant Market Participants
Note: Every listed company is profiled on the structure shown under the first company. The company list is preliminary and may change based on research findings, market developments, data availability and client requirements.
Chapter 19 Disclaimer
- 19.1 Research and Forecast Disclaimer
- 19.2 Data Source and Estimation Limitations
Note: The depth of individual sections depends on data availability for this market. Volume, capacity, trade and other unit-based metrics are included where applicable.

