
Domestic non-GMO soy anchors a value-added oil market
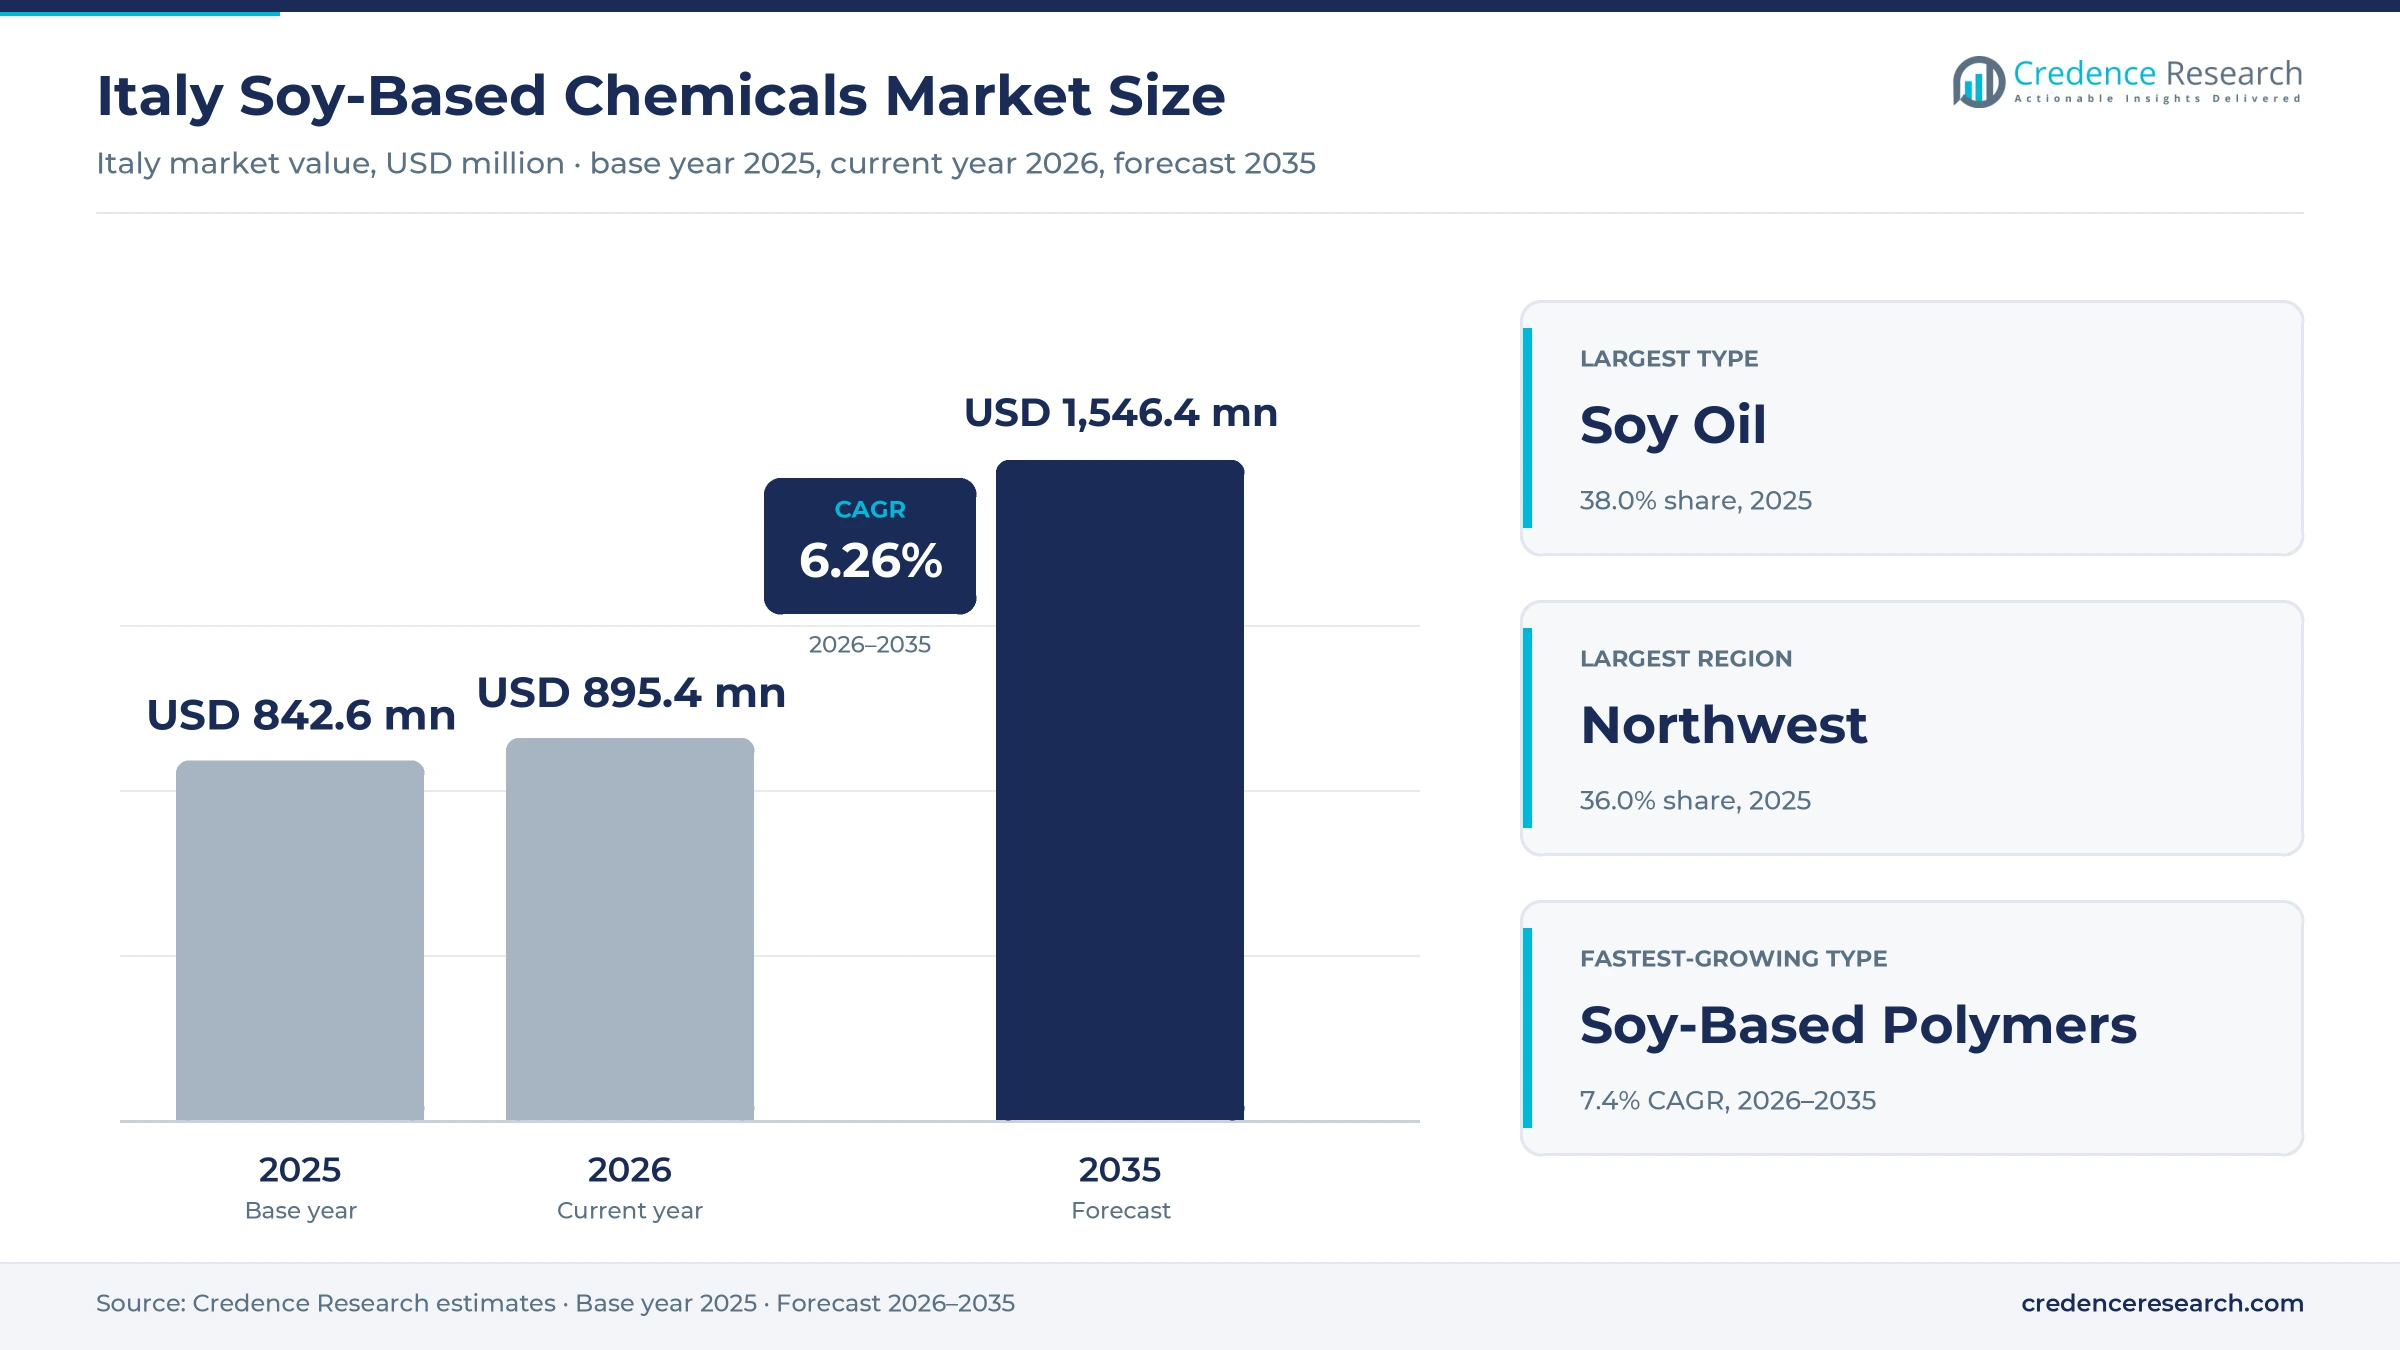
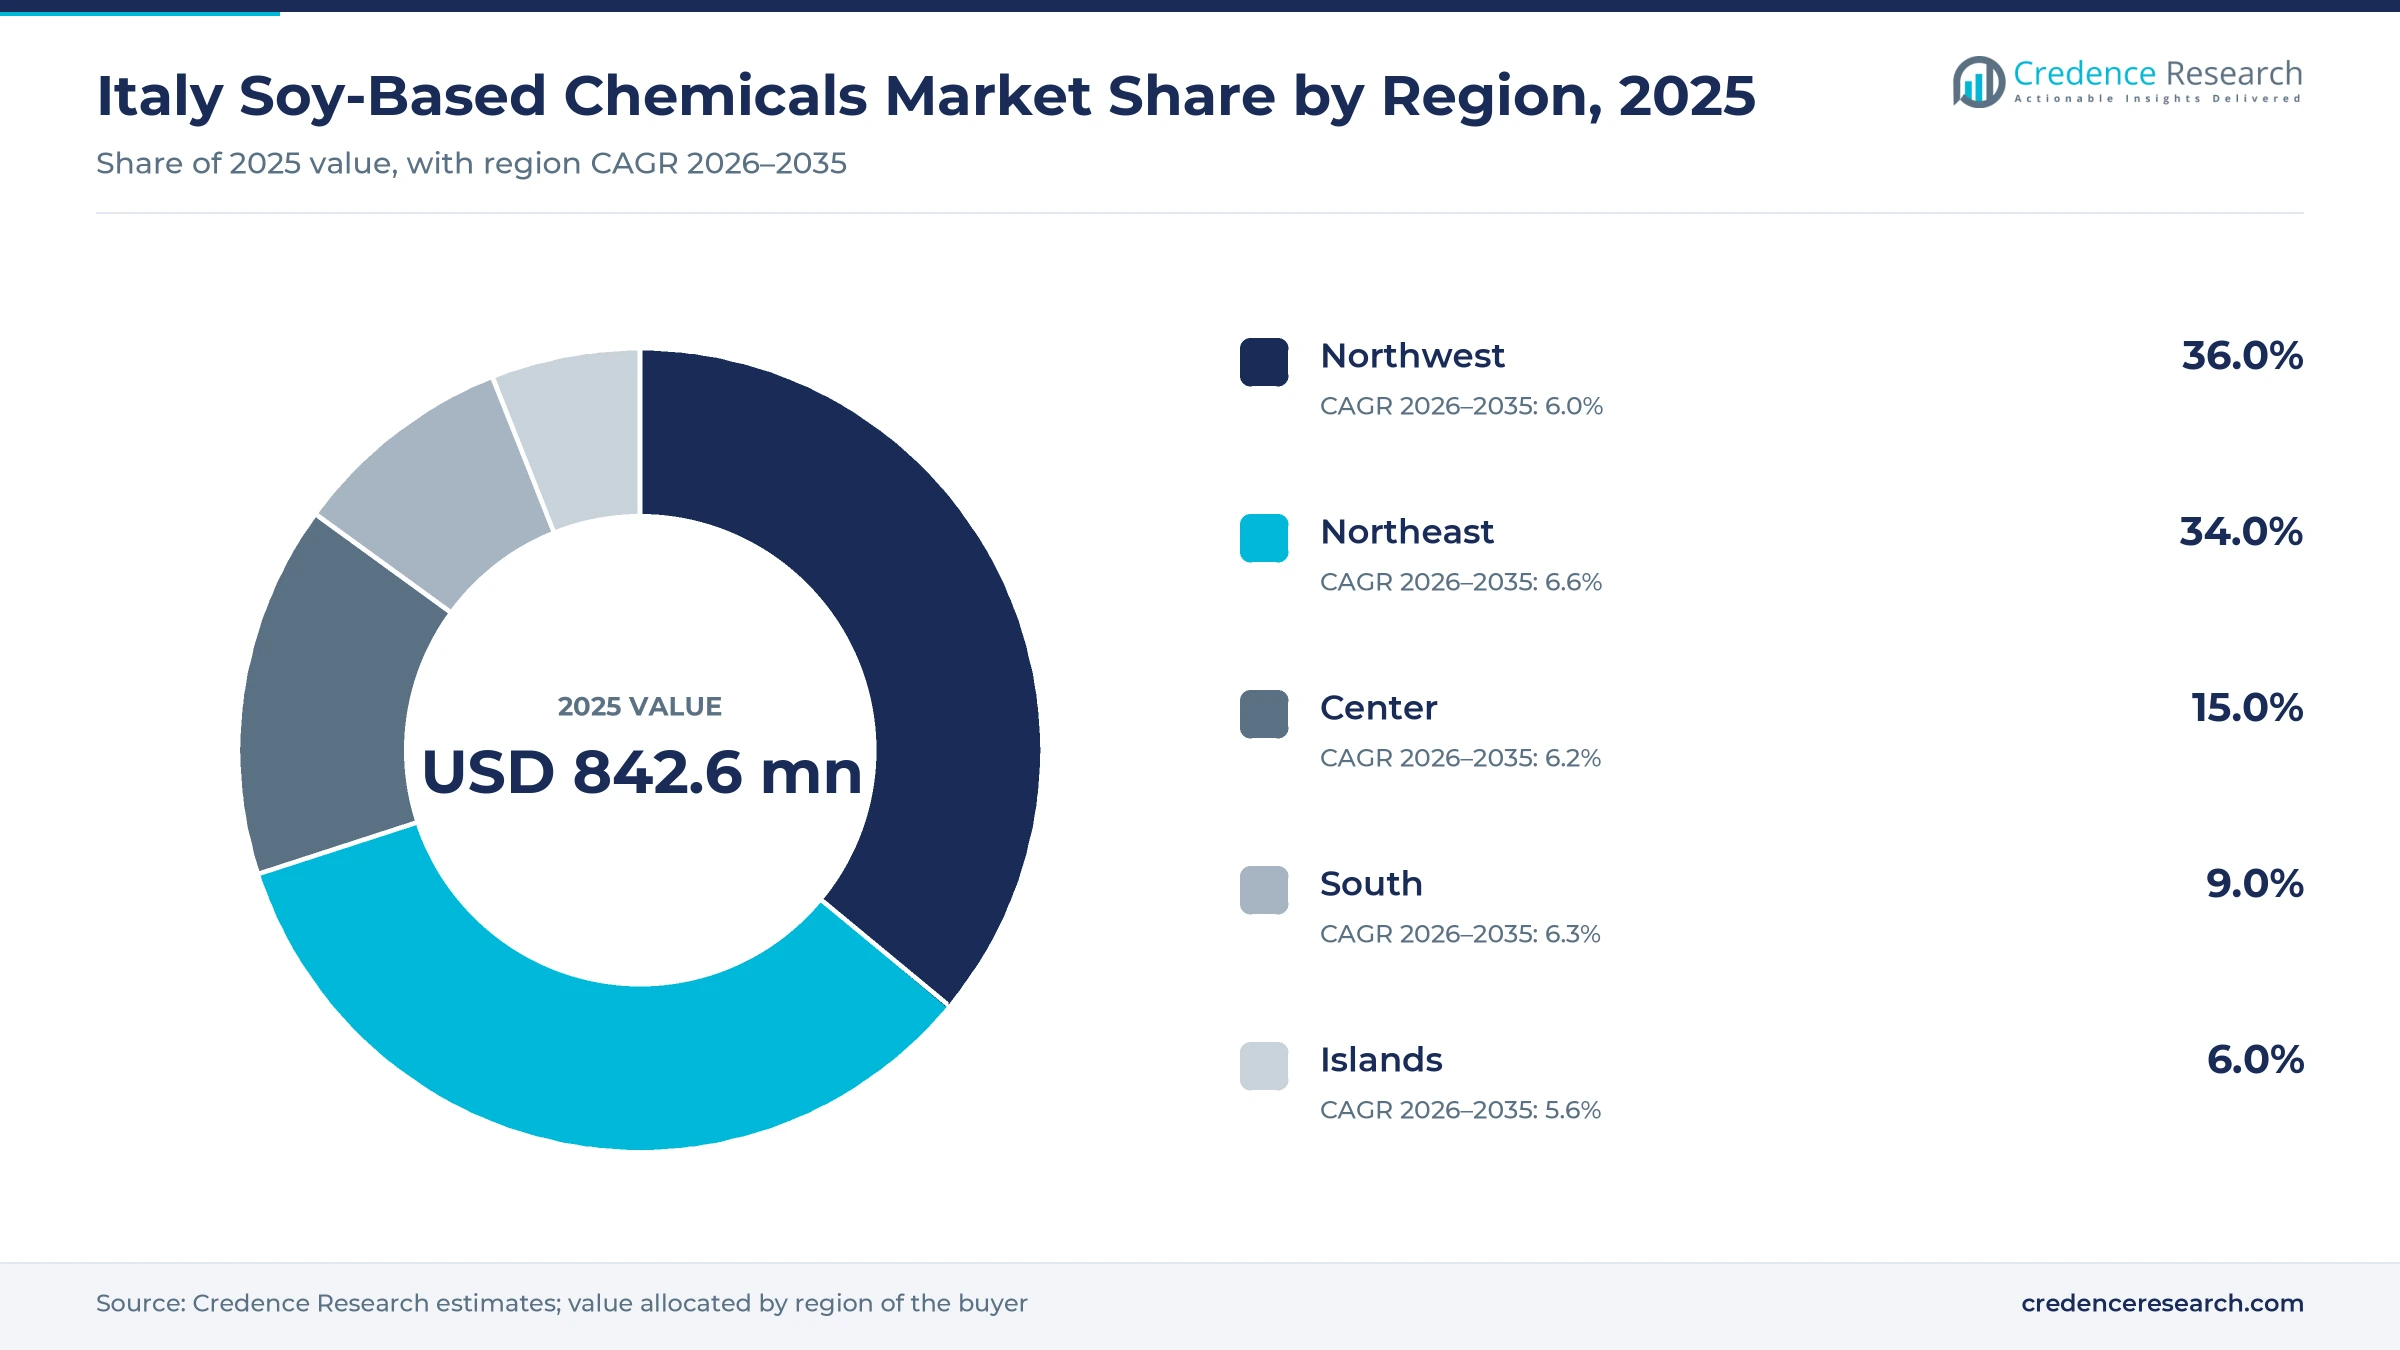
The Italy soy-based chemicals market was valued at USD 842.6 million in 2025 and is projected to increase from USD 895.4 million in 2026 to USD 1.55 billion by 2035, registering a CAGR of 6.26% during 2026–2035. Demand comes from biofuel and bioliquid users of soybean oil, makers of PVC compounds and coatings that buy epoxidized soybean oil, food and pharmaceutical formulators that use lecithin, and cosmetic contract manufacturers. The Northwest held the largest regional share, 36.0% in 2025, because Lombardy concentrates cosmetic and pharmaceutical formulation. The Northeast is the fastest-growing region at 6.6% a year, as the country's two soybean crushers expand handling of domestic beans in Veneto and Emilia-Romagna. The main commercial change is regulatory, because Italian rules have excluded oil from imported soy from biofuel blending obligations since Jan. 1, 2023, which raises the value of traceable Italian-origin oil.
Which soy derivatives and buyers does the estimate count?
The estimate counts soybean oil sold for food processing, industrial and energy uses, soy methyl esters, soy fatty acids and glycerin, soy-based polymers such as epoxidized soybean oil, polyols and alkyd oils, soy wax and lecithin, sterols and other derivatives sold in Italy. Values sit at the first sale by a crusher, refiner or importer, and industrial buyers usually purchase on quarterly or annual contracts priced against the soybean oil benchmark.
Soybean meal for animal feed and soy protein foods sit outside the estimate, although they come from the same crush and pay for most of it. The value chain runs from imported and domestic beans through crushing and refining to chemical conversion, and buyers increasingly pay more for oil whose Italian origin and deforestation-free status can be documented.
Italy Soy-Based Chemicals Market Insights
- The market is valued at USD 842.6 million in 2025 and is projected to reach USD 1.55 billion by 2035, growing at a 6.26% CAGR as formulators replace petrochemical inputs.
- The Northwest led with 36.0% of 2025 value, because Lombardy hosts most Italian cosmetic production and a large share of pharmaceutical output.
- Soy Oil held 38.0% of 2025 value, as two domestic crushers sell refined oil to food, industrial and bioliquid users.
- Bunge completed a 4.4 million euro upgrade at Porto Corsini in June 2026 to double processing of Italian-grown soybeans.
- The EU deforestation rules apply to large soy operators from Dec. 30, 2026, which favors suppliers with traceable Italian beans.
Soy oil leads while soy polymers grow fastest
Why does soy oil lead while soy polymers grow fastest?
Based on type, the market is categorized into soy oil, soy methyl esters, soy fatty acids, soy-based polymers, soy wax and others. Soy Oil led with 38.0% of 2025 value because crushers sell refined oil directly to food, industrial and bioliquid users, and Italy exported about 159,000 metric tons of soybean oil in 2024 against imports of about 70,000 tons, UN Comtrade data show. Soy-Based Polymers grow fastest at 7.4% a year as PVC compounders replace phthalates, and Cargill sells Vikoflex epoxidized soy oils, including a medical grade and a grade designed to offset phthalates.
Why do industrial uses lead as pharmaceuticals grow fastest?
Based on application, the market is categorized into industrial, cosmetics and personal care, food and beverages, pharmaceuticals and agriculture. Industrial uses led with 41.0% of 2025 value because energy, PVC, coatings and lubricant buyers take bulk oil and esters, and Italy produced 947,670 metric tons of biodiesel and HVO in 2024, according to the European Biodiesel Board. Pharmaceuticals grow fastest at 7.1% a year as drug plants that use phospholipid excipients in liposomal and parenteral formulations expand output, and Farmindustria reports 74 billion euros of Italian pharmaceutical production in 2025.
Why does healthcare lead while packaging grows fastest?
Based on end use industry, the market is categorized into healthcare, packaging, construction, automotive and others. Healthcare led with 28.0% of 2025 value because drug and supplement makers buy lecithin and phospholipid excipients, and Integratori & Salute reports about 4.5 billion euros of Italian food supplement sales in 2023, 26% of European turnover. Packaging grows fastest at 7.0% a year as EU rules bar PFAS in food-contact packaging from Aug. 12, 2026, which pushes converters toward bio-based wax and oil barrier coatings.
| Segment Group | Leading Sub-segment | Share, 2025 | Fastest-growing Sub-segment | CAGR, 2026–2035 |
|---|---|---|---|---|
| By Type | Soy Oil | 38.0% | Soy-Based Polymers | 7.4% |
| By Application | Industrial | 41.0% | Pharmaceuticals | 7.1% |
| By End Use Industry | Healthcare | 28.0% | Packaging | 7.0% |
Soybean oil benchmarks set the floor for every derivative
Pricing starts with the soybean oil benchmark, because crushers price refined oil, esters and fatty acids as a spread over it, while lecithin and epoxidized oil carry processing premiums. Soybean oil rose to an average of USD 1,140 per metric ton in 2025 from USD 1,022 in 2024, while soybean meal fell to USD 366, World Bank commodity data show. That split moved crush margins toward oil, so derivative buyers paid more. Italian soybean oil exports averaged about USD 985 per metric ton in 2024, below that year's USD 1,022 benchmark, because about 92% of exported tonnage was crude oil, UN Comtrade data show, while refined and certified grades are sold at a premium to domestic formulators.
| Product or reference | Typical price or fee | Basis |
|---|---|---|
| Soybean oil, global benchmark, 2025 average | USD 1,140 per metric ton | World Bank Pink Sheet, January 2026 |
| Soybean oil, global benchmark, 2024 average | USD 1,022 per metric ton | World Bank Pink Sheet, January 2026 |
| Soybeans, global benchmark, 2025 average | USD 414 per metric ton | World Bank Pink Sheet, January 2026 |
| Soybean meal, global benchmark, 2025 average | USD 366 per metric ton | World Bank Pink Sheet, January 2026 |
| Soybean oil, Italian exports, 2024 unit value | About USD 985 per metric ton | UN Comtrade, HS 1507, 2024 |
| Soybeans, Italian imports, 2024 unit value | About USD 485 per metric ton | UN Comtrade, HS 1201, 2024 |
Request a Free Sample
Fill in your details and we'll send you a free sample report.
- Sample data tables & charts
- Research methodology
Local crush, biofuel rules and formulators lift demand
Domestic non-GMO soybeans give crushers a local base
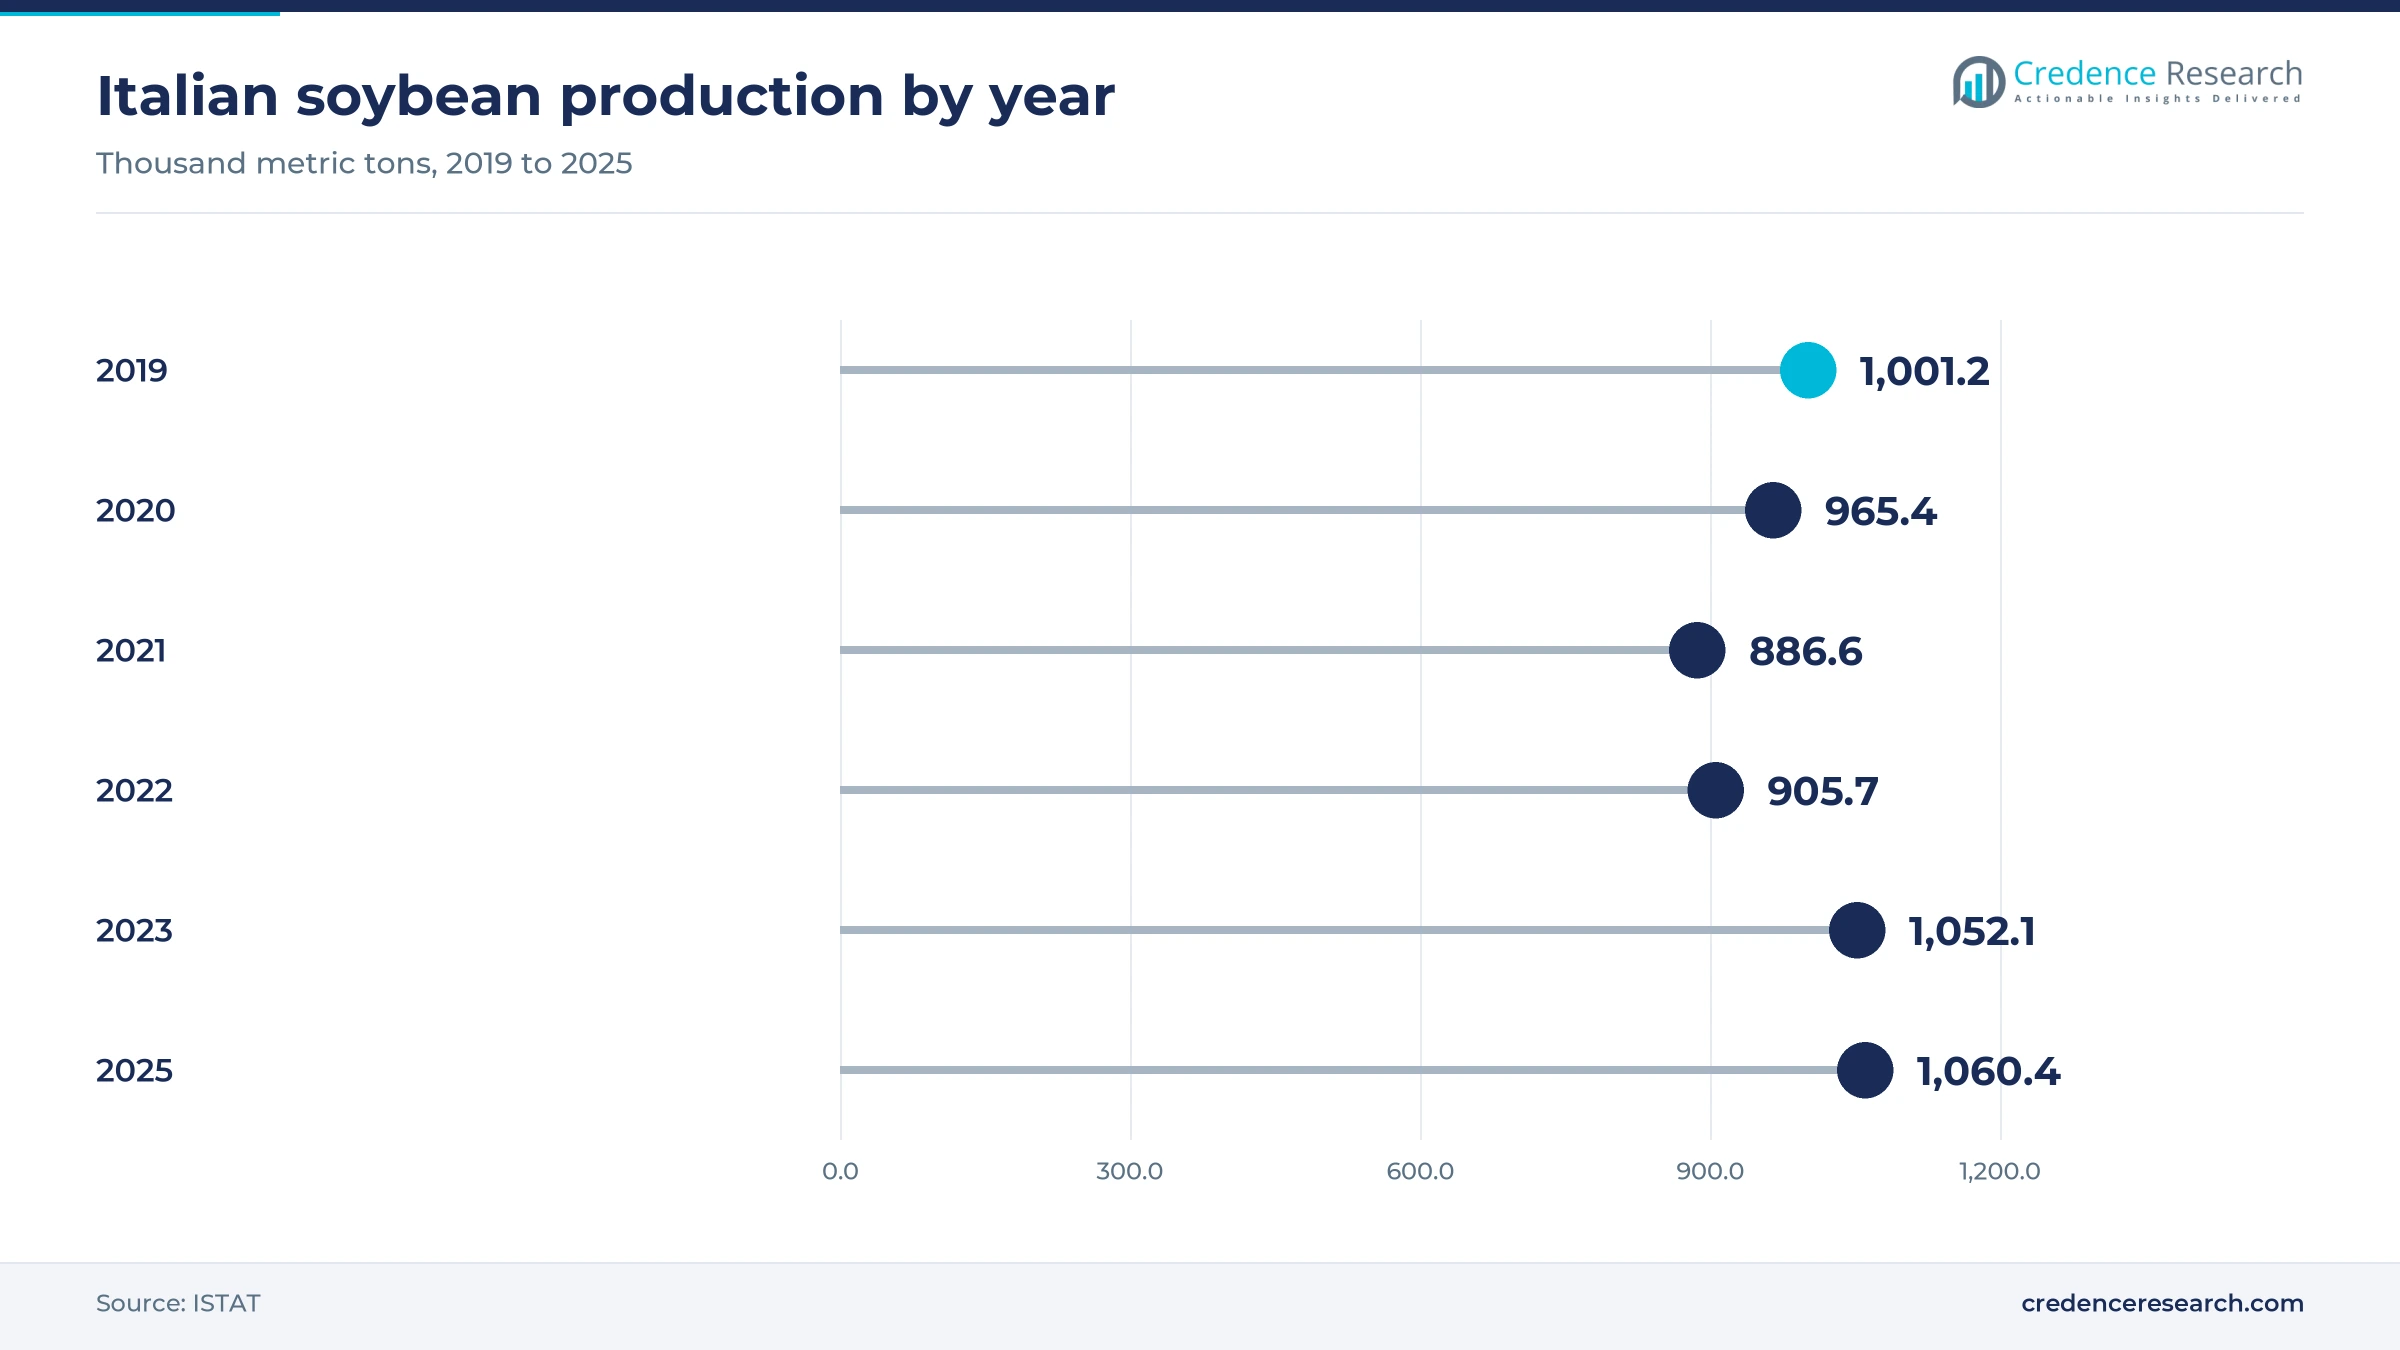
A large domestic crop gives Italian crushers a base of non-GMO beans that few EU countries can match, which supports local supply of oil and lecithin for chemical buyers. ISTAT reports that Italy harvested about 1.06 million metric tons of soybeans on 297,775 hectares in 2025, at 35.6 quintals per hectare. Soybean output has risen 94.6% since 2006 on 69.1% more area, the statistics office adds. Cereal Docks buys and processes more than 60% of Italian-grown soybeans, Il Sole 24 Ore reported in June 2024. Buyers that need non-GMO or identity-preserved oil for cosmetics, supplements and food therefore source from a short domestic chain instead of relying only on imported cargoes.
Biofuel rules reward traceable Italian-origin soy oil
Italian biofuel rules lift the value of soy oil that can be traced to domestic beans, because oil from imported soy no longer earns blending credits. Legislative Decree 199 of 2021 excludes palm oil and soybean oil and fatty acids from imported soy from diesel blending obligations, renewable electricity and related subsidies from Jan. 1, 2023. Italy produced 947,670 metric tons of biodiesel and HVO in 2024, about 8% of EU output, according to the European Biodiesel Board. Cereal Docks also burns its own soybean oil as a bioliquid to raise steam in place of methane, with an estimated 55% to 65% greenhouse gas saving, Il Sole 24 Ore reported. Crushers with documented domestic supply therefore hold an energy outlet that importers cannot reach.
Cosmetic formulators widen use of lecithin and soy esters
Cosmetic and personal care formulators widen the use of soy lecithin, soy esters and soybean oil derivatives as emollients and emulsifiers, because brands want plant-derived ingredients with a short supply chain. Italian cosmetics turnover rose 9.1% to about 16.5 billion euros in 2024, and exports reached 7.9 billion euros, Cosmetica Italia reports. Contract manufacturers generated more than 2.1 billion euros of that turnover, the association adds and they buy ingredients on behalf of many brands. Cargill sells soy, sunflower and rapeseed lecithin from its Hamburg and Zaandam plants. Suppliers that certify origin and offer cosmetic-grade fractions gain volume with these contract formulators.
Phthalate phase-outs open room for epoxidized soy oil
EU limits on phthalate plasticizers widen the use of epoxidized soybean oil, because the soy-based ester plasticizes and stabilizes PVC without the reproductive toxicity classification of DEHP. Commission Regulation (EU) 2023/2482 sets July 1, 2030 as the sunset date for DEHP in medical devices, with a latest application date of Jan. 1, 2029. Cargill sells Vikoflex 7170 as a general-purpose ESBO grade, plus a medical grade, Vikoflex 5075, and Vikoflex 2502 to offset phthalates. Italian compounders of medical tubing, blood bags and food-contact films therefore have a dated reason to qualify soy-based plasticizers well before the deadline.
Traceable sourcing and new packaging rules reshape buying
Buyers shift toward deforestation-free, traceable soy
Italian importers and formulators are shifting toward deforestation-free, traceable soy to meet the new EU due diligence law, creating openings for certified oil and lecithin across food, cosmetics and pharmaceuticals. The European Parliament adopted changes on Dec. 17, 2025 that apply the deforestation regulation to large operators from Dec. 30, 2026 and to small operators from June 30, 2027. Italy imported about 2.53 million metric tons of soybeans worth about USD 1.23 billion in 2024, UN Comtrade data show. In April 2022, ADM announced a non-GMO soy processing line at Mainz, Germany, due for completion in the third quarter of 2023, citing demand for certified European-origin soy. Suppliers that can document plot-level origin will hold contracts that bulk traders without traceability may lose.
Crushers integrate into refining, lecithin and logistics
Italian crushers are shifting toward integrated sites that refine oil and extract lecithin next to the crush, to capture margin beyond feed meal and serve chemical buyers directly. Cereal Docks inaugurated a 5 million euro pipeline at Porto Marghera on Dec. 18, 2025, the Port of Venice reported, which moves up to 300 cubic meters of vegetable oil an hour from a plant that processes about 1 million metric tons a year to a 33,000-ton depot. Bunge runs crushing, a multi-oil refinery, a bottling plant and a biodiesel facility at Porto Corsini, near Ravenna. Integrated sites cut road transfers and let crushers sell refined oil, esters and lecithin on one contract.
PFAS ban opens a packaging coating opportunity
The PFAS ban in food-contact packaging opens a supply gap for bio-based grease and moisture barriers, where soy wax and soybean oil derivatives compete with paraffin and starch. EU Regulation 2025/40 on packaging bars food-contact packaging containing PFAS above set limits from Aug. 12, 2026. Cargill lists its NatureWax C-1, C-3 and C-310 soy waxes as available in Europe with EU data sheets. Italian converters serving pasta, bakery and ready-meal producers need replacement coatings, and Packaging applications grow fastest at 7.0% a year. Suppliers that pair soy wax with coating trials and food-contact compliance files can win that conversion work.
Microplastic limits create reformulation work for formulators
The EU restriction on intentionally added microplastics creates reformulation work in which soy-derived waxes, esters and lecithin can replace synthetic polymer ingredients. Rinse-off cosmetics containing listed microplastics may be sold only until Oct. 16, 2027 and leave-on products until Oct. 16, 2029, under Commission Regulation (EU) 2023/2055. The same regulation gives controlled-release fertilizers a five-year transition to reach biodegradability, which reaches agricultural formulators. Contract manufacturers concentrated in Lombardy handle much of that reformulation for brands, so suppliers of soy-based cosmetic oleochemicals with technical service and test data stand to gain new formulation briefs before the deadlines.
Import dependence, weather and waste oils limit growth
Import dependence exposes buyers to soy price swings
Italy depends on imported beans for most of its crush, so world soy prices pass quickly into local derivative costs. Domestic output covers only about 20% of national soy demand, Il Sole 24 Ore reported in July 2025, against a need of more than 5 million metric tons. Small formulators that buy oil and lecithin on spot terms are most exposed when the oil benchmark rises, as it did in 2025, while integrated crushers can offset part of it through meal sales.
Weather volatility hits the domestic non-GMO crop
The domestic crop that underpins Italian-origin oil is vulnerable to drought and heat. ISTAT data show that Italy harvested only about 906,000 metric tons from 343,000 hectares in 2022, a yield near 26.4 quintals per hectare, against 35.6 quintals in 2025. Buyers that depend on traceable Italian oil for biofuel credits or non-GMO labels are most exposed in dry years, when crushers must ration domestic beans or blend imported supply.
Waste-based feedstocks crowd out soy in biofuels
Italy's largest biofuel producer relies on used cooking oil, animal fats and agricultural residues rather than soybean oil. Enilive (Eni) secured 500 million euros of 15-year European Investment Bank financing in July 2025 to convert its Livorno refinery around a 500,000-metric-ton-a-year Ecofining unit, S&P Global reported. Soy methyl ester producers are most exposed, because new capacity is built around waste oils that earn higher credits.
Deforestation compliance adds cost for small importers
The EU deforestation regulation adds due diligence, geolocation and audit costs for every soy shipment from Dec. 30, 2026. Certification costs in Italy are reportedly three times higher than in Germany, speakers told a Senate meeting reported by Il Sole 24 Ore in July 2025. Small importers and formulators without in-house compliance teams are most exposed, although small operators gain an extra six months to June 30, 2027.
Northwest leads on formulators as Northeast grows fastest
| Region | Value, 2025 (USD million) | Share, 2025 | CAGR, 2026–2035 |
|---|---|---|---|
| Northwest | 303.3 | 36.0% | 6.0% |
| Northeast | 286.5 | 34.0% | 6.6% |
| Center | 126.4 | 15.0% | 6.2% |
| South | 75.8 | 9.0% | 6.3% |
| Islands | 50.6 | 6.0% | 5.6% |
Northwest leads on cosmetic and pharmaceutical formulation
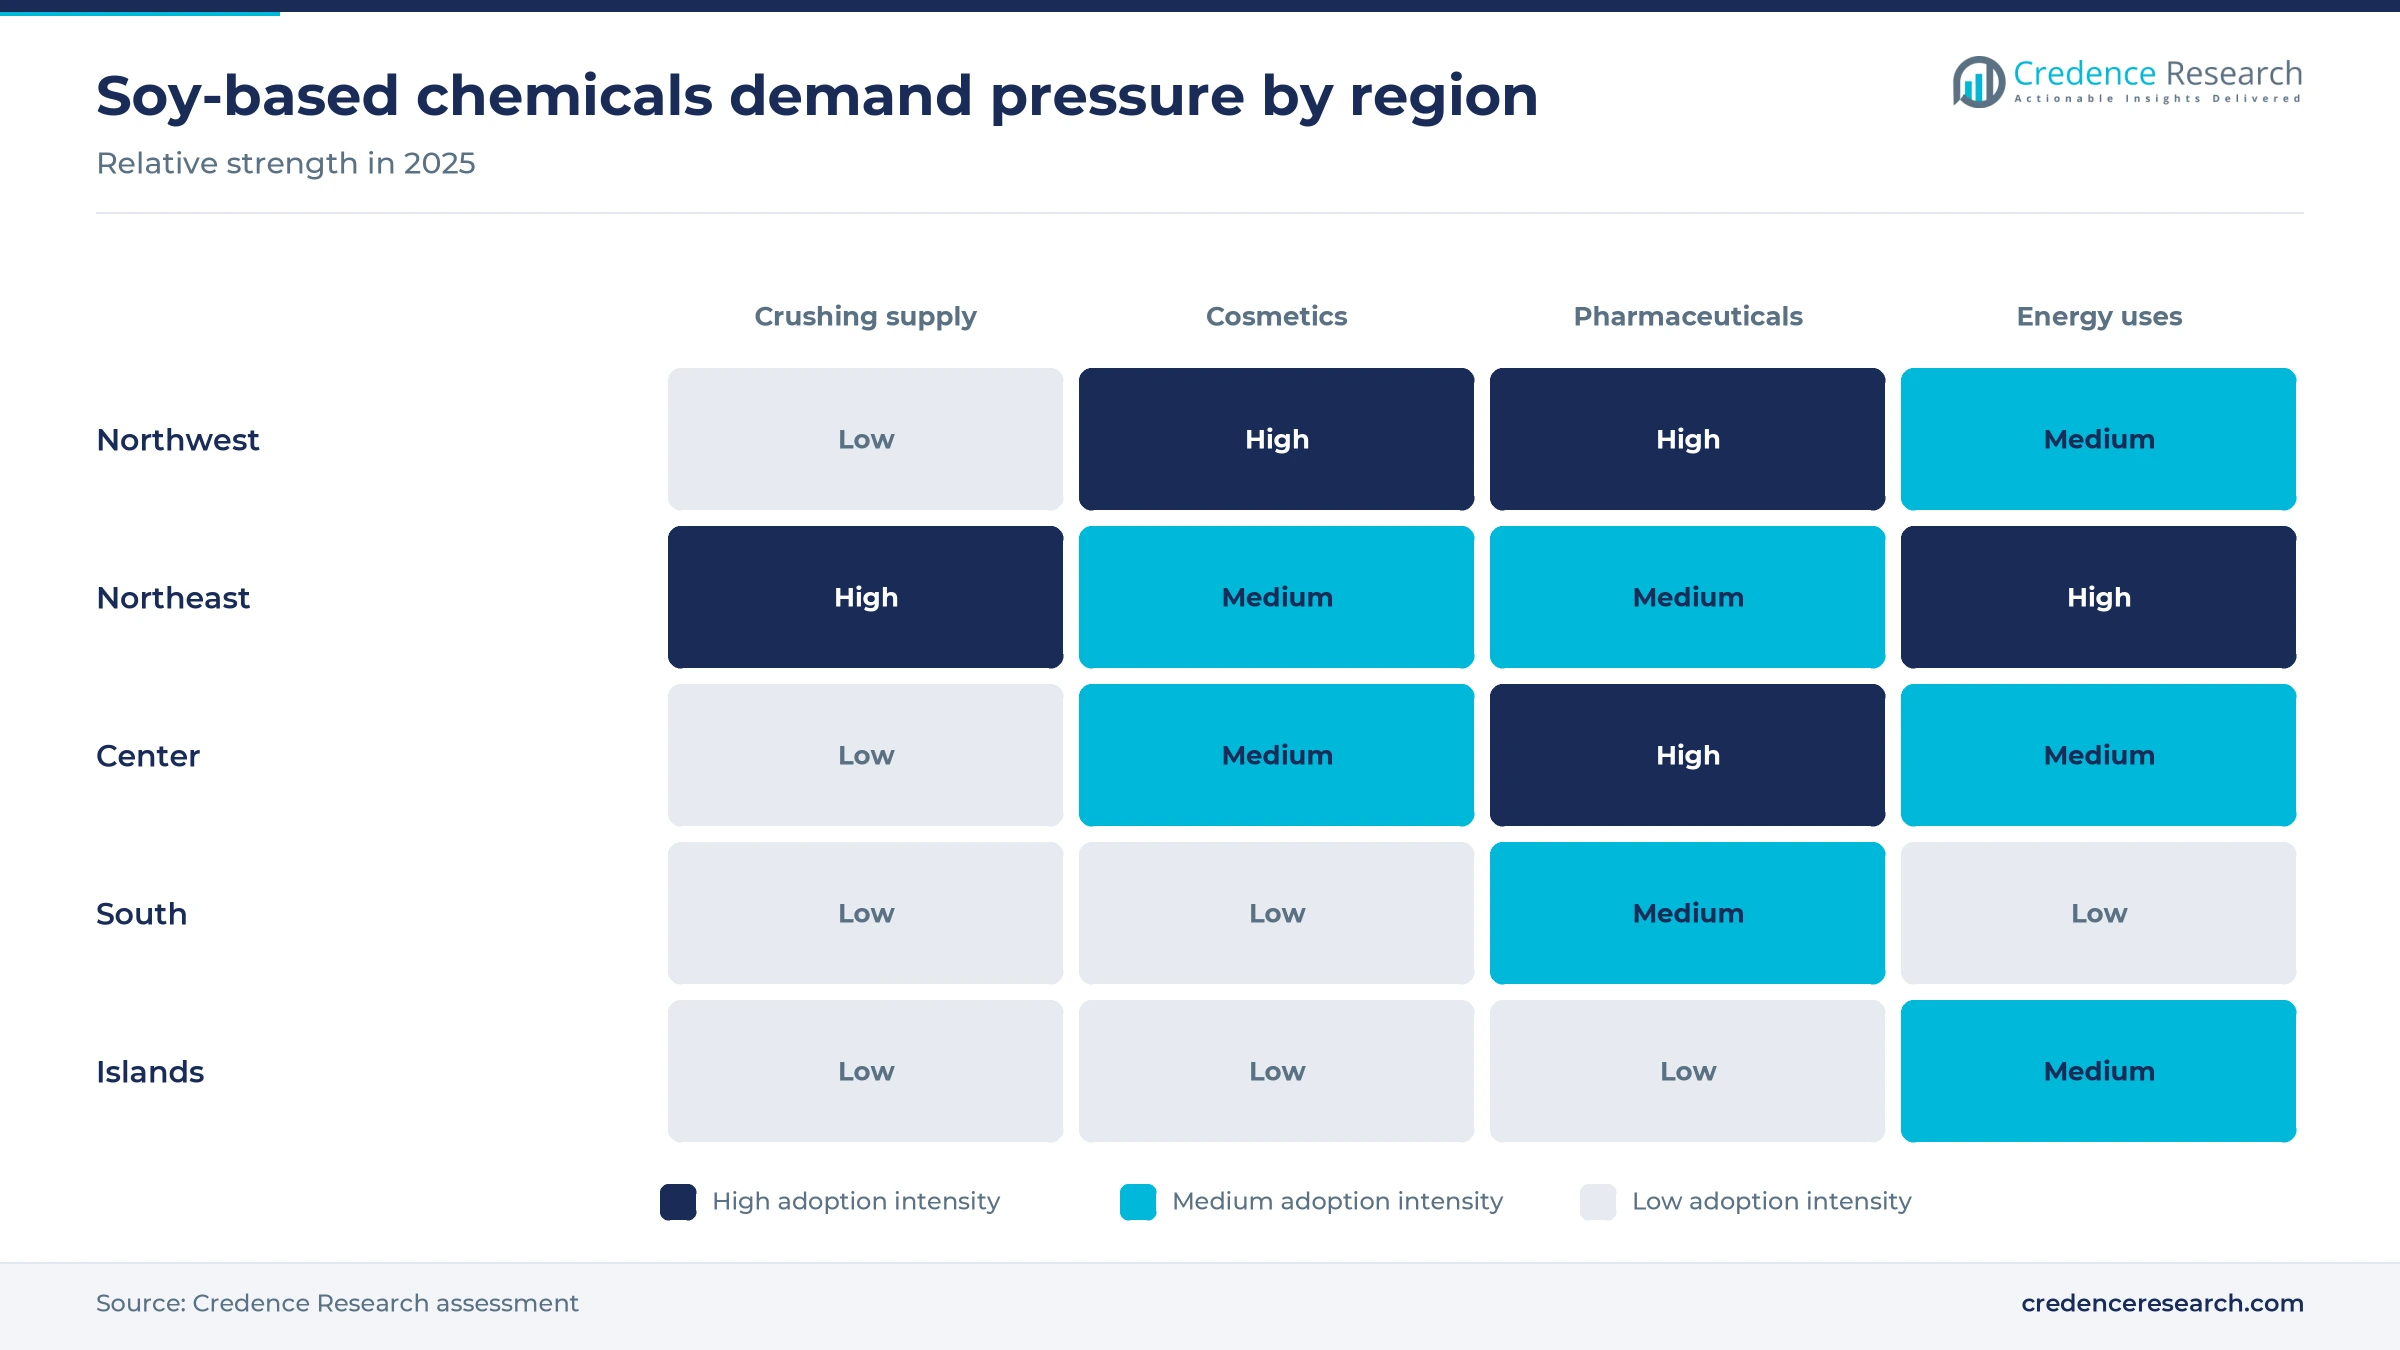
The Northwest held 36.0% of 2025 value and grows at 6.0% a year, because Lombardy concentrates the formulators that buy lecithin, soy esters and epoxidized oil. Lombardy accounts for about 66.6% of Italian cosmetics turnover, and about 79% of contract manufacturing turnover, according to Cosmetica Italia. The region also exported about 11.9 billion euros of pharmaceuticals in 2025, about 20% of the national total, Il Sole 24 Ore reported. Growth stays slightly below the national rate because the region already has high penetration.
Northeast grows fastest on domestic crushing capacity
The Northeast held 34.0% of 2025 value and grows fastest at 6.6% a year, because the country's soybean crushers sit in Veneto and Emilia-Romagna, close to domestic soybean supply. Two Cereal Docks crushing plants operate in the Venice area and Bunge runs the third at Ravenna, according to the U.S. Soybean Export Council. Bunge completed a 4.4 million euro upgrade at Porto Corsini in June 2026 that doubles its processing of Italian-grown soybeans, and the Venice biorefinery adds a nearby energy outlet for oil.
Center gains from pharmaceutical exports in Tuscany and Lazio
The Center held 15.0% of 2025 value and grows at 6.2% a year, in line with the national rate, because its pharmaceutical plants buy phospholipid and lecithin excipients. In Tuscany, medicine exports topped 22 billion euros in 2025, up 93%, and Lazio shipped about 18 billion euros, Il Sole 24 Ore reported in March 2026. Public data on soy derivative use by Central Italian plants are not available, so this share is a Credence Research estimate with a wide error range.
South builds on Campania pharmaceutical demand
The South held 9.0% of 2025 value and grows at 6.3% a year, slightly above the national rate, because Campania and Abruzzo host growing drug plants. Campania exported about 8 billion euros of pharmaceuticals in 2025 and Abruzzo about 2 billion euros, up 54%, Il Sole 24 Ore reported. Soy crushing and large formulators are largely absent from the South, so most derivatives arrive from northern plants, and the regional share carries a wide error range.
Islands depend on energy and food uses
The Islands held 6.0% of 2025 value and grow at 5.6% a year, the slowest rate, because Sicily and Sardinia have few chemical formulators and no soybean crusher. Enilive (Eni), which runs the Gela biorefinery in Sicily, sources used cooking oil, animal fats and agricultural residues across its plants, S&P Global reported in October 2025. That feedstock mix means Gela adds little regional demand for soy oil through 2035. Public data on soy derivative use in the Islands are thin, so this share is a Credence Research estimate.
Crusher upgrades and EU rule changes set the pace
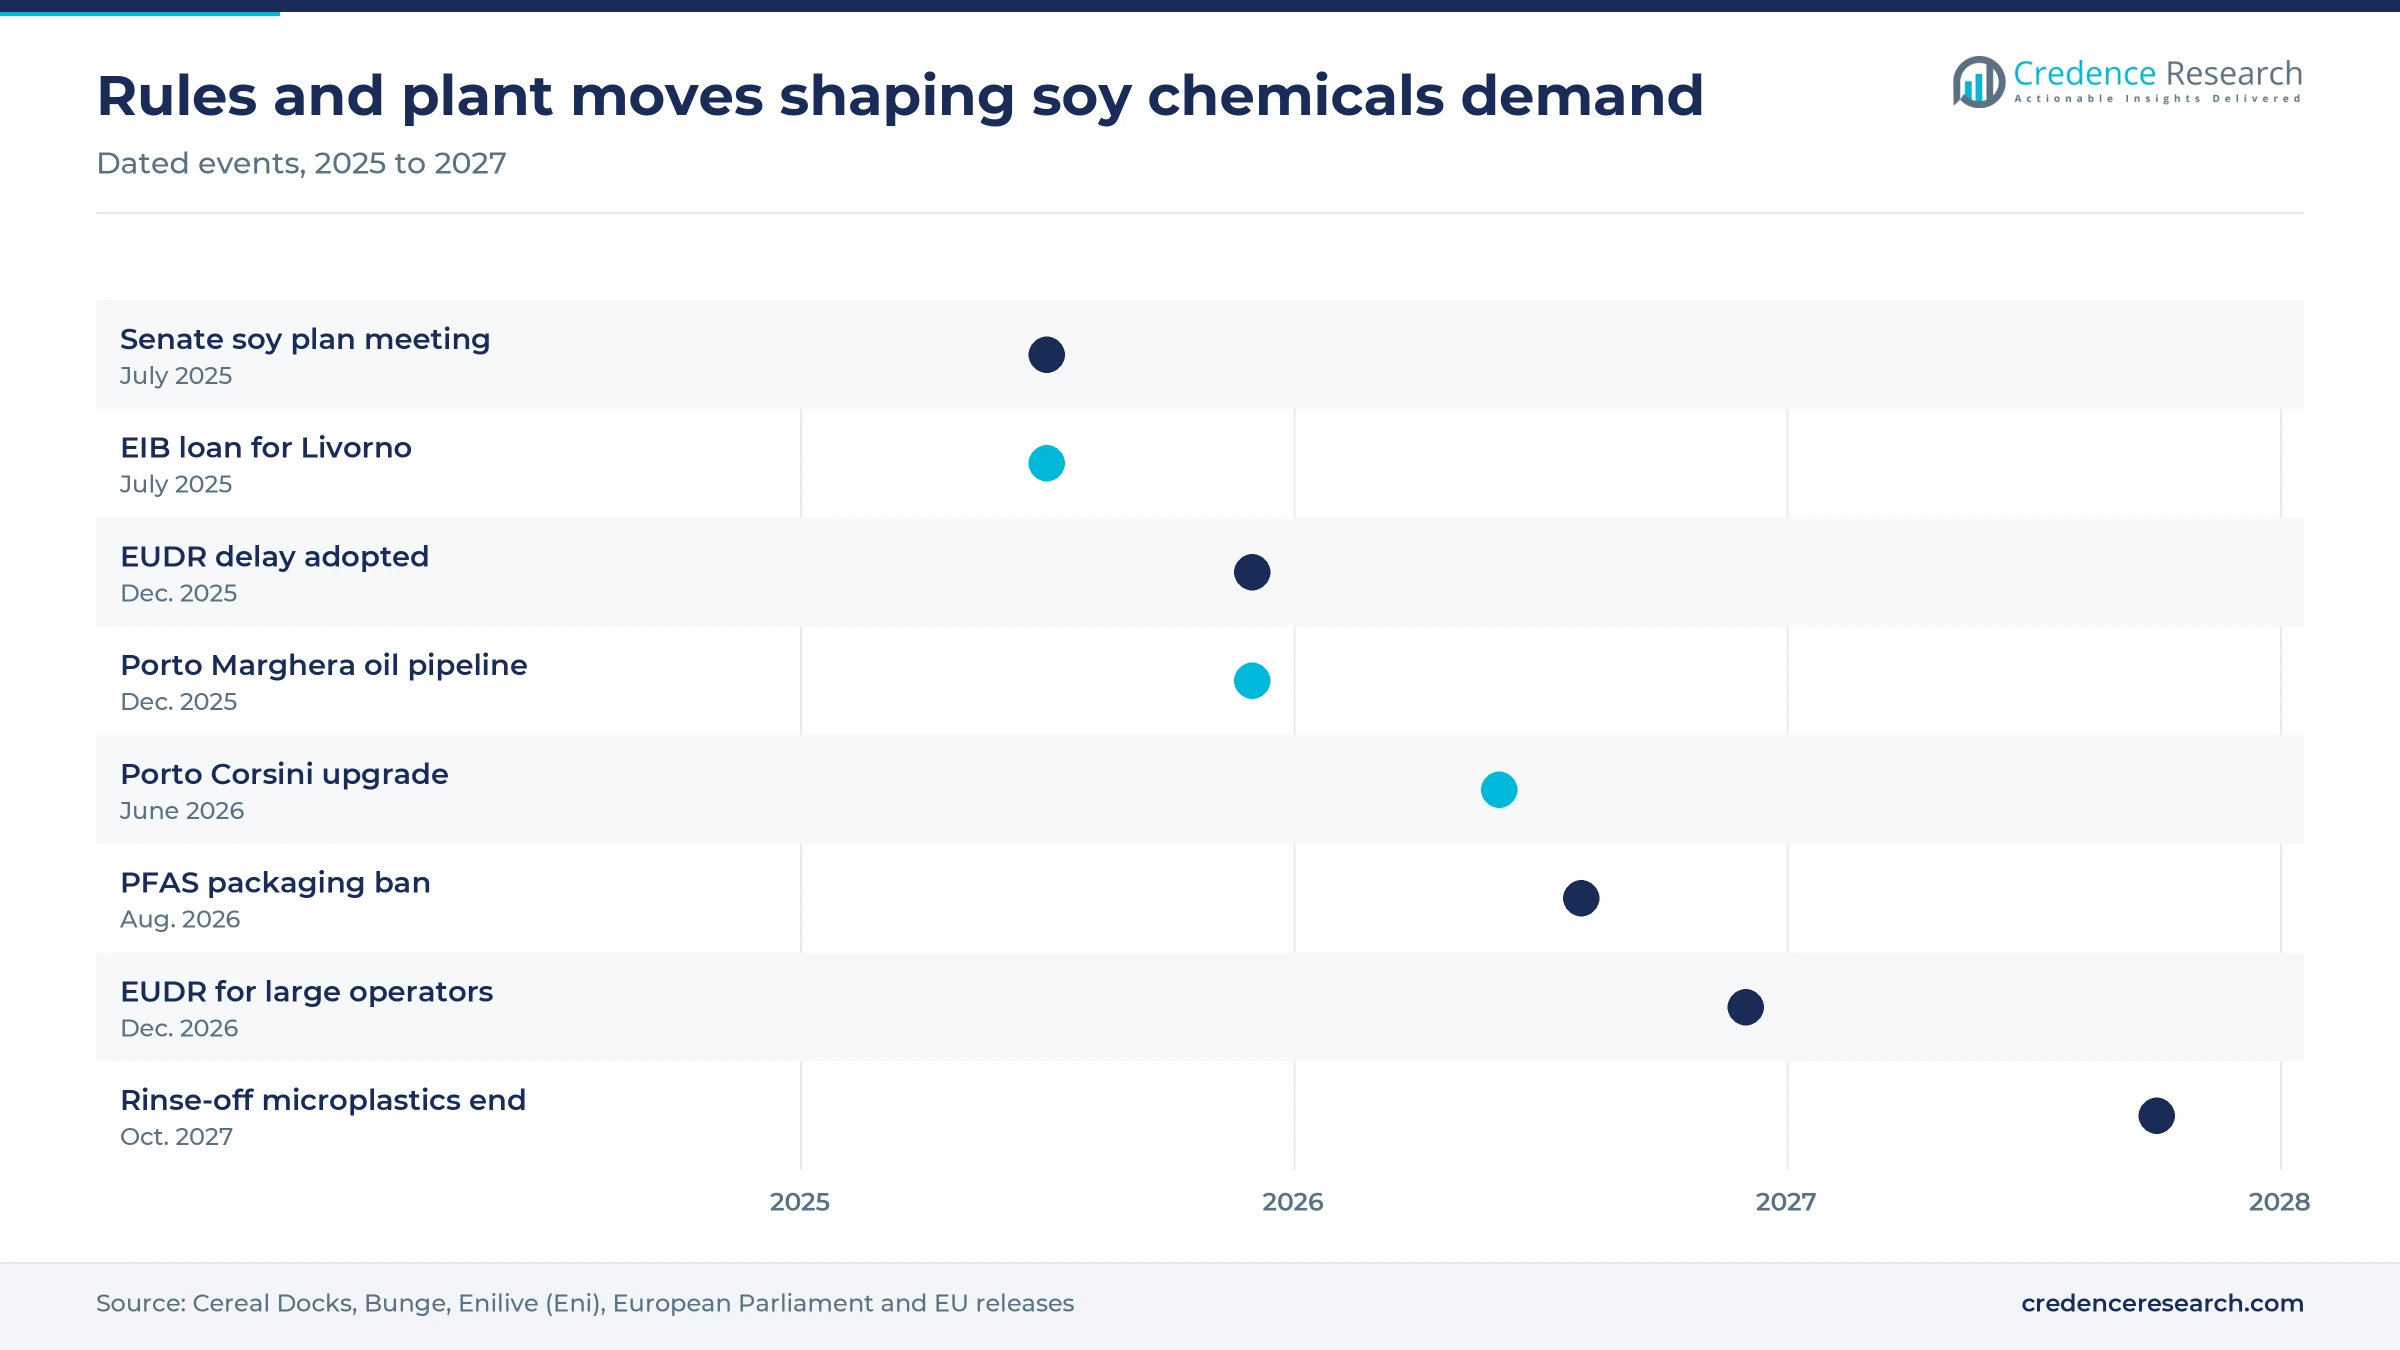
| Development | Status and market relevance |
|---|---|
| In July 2025, Cereal Docks promoted a Senate meeting in Rome on a national soy production plan, backed by the main farm unions. | Proposal stage; aims to raise domestic soy supply, which would support traceable Italian-origin oil and lecithin. |
| In July 2025, Enilive (Eni) secured 500 million euros of European Investment Bank financing to convert its Livorno refinery into a biorefinery. | Financing approved, project in development; built around waste-based feedstocks that compete with soy methyl esters. |
| In December 2025, Cereal Docks inaugurated a 5 million euro vegetable oil pipeline in Porto Marghera, Venice. | Completed and operational; removes more than 10,000 road transfers a year between its plant and oil depot. |
| In December 2025, the European Parliament adopted a one-year postponement of the EU deforestation regulation. | Adopted law; large operators apply from Dec. 30, 2026 and small operators from June 30, 2027. |
| In June 2026, Bunge completed a 4.4 million euro upgrade at its Porto Corsini site near Ravenna. | Completed investment; doubles processing of Italian-grown soybeans ahead of the 2026 harvest. |
Refining, epoxidation and fractionation set product value
- Degumming and refining removes phosphatides, free fatty acids and odors from crude oil, and the separated gums are dried into crude lecithin for food and feed uses.
- Epoxidation reacts soybean oil with peracids to make ESBO, which plasticizes and stabilizes PVC and replaces part of phthalate loadings.
- Transesterification converts soybean oil and methanol into soy methyl esters for fuel, solvents and lubricants, with glycerin as a coproduct.
- Lecithin fractionation separates phosphatidylcholine-rich grades for pharmaceutical, supplement and cosmetic uses, which carry the highest prices and require pharmaceutical quality systems at the producing plant.
Need a Custom Version of This Report?
Tailor the scope, geography, or segments to your exact requirements.
- Custom geography or segment scope
- Direct access to our analyst team
Two domestic crushers and global ingredient firms compete
Competition turns on access to beans, traceability, refining capacity and the ability to supply certified grades, rather than on branding. Cereal Docks leads domestic supply through its Venice-area plants and its purchases of most Italian-grown soybeans. Bunge competes from Porto Corsini with crushing, refining and biodiesel on one site. Cargill supplies lecithin, NatureWax soy wax and Vikoflex epoxidized oils, while ADM processes non-GMO soybeans at its German plants for food and feed buyers. Formulators usually qualify two lecithin suppliers and sign annual contracts. Public data on supplier shares in Italy are not available, so market shares are an evidence gap. The four companies profiled below cover domestic crushing, lecithin and specialty soy derivatives.
Where do margins sit along the soy chemicals chain?
The Italian supply side runs in three tiers with distinct margins. Two domestic crushers process imported beans alongside a national crop of about 1.06 million metric tons, the only large source of traceable non-GMO oil. These crushers, Cereal Docks and Bunge, control most local oil and lecithin output and earn their base margin on meal. Global ingredient groups such as Cargill and ADM supply lecithin fractions, soy wax and epoxidized oil from plants outside Italy. A third tier of distributors and compounders blends and repackages these inputs for Italian formulators. Entry barriers sit in crushing capital, port access and traceability systems. Margins are thin in crude oil and highest in pharmaceutical lecithins, medical-grade plasticizers and certified non-GMO grades.
Companies profiled and their roles in this market
| Company | Type | Role in the market |
|---|---|---|
| Cereal Docks S.p.A. | Domestic crusher | Crushes soybeans near Venice into oils, meals and lecithins for Italian buyers |
| Bunge Global SA | Crusher and refiner | Crushes, refines and converts soybean oil to biodiesel at Porto Corsini, Ravenna |
| Cargill, Incorporated | Specialty supplier | Sells soy lecithin, NatureWax soy wax and Vikoflex epoxidized soy oils |
| Archer Daniels Midland Company (ADM) | Specialty supplier | Processes non-GMO soybeans at Mainz, Germany, for food and feed buyers |
Italian-origin traceability earns the premium
Credence Research's view is that traceable Italian origin will decide who earns the premium in soy-based chemicals over the next decade. The biofuel exclusion of imported-soy oil and the deforestation regulation both reward oil and lecithin that can be tied to known fields. Crushers with domestic beans gain pricing power, while importers of anonymous cargoes face higher costs. Formulators should lock in multiyear supply of certified lecithin and ESBO before the 2026 and 2029 regulatory dates, and crushers should invest in fractionation to sell higher-value grades.
Earlier estimate rolled forward and tested on soy supply
The report uses 2025 as the base year and forecasts to 2035. The earlier Credence Research estimate for 2024 was rolled forward one year at its own growth rate and tested against soybean supply, crush yields, trade volumes and derivative prices. Regional and segment shares are Credence Research estimates based on crusher locations, formulator clusters, pharmaceutical exports and biofuel capacity. Sources include ISTAT, UN Comtrade, the World Bank, EU legislation, Italian law, trade associations and company releases. No interviews or surveys were conducted for this update of the estimate.
Polymers, pharma and traceable oil carry growth to 2035
Growth to 2035 depends on the start of the deforestation regulation, on domestic soybean acreage and on how quickly phthalate and PFAS substitution reaches Italian converters. The base case assumes the regulation starts as adopted and oil prices ease from 2025 levels. Soy-based polymers and pharmaceutical uses should gain share, while soy methyl esters lose ground to waste-based biofuels. The Northeast gains from crusher upgrades, while the Northwest remains the largest regional market because of its formulator base. By 2035, the Italy soy-based chemicals market is projected to reach USD 1.55 billion, with soy-based polymers gaining the most share.
Traceability rules and soy prices set the range of outcomes
The range of outcomes depends mainly on how smoothly the deforestation regulation starts and on the soybean oil benchmark. A costly start with high oil prices would push small buyers toward petrochemical and waste-based substitutes. A stable start with more domestic acreage would lift traceable oil and lecithin sales. Faster phthalate and PFAS substitution is the main upside to the base case.
| Scenario | CAGR, 2026–2035 | Value, 2035 | What has to hold |
|---|---|---|---|
| Downside | 4.8% | USD 1.36 billion | EUDR start raises import costs and soy oil stays above 2025 levels |
| Base | 6.26% | USD 1.55 billion | EUDR starts as adopted, domestic acreage holds and oil prices ease |
| Upside | 7.5% | USD 1.71 billion | Domestic soy area expands and ESBO and barrier coatings win faster substitution |
Frequently Asked Questions
How big is the Italy soy-based chemicals market?
What counts as a soy-based chemical?
Which type leads the Italian soy chemicals market?
Which region leads soy-based chemicals demand in Italy?
How much soy does Italy produce?
Can soybean oil be used for biofuel in Italy?
Who are the main suppliers of soy-based chemicals in Italy?
Which soy chemical type grows fastest in Italy?
Table of Content
Chapter 1 Market Segmentation
- 1.1 Segmentation Framework
- 1.1.1 Product and Service Classification
- 1.1.2 Application and End-Use Classification
- 1.1.3 Technology and Solution Classification
- 1.1.4 Customer and Distribution Channel Classification
- 1.1.5 Geographic Segmentation
- 1.1.6 Market Segment Definitions and Boundaries
- 1.2 By Type
- 1.2.1 Soy Oil
- 1.2.2 Soy Methyl Esters
- 1.2.3 Soy Fatty Acids
- 1.2.4 Soy-Based Polymers
- 1.2.5 Soy Wax
- 1.2.6 Others
- 1.3 By Application
- 1.3.1 Industrial
- 1.3.2 Cosmetics & Personal Care
- 1.3.3 Food & Beverages
- 1.3.4 Pharmaceuticals
- 1.3.5 Agriculture
- 1.4 By End Use Industry
- 1.4.1 Healthcare
- 1.4.2 Packaging
- 1.4.3 Construction
- 1.4.4 Automotive
- 1.4.5 Others
Chapter 2 Introduction
- 2.1 Report Objectives and Scope
- 2.2 Product Definition and Industry Terminology
- 2.3 Market Inclusions and Exclusions
- 2.4 Research Process
- 2.4.1 Primary Research and Expert Interviews
- 2.4.2 Secondary Research and Source Review
- 2.4.3 Top-Down and Bottom-Up Estimation
- 2.4.4 Data Triangulation and Verification
- 2.5 Market Size Measurement Basis
- 2.5.1 2025: USD 842.6 million → 2035: USD 1.55 billion
- 2.6 Historical and Forecast Reference Periods
- 2.6.1 Historical Period: 2018-2025
- 2.6.2 Base Year: 2025
- 2.6.3 Forecast Period: 2025-2035
- 2.7 Research Assumptions and Limitations
Chapter 3 Executive Summary
- 3.1 Market Snapshot and Key Findings
- 3.2 Base-Year Market Size, 2025
- 3.3 Forecast Market Size, 2035
- 3.4 Revenue and Volume Growth Outlook
- 3.5 Key Demand and Supply Indicators
- 3.6 Leading Market Segments
- 3.7 Fastest-Growing Market Opportunities
- 3.8 Regional Performance Highlights
- 3.9 Technology and Industry Transformation
- 3.10 Competitive Landscape Summary
- 3.11 Analyst View and Strategic Implications
Chapter 4 Italy Soy-Based Chemicals Market Trends and Developments
- 4.1 Historical Industry Development, 2018-2025
- 4.2 Recent Market Trends and Developments
- 4.3 Demand and Customer Behavior Trends
- 4.4 Technology and Product Innovation
- 4.5 Artificial Intelligence, Automation and Digitalization
- 4.6 Local Manufacturing and Supply Chain Realignment
- 4.7 Industry Partnerships, Mergers and Acquisitions
- 4.8 Sustainability and Circular Economy Developments
- 4.9 Government and Private Sector Investment Trends
- 4.10 Emerging Business Models and Commercialization
- 4.11 Industry Developments and Announcements
Chapter 5 Italy Soy-Based Chemicals Market Production, Supply and Demand Analysis
- 5.1 Demand Trend and Consumption Analysis, 2018-2025
- 5.2 Demand Forecast, 2025-2035
- 5.3 Production and Output Trend, 2018-2025
- 5.4 Production and Output Forecast, 2025-2035
- 5.5 Installed Capacity and Capacity Utilization
- 5.6 Company-Wise Production Plants and Statistics
- 5.6.1 Installed Production Capacity
- 5.6.2 Actual Production
- 5.6.3 Planned Capacity and Expansion Targets
- 5.7 Supply Chain Structure and Procurement Trends
- 5.8 Supply-Demand Gap and Bottlenecks
- 5.9 Import Dependence and Sourcing Structure
- 5.10 Contract Manufacturing and Outsourcing
- 5.11 Regional Supply and Demand Concentration
Chapter 6 Italy Soy-Based Chemicals Market Pricing Analysis
- 6.1 Pricing Structure and Measurement
- 6.2 Historical Pricing Trends, 2018-2025
- 6.3 Pricing Outlook, 2025-2035
- 6.4 Average Selling Price and Unit Economics
- 6.5 Pricing by Product and Market Segment
- 6.6 Geographic Pricing Differences
- 6.7 Key Input, Energy, Labor and Logistics Costs
- 6.8 Contract Pricing and Purchasing Models
- 6.9 Pricing Sensitivity and Competitive Positioning
- 6.10 Price, Margin and Profitability Implications
Chapter 7 Italy Soy-Based Chemicals Market Dynamics
- 7.1 Market Growth Drivers
- 7.1.1 Demand-Side Drivers
- 7.1.2 Technology and Innovation Drivers
- 7.1.3 Infrastructure and Investment Drivers
- 7.1.4 Regulatory and Policy Drivers
- 7.2 Market Restraints
- 7.2.1 Cost and Affordability Constraints
- 7.2.2 Technology and Adoption Barriers
- 7.2.3 Supply Chain and Operational Constraints
- 7.3 Market Challenges
- 7.3.1 Competitive Pressure and Margin Erosion
- 7.3.2 Skills, Infrastructure and Implementation Gaps
- 7.4 Emerging Market Opportunities
- 7.5 Market Dynamics Impact and Time-Horizon Assessment
Chapter 8 Italy Soy-Based Chemicals Value Chain Analysis
- 8.1 Industry Value Chain Overview
- 8.2 Upstream Suppliers and Critical Inputs
- 8.3 Technology and Component Providers
- 8.4 Manufacturing or Service Delivery
- 8.5 Distribution, Channel Partners and Integrators
- 8.6 Downstream Applications and End Users
- 8.7 Value Addition and Profit Pools
- 8.8 Vertical Integration and Outsourcing
- 8.9 Supplier Concentration and Risk
- 8.10 Supply Chain Localization and Resilience
Chapter 9 Italy Soy-Based Chemicals Market Regulations and Policies
- 9.1 Relevant Laws, Standards and Compliance Frameworks
- 9.2 Product, Service, Safety and Quality Requirements
- 9.3 Government Policies, Incentives and Subsidies
- 9.4 Imports, Exports and Trade Barriers
- 9.5 Public Procurement and Local Content Requirements
- 9.6 Environmental and Sustainability Compliance
- 9.7 Upcoming Policy Changes and Market Implications
Chapter 10 Italy Soy-Based Chemicals Market Hotspots and Opportunities
- 10.1 Market Opportunity Mapping and Growth Hotspots
- 10.2 High-Growth Applications and Customer Groups
- 10.3 Underserved Markets and White-Space Opportunities
- 10.4 Emerging Technology and Product Opportunities
- 10.5 New Capacity and Investment Hotspots
- 10.6 Market Entry and Expansion Opportunities
- 10.7 Distribution and Partnership Opportunities
- 10.8 Near-Term and Long-Term Commercial Potential
- 10.9 Opportunity Attractiveness and Execution Risks
Chapter 11 Italy Soy-Based Chemicals Market Outlook, 2025-2035
- 11.1 Market Size and Analysis
- 11.1.1 Revenue (Market Measurement: 2025: USD 842.6 million → 2035: USD 1.55 billion)
- 11.1.2 Market Volume and Quantity Sold
- 11.1.3 Historical Market Size, 2018-2025
- 11.1.4 Base-Year Market Size, 2025
- 11.2 Market Forecast, 2025-2035
- 11.2.1 Revenue Forecast to 2035
- 11.2.2 Volume Forecast to 2035
- 11.2.3 CAGR and Year-on-Year Growth
- 11.2.4 Incremental Revenue Opportunity
- 11.3 Forecast Assumptions and Scenario Analysis
- 11.3.1 Base-Case Forecast
- 11.3.2 Optimistic and Conservative Scenarios
- 11.3.3 Technology, Pricing and Policy Sensitivities
- 11.4 Market Attractiveness and Growth Outlook
Chapter 12 Italy Soy-Based Chemicals Market Segmentation and Outlook
- 12.1 Segmentation Summary and Market Shares, 2025
- 12.2 Largest and Fastest-Growing Segments
- 12.3 By Type - Market Size and Forecast, 2025-2035
- 12.3.1 Segment Definition and Scope
- 12.3.2 Historical Market Size, 2018-2025
- 12.3.3 Revenue Forecast, 2025-2035
- 12.3.4 Volume Forecast, 2025-2035
- 12.3.5 Base-Year Market Share, 2025
- 12.3.6 Segment CAGR and Growth Drivers
- 12.3.7 Subsegment Market Size and Forecast
- 12.3.7.1 Soy Oil
- 12.3.7.2 Soy Methyl Esters
- 12.3.7.3 Soy Fatty Acids
- 12.3.7.4 Soy-Based Polymers
- 12.3.7.5 Soy Wax
- 12.3.7.6 Others
- 12.3.8 Subsegment Pricing and Adoption Trends
- 12.3.9 Leading Suppliers and Competition
- 12.3.10 Regional Demand and Opportunities
- 12.4 By Application - Market Size and Forecast, 2025-2035
- 12.4.1 Segment Definition and Scope
- 12.4.2 Historical Market Size, 2018-2025
- 12.4.3 Revenue Forecast, 2025-2035
- 12.4.4 Volume Forecast, 2025-2035
- 12.4.5 Base-Year Market Share, 2025
- 12.4.6 Segment CAGR and Growth Drivers
- 12.4.7 Subsegment Market Size and Forecast
- 12.4.7.1 Industrial
- 12.4.7.2 Cosmetics & Personal Care
- 12.4.7.3 Food & Beverages
- 12.4.7.4 Pharmaceuticals
- 12.4.7.5 Agriculture
- 12.4.8 Subsegment Pricing and Adoption Trends
- 12.4.9 Leading Suppliers and Competition
- 12.4.10 Regional Demand and Opportunities
- 12.5 By End Use Industry - Market Size and Forecast, 2025-2035
- 12.5.1 Segment Definition and Scope
- 12.5.2 Historical Market Size, 2018-2025
- 12.5.3 Revenue Forecast, 2025-2035
- 12.5.4 Volume Forecast, 2025-2035
- 12.5.5 Base-Year Market Share, 2025
- 12.5.6 Segment CAGR and Growth Drivers
- 12.5.7 Subsegment Market Size and Forecast
- 12.5.7.1 Healthcare
- 12.5.7.2 Packaging
- 12.5.7.3 Construction
- 12.5.7.4 Automotive
- 12.5.7.5 Others
- 12.5.8 Subsegment Pricing and Adoption Trends
- 12.5.9 Leading Suppliers and Competition
- 12.5.10 Regional Demand and Opportunities
- 12.6 Segment Growth Comparison
- 12.7 Segment Attractiveness and Priority Matrix
Chapter 13 Italy Soy-Based Chemicals End-Use and Application Market Outlook
- 13.1 End-Use Industry and Customer Demand Structure
- 13.2 Leading Applications and Customer Groups
- 13.3 End-Use Market Size, Share and Forecast
- 13.4 Major End-Use Industry Deep Dives
- 13.4.1 Customer Requirements and Use Cases
- 13.4.2 Demand and Replacement Cycles
- 13.4.3 Technical and Regulatory Considerations
- 13.4.4 Purchasing and Procurement Models
- 13.4.5 Leading Vendors and Distribution Channels
- 13.4.6 Forecast and Commercial Opportunities
- 13.5 Emerging Applications and Cross-Segment Demand
- 13.6 End-Use Industry Investment Priorities
Chapter 14 Italy Soy-Based Chemicals Geographic Market Outlook, 2025-2035
- 14.1 Domestic Market Distribution and Demand Clusters
- 14.2 State- or Province-Wise Market Size and Forecast, 2025-2035
- 14.3 City and Metropolitan Market Outlook
- 14.4 Industrial, Manufacturing and Commercial Clusters
- 14.5 Geographic Concentration of Key End Users
- 14.6 Local Pricing and Purchasing Differences
- 14.7 Domestic Production Facilities and Capacity Map
- 14.8 Local Infrastructure and Project Pipeline
- 14.9 State-Level Policy and Incentive Differences
- 14.10 Subnational Investment Hotspots and Opportunities
- 14.11 Distribution and Logistics Networks
- 14.12 Domestic Competitive Footprint
Chapter 15 Italy Soy-Based Chemicals Technology, Innovation and Sustainability Outlook
- 15.1 Technology Landscape and Maturity
- 15.2 Product, Process and Service Innovation
- 15.3 AI, Automation and Digital Tools in the Industry
- 15.4 Technology Adoption and Performance Benchmarking
- 15.5 Innovation Pipeline and R&D Investment
- 15.6 Patent and Intellectual Property Trends
- 15.7 Energy Efficiency and Resource Management
- 15.8 Sustainability, Recycling and Circularity
- 15.9 Technology Roadmap, 2025-2035
- 15.10 Risks of Obsolescence and Technology Substitution
Chapter 16 Italy Soy-Based Chemicals Market Key Strategic Imperatives
- 16.1 Growth and Market Entry Priorities
- 16.2 High-Return Products and Segments
- 16.3 Pricing, Profitability and Cost Optimization
- 16.4 Technology Investment and Product Differentiation
- 16.5 Supply Chain Localization and Resilience
- 16.6 Distribution and Customer Acquisition
- 16.7 Partnership, Acquisition and Capacity Strategy
- 16.8 Regional Expansion Priorities
- 16.9 Short-, Medium- and Long-Term Actions
Chapter 17 Competition Outlook
- 17.1 Industry Competition Characteristics
- 17.2 Market Structure and Concentration
- 17.3 Market Share and Competitive Positioning, 2025
- 17.4 Company-Wise Revenue and Product Benchmarking
- 17.5 Production and Service Capacity Benchmarking
- 17.6 Technology, Pricing and Differentiation
- 17.7 Regional Footprint and Distribution Strength
- 17.8 Mergers, Acquisitions and Strategic Alliances
- 17.9 New Entrants and Competitive Threats
- 17.10 Porter's Five Forces and Industry Attractiveness
- 17.11 Competitive Outlook, 2025-2035
Chapter 18 Company Profiles
- 18.1 Company Coverage and Selection Criteria
- 18.2 Cereal Docks S.p.A.
- 18.2.1 Business Description
- 18.2.2 Company Ownership and Geographic Presence
- 18.2.3 Product and Service Portfolio
- 18.2.4 Manufacturing and Operating Footprint
- 18.2.5 Production Capacity and Expansion Plans
- 18.2.6 Financial Performance and Investment
- 18.2.7 Market Share and Competitive Position
- 18.2.8 Technology and Innovation Capabilities
- 18.2.9 Strategic Alliances or Partnerships
- 18.2.10 Recent Developments
- 18.2.11 Growth Strategy and Outlook
- 18.3 Bunge Global SA
- 18.4 Cargill, Incorporated
- 18.5 Archer Daniels Midland Company (ADM)
- 18.6 Other Relevant Market Participants
Note: Every listed company is profiled on the structure shown under the first company. The company list is preliminary and may change based on research findings, market developments, data availability and client requirements.
Chapter 19 Disclaimer
- 19.1 Research and Forecast Disclaimer
- 19.2 Data Source and Estimation Limitations
Note: The depth of individual sections depends on data availability for this market. Volume, capacity, trade and other unit-based metrics are included where applicable.

