
Halogen-free polymers now set the demand for this salt
The global calcium hypophosphite market was valued at USD 243.6 million in 2025 and is projected to increase from USD 257.0 million in 2026 to USD 416.1 million by 2035, registering a CAGR of 5.50% during 2026–2035. Demand comes mainly from compounders that use the salt as a halogen-free flame retardant in polyamide, polybutylene terephthalate, polycarbonate and polypropylene parts, with smaller volumes in pharmaceutical, veterinary, feed, food and corrosion-control uses. Asia Pacific held the largest regional share, 46.0% in 2025, and is also the fastest-growing region at 6.0% a year, because Chinese plants convert local yellow phosphorus into hypophosphite salts close to electronics and automotive compounders. European rules aimed at aromatic brominated flame retardants and the shift to high-voltage vehicle electronics favor phosphorus-based systems. Buyers now judge suppliers on thermal stability and safe handling, since the pure powder is flammable and regulated as a drug precursor in the United States.
What calcium hypophosphite does and which grades count
The estimate counts calcium hypophosphite, also called calcium phosphinate, sold in industrial, stabilized flame-retardant, pharmaceutical, food and reagent grades as powder, granules or crystals. The salt carries a high phosphorus content and stays stable at polymer processing temperatures, which is why compounders use it to pass flammability tests without halogens.
Sodium and aluminum hypophosphites, organic phosphinates and finished flame-retardant compounds sit outside the estimate, although they share feedstock and plants. Compounders buy flame-retardant grades on qualified annual contracts, while laboratories and drug makers buy small packs of extra pure material through catalog suppliers.

Calcium Hypophosphite Market Insights
- The market is valued at USD 243.6 million in 2025 and is projected to reach USD 416.1 million by 2035, growing at a 5.50% CAGR on halogen-free flame-retardant demand in engineering plastics.
- Asia Pacific led with 46.0% of 2025 value and grows fastest at 6.0% a year, as Chinese plants turn local yellow phosphorus into hypophosphite salts.
- Flame Retardants held 44.0% of 2025 value, because polyamide, polyester and polycarbonate compounders need a phosphorus additive that survives melt processing.
- Clariant completed a CHF 100 million phosphinate investment at Daya Bay, China, in October 2025, which signals heavier halogen-free demand from e-mobility parts.
- U.S. federal rules list hypophosphite salts as List I drug precursors with no threshold, so every non-retail sale carries record-keeping duties.
Flame-retardant industrial grades lead and grow fastest
Why do industrial grades lead and also grow fastest?
Based on grade, the market is categorized into industrial grade, pharmaceutical grade and food grade. Industrial Grade material led with 66.0% of 2025 value because flame-retardant compounders buy it by the ton, and Italmatch says its Phoslite range rests on calcium and aluminum hypophosphites patented in more than 30 countries. Industrial grade also grows fastest at 5.8% a year as stabilized and coated variants for polyester and polyamide take share. Pharmaceutical grade grows more slowly, because its buyers make established veterinary and nutritional products that rarely add volume, and extra pure lots sell in small catalog packs.
Why do flame retardants lead the application mix?
Based on application, the market is categorized into flame retardants, pharmaceuticals and veterinary, animal feed and agriculture, food additives, water treatment and corrosion control, and others. Flame Retardants led with 44.0% of 2025 value because compounders of polyamide 6, polybutylene terephthalate and polycarbonate buy the salt for its thermal stability, and Italmatch says it is the world's top supplier of inorganic phosphinate flame retardants. Flame retardants also grow fastest at 6.2% a year, as EU scrutiny of aromatic brominated additives and 800-volt vehicle electronics push compounders to qualify halogen-free phosphorus systems, the shift set out in the drivers.
Why does powder lead while granules grow fastest?
Based on form, the market is categorized into powder, granules and crystals. Powder held 72.0% of 2025 value because compounders disperse fine powder evenly in polymer melts, and most qualified flame-retardant specifications were written for powder feeds. Granules grow fastest at 6.5% a year as dust control becomes a buying criterion, a move toward safer blended formats described in the trends. Crystals stay a niche form, because most sodium hypophosphite makers that run the lime route convert the dissolved calcium salt with sodium carbonate rather than crystallizing it, so crystal lots sell mainly as small reagent packs, such as the 500 g reagent pack priced in the table below.
| Segment Group | Leading Sub-segment | Share, 2025 | Fastest-growing Sub-segment | CAGR, 2026–2035 |
|---|---|---|---|---|
| By Grade | Industrial Grade | 66.0% | Industrial Grade | 5.8% |
| By Application | Flame Retardants | 44.0% | Flame Retardants | 6.2% |
| By Form | Powder | 72.0% | Granules | 6.5% |
Yellow phosphorus and grade purity set the price ladder
Calcium hypophosphite prices start from the cost of yellow phosphorus, because about half a ton of the element goes into each ton of hypophosphite and part of it is lost as phosphine and phosphite. Chinese yellow phosphorus traded in a narrow band during 2025, which kept bulk offers steady. Bulk contract prices are not public, so the two bulk rows below are Credence Research estimates. Stabilized flame-retardant grades earn a clear premium for coating and qualification work, while catalog packs sell at many times the bulk price per kilogram, which is where reagent suppliers make most of their margin.
| Grade or reference | Typical price or fee | Basis |
|---|---|---|
| Yellow phosphorus feedstock, China | RMB 21,000 to 24,000 per metric ton | Credence Research compilation of Chinese spot quotes, 2025 range |
| Industrial grade, bulk | About USD 2,500-3,500 per metric ton | Credence Research estimate from phosphorus, lime and conversion cost |
| Stabilized flame-retardant grade, bulk | About USD 5,000-8,000 per metric ton | Credence Research estimate from grade premiums |
| Reagent grade, 98.0% or more, 500 g | JPY 7,400 per pack | FUJIFILM Wako list price, November 2026 |
Request a Free Sample
Fill in your details and we'll send you a free sample report.
- Sample data tables & charts
- Research methodology
Bromine curbs and 800 V electronics lift phosphinate use
European curbs on brominated additives favor phosphorus systems
Regulatory pressure on halogenated flame retardants is the main reason compounders qualify hypophosphite salts. The European Chemicals Agency identified aromatic brominated flame retardants as candidates for an EU-wide restriction on March 15, 2023, and it found little or no hazard for several non-halogenated subgroups. The EU Council backed a global listing of Dechlorane Plus, a chlorinated additive, in an April 25, 2023 decision for the Stockholm Convention. Suppliers of qualified phosphinate grades gain when brand owners redesign parts ahead of these rules. Because a group restriction covers a whole class of additives rather than one substance, compounders cannot simply swap one brominated product for another and must requalify parts with different chemistry, work that usually starts years before a rule takes effect.
High-voltage vehicle electronics need heat-stable additives
The shift to 800-volt vehicle and charging systems raises demand for flame-retardant polyesters and polyamides that keep electrical insulation at high temperatures. Clariant completed a CHF 100 million investment at its Daya Bay site in China in October 2025, with a second line due to run fully in November 2025, and aimed new Exolit OP grades at PBT parts in 800-volt e-mobility systems. These organic phosphinates compete with the calcium salt, but they confirm that electric vehicle connectors are moving to phosphorus chemistry, which widens the pool of compounders that test inorganic hypophosphites. Clariant also said its halogen-free grades need no fluorinated polymers such as PTFE, a selling point for phosphorus systems as PFAS rules tighten.
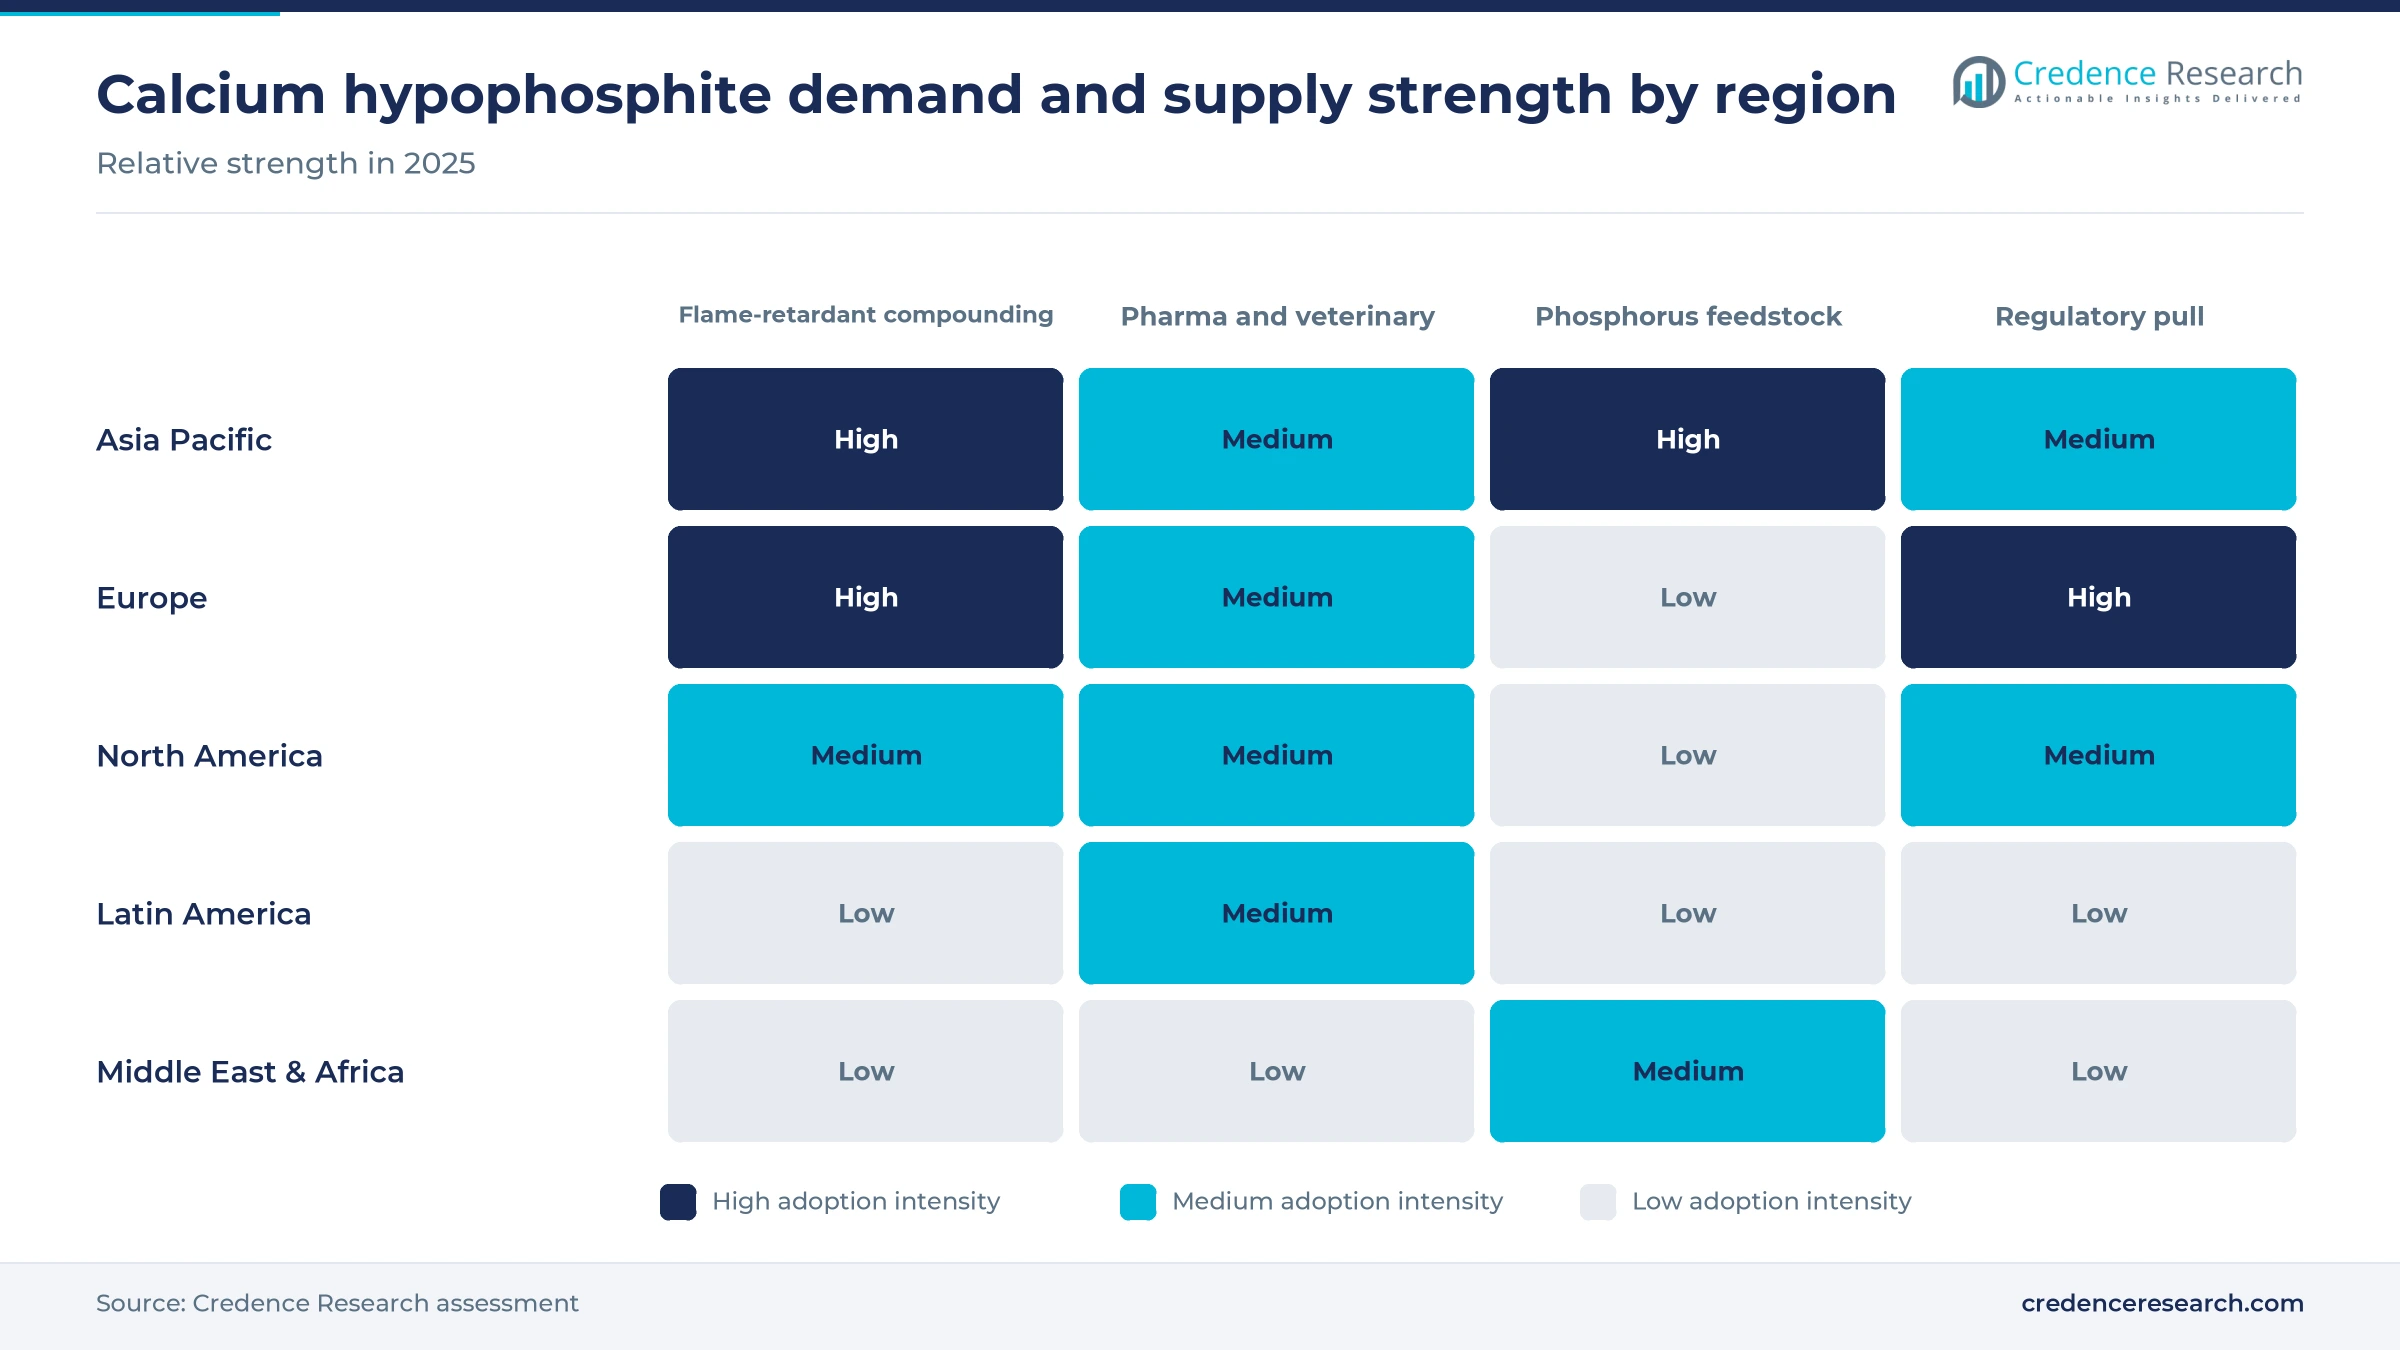
Thermal stability keeps the salt in engineering plastics
Calcium hypophosphite holds its place in engineering plastics because it survives the melt temperatures of polyamide and polyester processing better than many phosphorus additives. Italmatch says in its Phoslite technology review that the salt carries about 37% phosphorus with exceptional thermal stability and is fully colorable, while its aluminum sibling carries 42% phosphorus with lower water solubility. Italmatch lists polypropylene, polycarbonate, TPU and glass-filled polyamide 6 and PBT as the main applications of its hypophosphite-based Phoslite grades. Italmatch also markets the range as an antimony trioxide replacement. Compounders that need colorable parts for polybutylene terephthalate housings get a clear reason to specify the calcium salt.
Veterinary and nutrition uses add a steady specialty outlet
Veterinary and nutrition products give the market a small but steady demand base that does not track the plastics cycle. Health Canada lists calcium hypophosphite as an approved ingredient name in its natural health products database, and feed formulators buy it as a calcium and phosphorus source in feed additives. Its phosphorus content of about 37%, the figure Italmatch reports, lets formulators supply phosphorus at a small dose. These buyers requalify a source only when a registration changes. Solstice Advanced Materials lists an extra pure grade at 98.0% to 100.5% assay for pharmaceutical antioxidant and analytical use, and American Elements offers food, agricultural and pharmaceutical grades tested to USP and EP/BP standards. Suppliers with audited pharmaceutical grades keep this outlet, because formulators rarely change a registered ingredient source.
Safer powders, Chinese phosphorus and antimony-free blends
Suppliers shift toward safer, non-flammable powder blends
Flame-retardant suppliers are shifting toward pre-blended and treated powders to address the handling risk of the pure salt, creating openings for granules and masterbatches across compounding lines. Italmatch notes that pure calcium and aluminum hypophosphites are flammable powders subject to ADR transport rules. The company was granted U.S. patent 12,031,081 on July 9, 2024, from an April 2019 priority filing, covering hypophosphite powders mixed with aluminum phosphorus salts so the blend is no longer flammable. The patent also states that calcium and sodium hypophosphites are made by reacting the metal hydroxide with yellow phosphorus. Granules, the form these blends favor, grow fastest at 6.5% a year. Producers that can ship safer blends cut freight and storage costs for compounders and make qualification easier, which favors integrated suppliers over traders.
Antimony export controls push polyester makers to rethink synergists
Polyester and polyamide compounders are shifting away from antimony trioxide, the usual partner of brominated flame retardants, as supply of the metal tightens. China's Ministry of Commerce issued Announcement No. 33 on Aug. 15, 2024, placing antimony ore, metal and oxides under export control from Sept. 15, 2024. Clariant said in October 2025 that its halogen-free, antimony-free grades protect users from antimony trioxide price swings. Italmatch's 2024 U.S. patent cites earlier filings for antimony-free polyester compositions that combine calcium hypophosphite with brominated polymers, which shows the salt can serve as a bridge before fully halogen-free designs. Compounders outside China gain the most from these substitutions, since they face the export licenses.
Halogen-free connector and housing redesigns open qualification slots
Redesigns of connectors, housings and charging parts create an opening for calcium hypophosphite suppliers that can pass UL 94 and comparative tracking tests. Envalior lists its new PBT at UL 94 V-0 at 0.75 mm with a CTI of 600, which sets the bar a phosphorus additive must help reach in thin walls. Pinfa reported polymeric phosphorus and nitrogen systems for V-0 polyamide in November 2024, showing that compounders keep testing new combinations. Industrial grade, which leads with 66.0% of 2025 value, is the base for these coated variants. Suppliers that co-develop formulations with compounders, rather than selling powder alone, can lock in multiyear part qualifications.
Continuous reactors open room for lower-cost hypophosphite output
Chinese producers create an opening for lower conversion costs by moving hypophosphite synthesis from batch kettles to continuous reactors. Hubei Jixing Chemical filed an environmental assessment in August 2023 for a 6 million yuan continuous reaction tower rated at 6,000 tons a year at its 20,000-ton sodium hypophosphite site in Yichang. The tower reacts yellow phosphorus with caustic soda and lime and burns the phosphine tail gas into phosphoric acid. The same chemistry, with lime alone, yields the calcium salt, so the process gains carry across. Producers that adopt continuous lines can offer steadier quality and lower phosphine losses, an advantage for buyers of flame-retardant grades.
Precursor rules, flammable dust and phosphorus costs weigh
U.S. precursor rules add compliance cost to every sale
U.S. drug precursor controls are a direct cost for sellers and buyers. Federal rules at 21 CFR 1310.04 list hypophosphorous acid and its salts, including calcium hypophosphite, among List I chemicals for which no threshold has been set, so every non-retail transaction carries registration and record-keeping duties. Small distributors and laboratories face the heaviest burden, because the paperwork costs the same for a trial sample as for a bulk lot, which slows material trials by U.S. compounders and university groups.
Flammable dust and phosphine risks limit plant siting
Plant safety rules limit who can make and handle the salt. Production releases phosphine, a toxic and pyrophoric gas, and Hubei Jixing's August 2023 filing shows that tail gas must be burned and absorbed before release. The flammable-powder classification noted in the trends adds transport and storage costs for every shipment. New producers outside existing phosphorus chemical parks face long permitting, and compounders without dust-control systems may prefer blended products over neat powder.
Organic phosphinates compete for the same polymer parts
Aluminum diethylphosphinate and other organic phosphinates compete directly with calcium hypophosphite in polyamide and PBT. Clariant's Daya Bay investment noted in the drivers, completed in October 2025, adds capacity for its Exolit OP range aimed at the same e-mobility parts. Calcium salt suppliers are most exposed in glass-filled polyamide for connectors, where organic grades already hold specifications, and they must compete on cost per flammability rating rather than on phosphorus content alone.
Yellow phosphorus depends on Chinese energy and ore supply
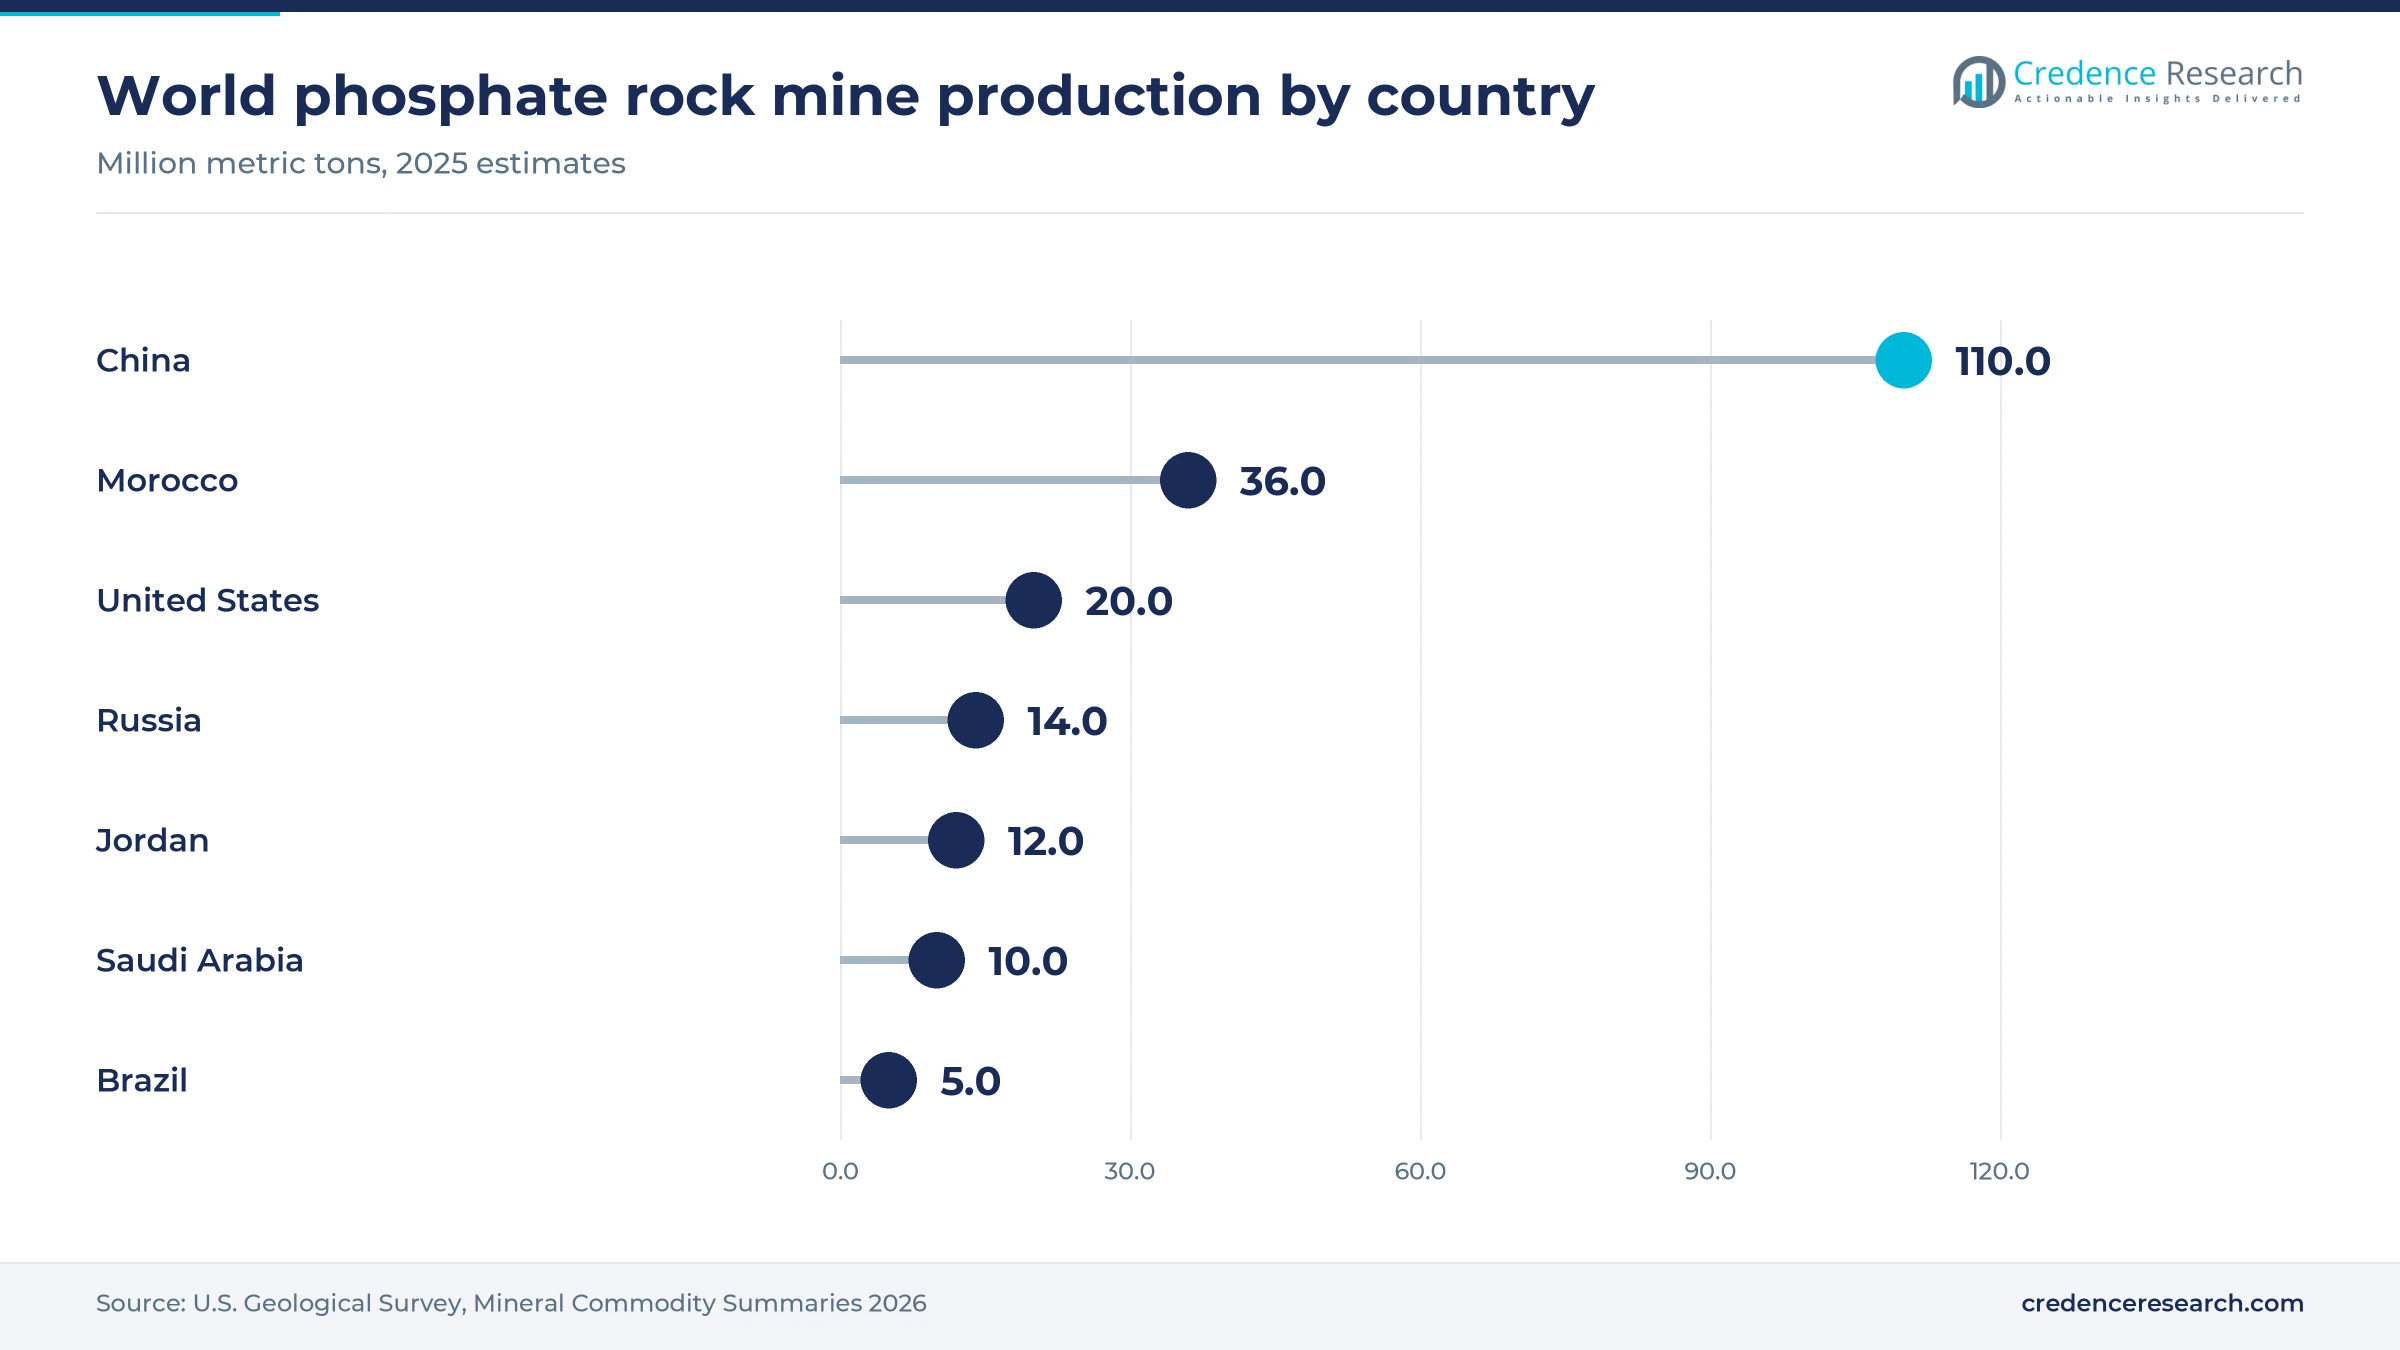
Feedstock concentration exposes the market to Chinese energy and mining policy. China mined about 110 million metric tons of the world's 250 million tons of phosphate rock in 2025, according to the U.S. Geological Survey, and elemental phosphorus outside China mostly serves glyphosate production. Non-Chinese compounders that rely on imported salt face the greatest risk if power curbs or export rules cut phosphorus output, while integrated Chinese producers can absorb swings.
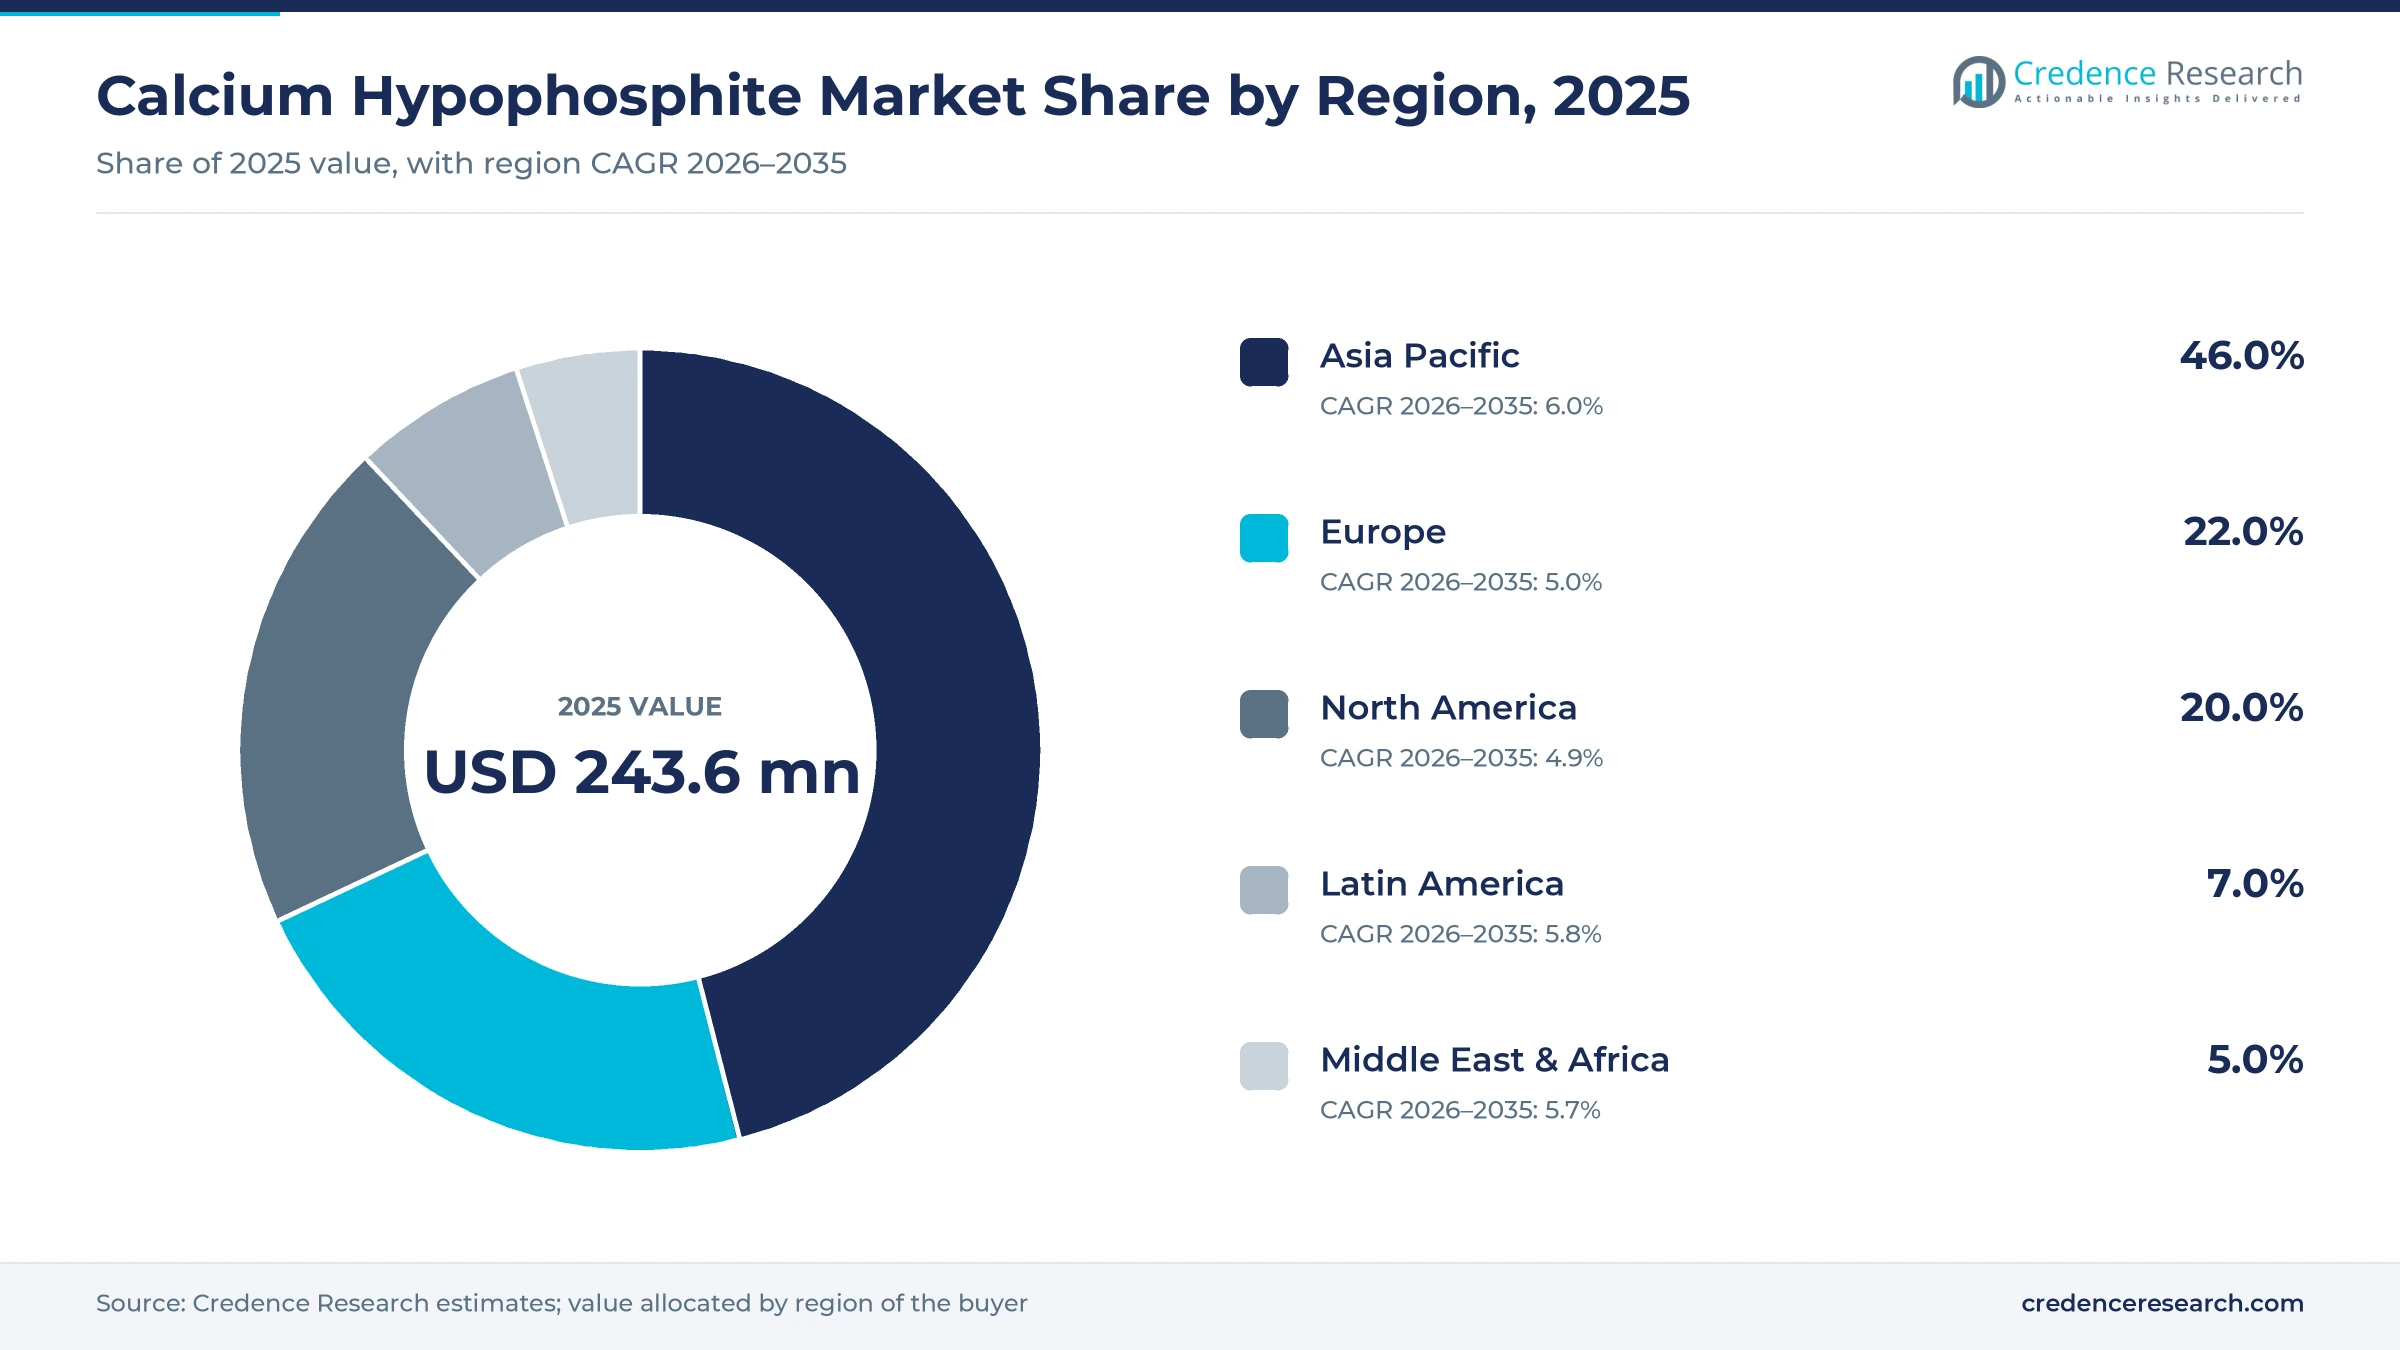
Asia Pacific leads on Chinese yellow phosphorus chains
| Region | Value, 2025 (USD million) | Share, 2025 | CAGR, 2026–2035 |
|---|---|---|---|
| Asia Pacific | 112.1 | 46.0% | 6.0% |
| Europe | 53.6 | 22.0% | 5.0% |
| North America | 48.7 | 20.0% | 4.9% |
| Latin America | 17.1 | 7.0% | 5.8% |
| Middle East & Africa | 12.2 | 5.0% | 5.7% |
Asia Pacific leads on Chinese yellow phosphorus chains
Asia Pacific held 46.0% of 2025 value and grows fastest at 6.0% a year, because China combines phosphate rock, yellow phosphorus, hypophosphite plants and large electronics compounding. Changshu New-Tech Chemicals in Jiangsu lists 15,000 tons of sodium hypophosphite and 10,000 tons of flame retardants and other hypophosphites a year. Italmatch makes hypophosphite flame retardants at its Nantong plant in Rugao. Japan adds reagent and specialty demand through FUJIFILM Wako, which lists a 98.0% grade, although no public data separate Japanese tonnage.
Europe draws on Italian know-how and EU chemical rules
Europe held 22.0% of 2025 value and grows at 5.0% a year, because demand rests on automotive and electrical compounders that redesign parts under EU chemical rules rather than on local phosphorus supply. Italmatch reports in its 2024 sustainability report, published in April 2025, that it leads world supply of inorganic phosphinate flame retardants. No large EU yellow phosphorus producer was identified in this review, so European compounders likely rely on Chinese salt or feedstock, which keeps price and lead-time risk higher than in Asia.
North America buys qualified grades under precursor rules
North America held 20.0% of 2025 value and grows at 4.9% a year, the slowest rate, because List I controls add cost to every sale and no U.S. producer of the salt was identified in this review. Demand centers on engineering plastics compounders, reagent buyers and veterinary products, where Canada's health products database already lists the salt. U.S. phosphate rock output of about 20 million tons in 2025 mostly feeds fertilizer, so the region imports most of its calcium hypophosphite.
Latin America grows on imported salt for feed and plastics
Latin America held 7.0% of 2025 value and grows at 5.8% a year, because Brazil's feed, veterinary and appliance industries import the salt rather than make it. No regional producer or reliable trade series for the salt was identified, so local demand is inferred from feed and appliance output. Brazil mined about 5 million tons of phosphate rock in 2025, which serves fertilizer rather than hypophosphite output, so this share carries a wide error range.
Middle East & Africa holds rock but little conversion
Middle East & Africa held 5.0% of 2025 value and grows at 5.7% a year, because the region mines large volumes of phosphate rock but converts little into hypophosphite. Morocco, Jordan and Saudi Arabia mined about 36, 12 and 10 million tons in 2025, mostly for fertilizer. Demand is thought to come from electrical compounders and veterinary products, but no regional producer or usage data were identified, so the estimate rests on import patterns and carries a wide error range.
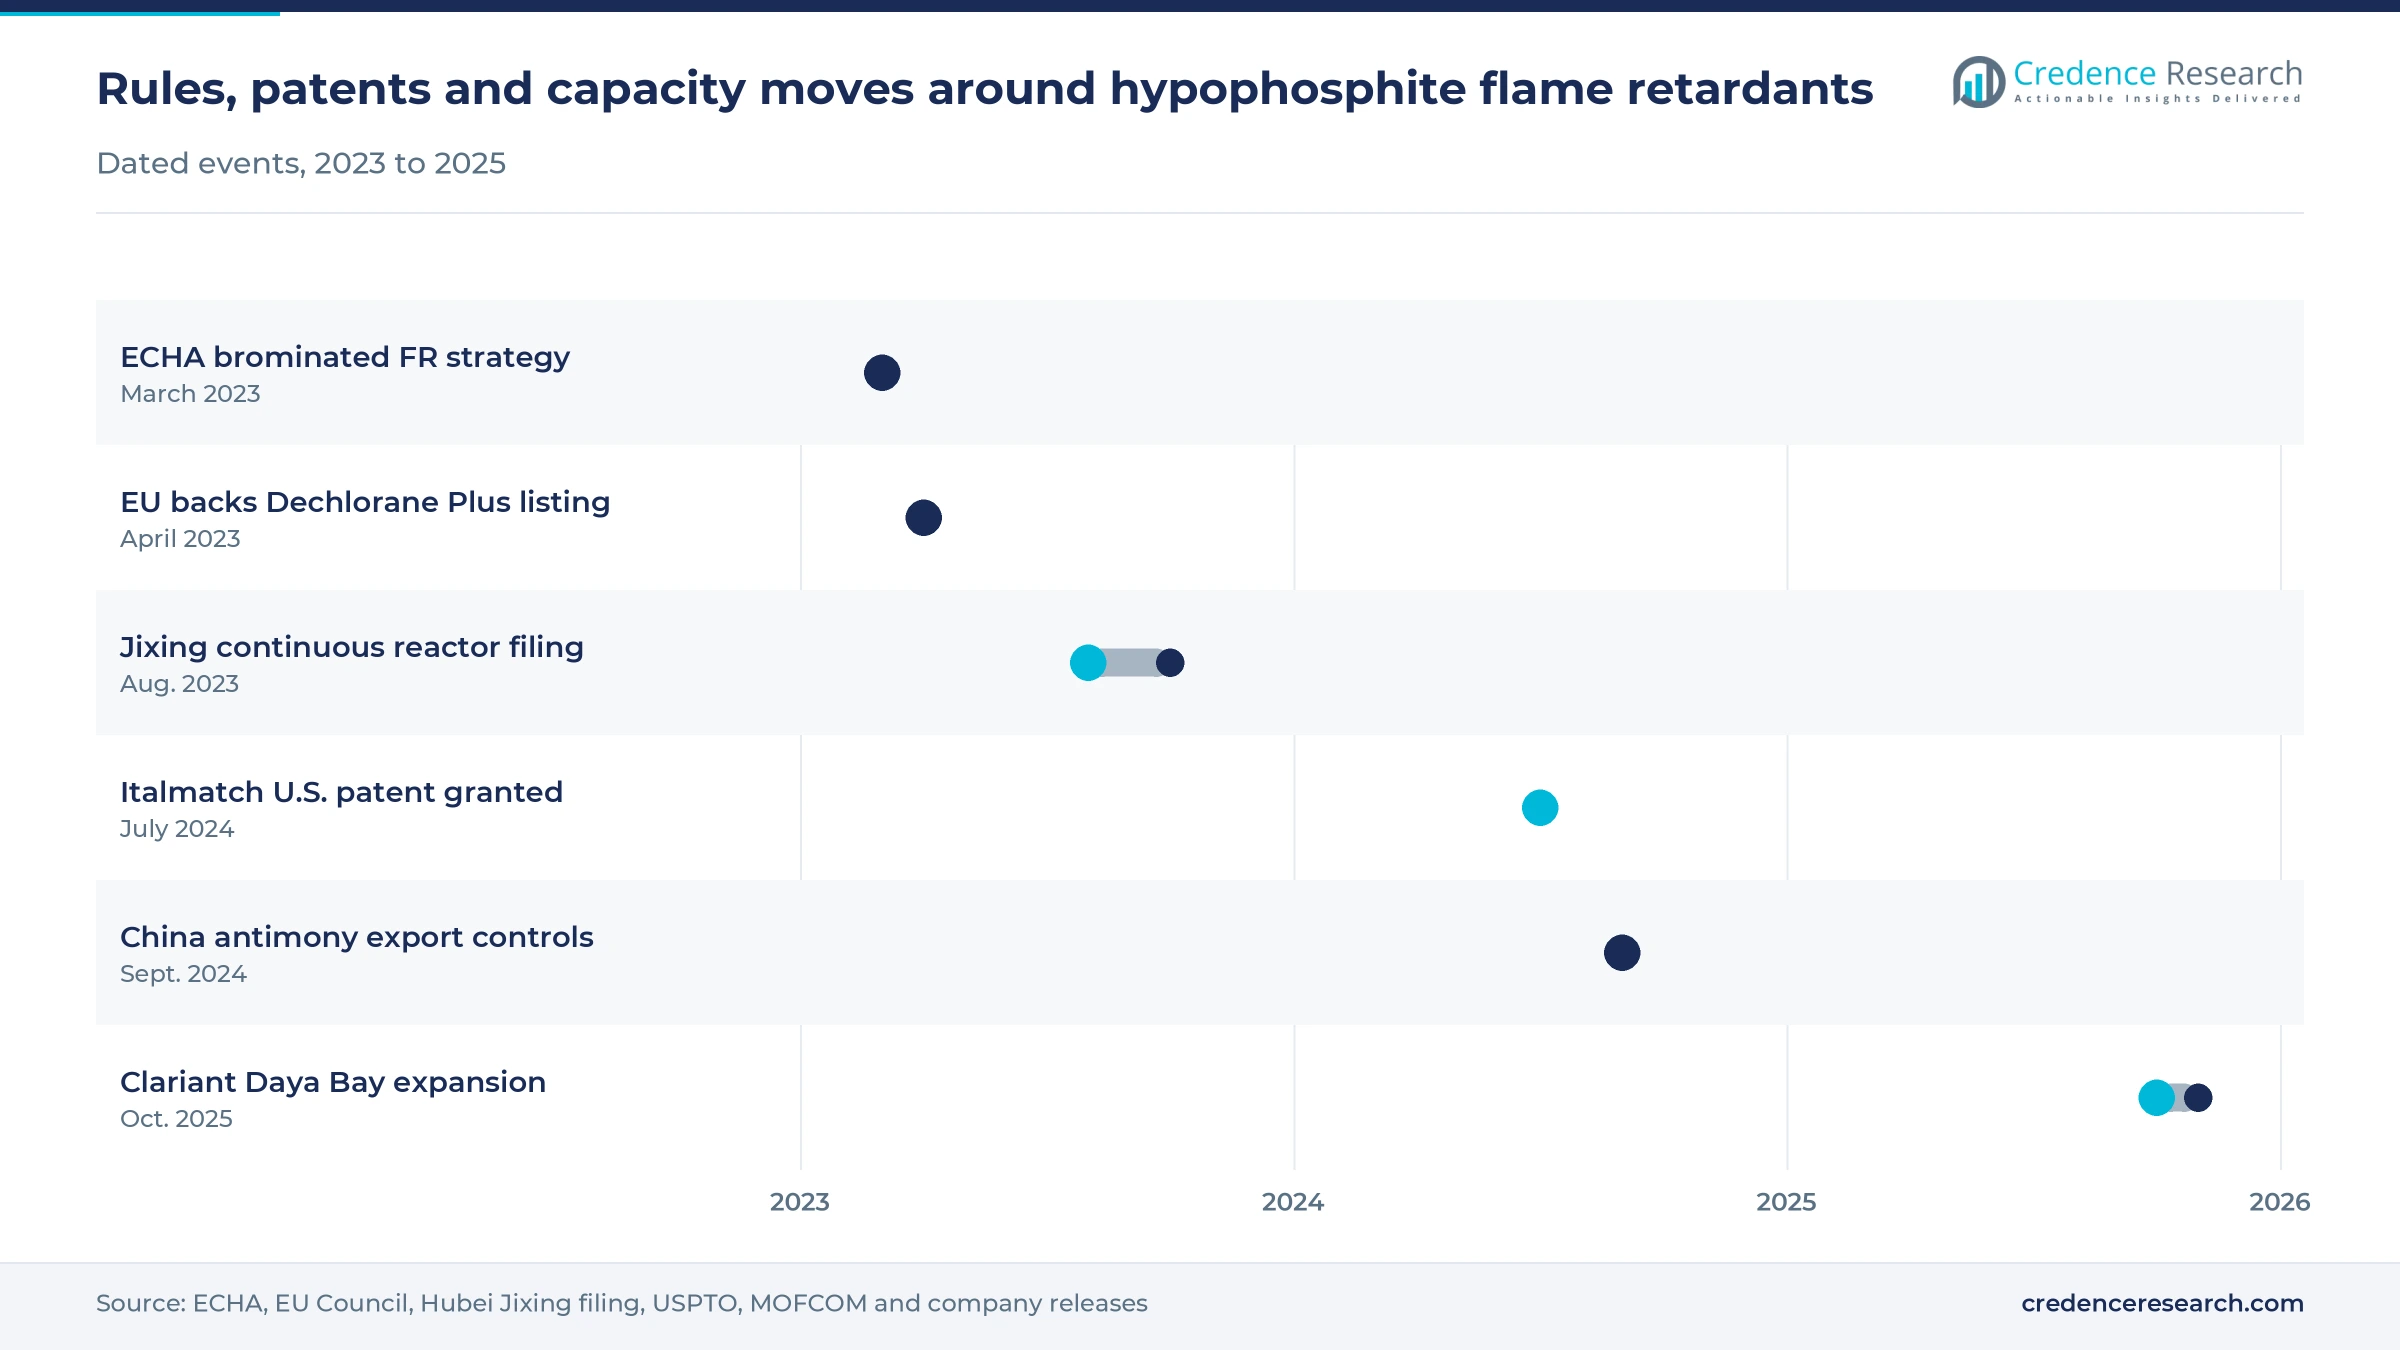
Capacity, patents and rule changes marked 2023 to 2025
| Development | Status and market relevance |
|---|---|
| In March 2023, the European Chemicals Agency identified aromatic brominated flame retardants as candidates for an EU-wide restriction. | Regulatory strategy, preparatory stage; it signals future limits that favor phosphorus systems in electrical parts. |
| In August 2023, Hubei Jixing Chemical published an environmental assessment for a 6,000-ton continuous hypophosphite reaction tower in Yichang. | Plan under environmental review; it tests continuous synthesis that can cut conversion cost for hypophosphite salts. |
| In July 2024, Italmatch Chemicals was granted a U.S. patent for non-flammable hypophosphite powder blends used as flame retardants. | Patent granted; it protects safer powder formats that ease transport and handling for compounders. |
| In August 2024, China's Ministry of Commerce announced export controls on antimony products, effective Sept. 15, 2024. | Regulation in force; it raises the cost of antimony synergists and supports antimony-free flame-retardant designs. |
| In October 2025, Clariant completed a CHF 100 million investment at Daya Bay, China, for its Exolit flame retardants. | Completed investment, with a second line due to run fully in November 2025; it adds competing phosphinate capacity. |
Phosphorus, lime and stabilization steps shape cost
- Phosphorus and lime reaction reacts yellow phosphorus with a lime slurry, which forms the soluble hypophosphite together with insoluble calcium phosphite and phosphine gas.
- Phosphine treatment burns and absorbs the tail gas into phosphoric acid, which Hubei Jixing's 2023 filing shows is a required unit of any hypophosphite plant.
- Filtration and crystallization removes calcium phosphite and excess lime, then evaporates the solution to crystals, and sodium salt makers add sodium carbonate at this stage to convert the calcium salt.
- Stabilization and coating treats or blends the dry salt for polymer use, so flame-retardant grades resist moisture and dust ignition during compounding.
Need a Custom Version of This Report?
Tailor the scope, geography, or segments to your exact requirements.
- Custom geography or segment scope
- Direct access to our analyst team
A few integrated makers face many catalog sellers
Competition in this market turns on phosphorus integration, flame-retardant formulation and compliance rather than on list price alone. Italmatch leads flame-retardant grades through its Phoslite patents and its hypophosphite line in Nantong. Chinese hypophosphite makers such as Changshu New-Tech, which lists sodium and other hypophosphite lines in Jiangsu, sit close to electronics compounders, but public product data do not confirm which of them sell the calcium salt. Solstice Advanced Materials, the 2025 spin-off of Honeywell's advanced materials business, FUJIFILM Wako, Thermo Fisher Scientific and American Elements sell extra pure and reagent grades in small packs. Clariant sells organic phosphinates and Envalior sells finished compounds, so both shape demand but are not profiled as calcium salt suppliers. Several names on the earlier list were traders or could not be confirmed as sellers and were removed. The five companies profiled below sell calcium hypophosphite to buyers.
How is the supply side organized and where do margins sit?
The supply side of this market is organized in three distinct layers. Chinese phosphorus chemical makers such as Hubei Jixing convert yellow phosphorus into hypophosphite salts in chemical parks, where permits are hard to obtain. Specialty producers such as Italmatch turn the salt into stabilized flame-retardant grades, where formulation know-how and patents earn the best margins. Catalog suppliers such as Solstice Advanced Materials, FUJIFILM Wako, Thermo Fisher Scientific and American Elements sell small packs at high prices per kilogram. Entry barriers sit in phosphine handling, chemical park permits and precursor compliance.
Companies profiled and their roles in this market
| Company | Type | Role in the market |
|---|---|---|
| Italmatch Chemicals S.p.A. | Specialty producer | Makes Phoslite hypophosphite flame retardants for polyamide, PBT and polycarbonate compounds |
| Solstice Advanced Materials | High-purity chemicals supplier | Sells extra pure calcium hypophosphite for pharmaceutical and analytical use |
| FUJIFILM Wako Pure Chemical Corporation | Reagent supplier | Sells 98.0% calcium hypophosphite reagent grade in Japan and Asia |
| Thermo Fisher Scientific Inc. | Reagent supplier | Sells calcium hypophosphite powder in laboratory packs under Thermo Scientific |
| American Elements | Specialty materials supplier | Supplies calcium hypophosphite in reagent, food, pharmaceutical and high-purity grades |
Stabilized flame-retardant grades decide margins
Credence Research's view is that stabilized flame-retardant grades, not commodity tonnage, will decide which suppliers earn margin in this market. EU rules and high-voltage designs are moving compounders to phosphorus systems, but organic phosphinates compete hard for the same parts. Producers that pair Chinese phosphorus access with safer powder formats and joint formulation work are best placed. Buyers outside China should qualify a second source and budget for precursor compliance in the United States, where every sale is recorded.
Earlier estimate rolled forward and checked on tonnage
The report uses 2025 as the base year and forecasts to 2035. The earlier Credence Research estimate for 2024 was rolled forward one year at its own growth rate and tested against an estimate of merchant tonnage multiplied by bulk and flame-retardant grade prices, plus reagent, pharmaceutical and veterinary grades valued at listed prices. Regional and segment shares are Credence Research estimates based on phosphorus supply, plant locations and end-use evidence. Sources include the U.S. Geological Survey, the Code of Federal Regulations, the European Chemicals Agency, company releases, patents, environmental filings and catalogs. No interviews or surveys were conducted for this update of the estimate.
Electronics compounds carry growth through 2035
Growth to 2035 depends on how many electrical and automotive parts move to halogen-free systems and how much of that volume the calcium salt wins. The base case assumes steady Chinese phosphorus supply and continued redesigns under EU rules, so flame-retardant grades keep gaining share. Granules and blended powders should grow faster than neat powder as compounders tighten dust control. Pharmaceutical, food and veterinary uses should grow slowly, and North America will stay import-dependent under precursor rules.
Halogen-free redesigns decide the range of outcomes
The spread of outcomes depends mainly on how fast EU rules and high-voltage designs move compounders away from brominated systems, and on whether calcium salt suppliers win those parts against organic phosphinates. A tighter Chinese phosphorus supply would raise costs for everyone, while faster qualification of safer granules would lift the flame-retardant share above the base case.
| Scenario | CAGR, 2026–2035 | Value, 2035 | What has to hold |
|---|---|---|---|
| Downside | 4.0% | USD 365.8 million | Organic phosphinates win most connector specifications and phosphorus costs rise |
| Base | 5.50% | USD 416.1 million | Halogen-free redesigns continue and Chinese phosphorus supply stays steady |
| Upside | 6.7% | USD 460.7 million | EU restriction is adopted and safer granules win polyamide and PBT parts |
Frequently Asked Questions
How big is the calcium hypophosphite market?
What is calcium hypophosphite used for?
Which application holds the largest share?
What does a calcium hypophosphite production plant need?
Which region leads the market?
Is calcium hypophosphite regulated in the United States?
What restrains the calcium hypophosphite market?
Who are the main calcium hypophosphite suppliers?
Table of Content
Chapter 1 Market Segmentation
- 1.1 Segmentation Framework
- 1.1.1 Product and Service Classification
- 1.1.2 Application and End-Use Classification
- 1.1.3 Technology and Solution Classification
- 1.1.4 Customer and Distribution Channel Classification
- 1.1.5 Geographic Segmentation
- 1.1.6 Market Segment Definitions and Boundaries
- 1.2 By Grade
- 1.2.1 Industrial Grade
- 1.2.2 Pharmaceutical Grade
- 1.2.3 Food Grade
- 1.3 By Application
- 1.3.1 Flame Retardants
- 1.3.2 Pharmaceuticals and Veterinary
- 1.3.3 Animal Feed and Agriculture
- 1.3.4 Food Additives
- 1.3.5 Water Treatment and Corrosion Control
- 1.3.6 Others
- 1.4 By Form
- 1.4.1 Powder
- 1.4.2 Granules
- 1.4.3 Crystals
Chapter 2 Introduction
- 2.1 Report Objectives and Scope
- 2.2 Product Definition and Industry Terminology
- 2.3 Market Inclusions and Exclusions
- 2.4 Research Process
- 2.4.1 Primary Research and Expert Interviews
- 2.4.2 Secondary Research and Source Review
- 2.4.3 Top-Down and Bottom-Up Estimation
- 2.4.4 Data Triangulation and Verification
- 2.5 Market Size Measurement Basis
- 2.5.1 2025: USD 243.6 million → 2035: USD 416.1 million
- 2.6 Historical and Forecast Reference Periods
- 2.6.1 Historical Period: 2018-2025
- 2.6.2 Base Year: 2025
- 2.6.3 Forecast Period: 2025-2035
- 2.7 Research Assumptions and Limitations
Chapter 3 Executive Summary
- 3.1 Market Snapshot and Key Findings
- 3.2 Base-Year Market Size, 2025
- 3.3 Forecast Market Size, 2035
- 3.4 Revenue and Volume Growth Outlook
- 3.5 Key Demand and Supply Indicators
- 3.6 Leading Market Segments
- 3.7 Fastest-Growing Market Opportunities
- 3.8 Regional Performance Highlights
- 3.9 Technology and Industry Transformation
- 3.10 Competitive Landscape Summary
- 3.11 Analyst View and Strategic Implications
Chapter 4 Global Calcium Hypophosphite Market Trends and Developments
- 4.1 Historical Industry Development, 2018-2025
- 4.2 Recent Market Trends and Developments
- 4.3 Demand and Customer Behavior Trends
- 4.4 Technology and Product Innovation
- 4.5 Artificial Intelligence, Automation and Digitalization
- 4.6 Local Manufacturing and Supply Chain Realignment
- 4.7 Industry Partnerships, Mergers and Acquisitions
- 4.8 Sustainability and Circular Economy Developments
- 4.9 Government and Private Sector Investment Trends
- 4.10 Emerging Business Models and Commercialization
- 4.11 Industry Developments and Announcements
Chapter 5 Global Calcium Hypophosphite Market Production, Supply and Demand Analysis
- 5.1 Demand Trend and Consumption Analysis, 2018-2025
- 5.2 Demand Forecast, 2025-2035
- 5.3 Production and Output Trend, 2018-2025
- 5.4 Production and Output Forecast, 2025-2035
- 5.5 Installed Capacity and Capacity Utilization
- 5.6 Company-Wise Production Plants and Statistics
- 5.6.1 Installed Production Capacity
- 5.6.2 Actual Production
- 5.6.3 Planned Capacity and Expansion Targets
- 5.7 Supply Chain Structure and Procurement Trends
- 5.8 Supply-Demand Gap and Bottlenecks
- 5.9 Import Dependence and Sourcing Structure
- 5.10 Contract Manufacturing and Outsourcing
- 5.11 Regional Supply and Demand Concentration
Chapter 6 Global Calcium Hypophosphite Market Pricing Analysis
- 6.1 Pricing Structure and Measurement
- 6.2 Historical Pricing Trends, 2018-2025
- 6.3 Pricing Outlook, 2025-2035
- 6.4 Average Selling Price and Unit Economics
- 6.5 Pricing by Product and Market Segment
- 6.6 Geographic Pricing Differences
- 6.7 Key Input, Energy, Labor and Logistics Costs
- 6.8 Contract Pricing and Purchasing Models
- 6.9 Pricing Sensitivity and Competitive Positioning
- 6.10 Price, Margin and Profitability Implications
Chapter 7 Global Calcium Hypophosphite Market Dynamics
- 7.1 Market Growth Drivers
- 7.1.1 Demand-Side Drivers
- 7.1.2 Technology and Innovation Drivers
- 7.1.3 Infrastructure and Investment Drivers
- 7.1.4 Regulatory and Policy Drivers
- 7.2 Market Restraints
- 7.2.1 Cost and Affordability Constraints
- 7.2.2 Technology and Adoption Barriers
- 7.2.3 Supply Chain and Operational Constraints
- 7.3 Market Challenges
- 7.3.1 Competitive Pressure and Margin Erosion
- 7.3.2 Skills, Infrastructure and Implementation Gaps
- 7.4 Emerging Market Opportunities
- 7.5 Market Dynamics Impact and Time-Horizon Assessment
Chapter 8 Global Calcium Hypophosphite Value Chain Analysis
- 8.1 Industry Value Chain Overview
- 8.2 Upstream Suppliers and Critical Inputs
- 8.3 Technology and Component Providers
- 8.4 Manufacturing or Service Delivery
- 8.5 Distribution, Channel Partners and Integrators
- 8.6 Downstream Applications and End Users
- 8.7 Value Addition and Profit Pools
- 8.8 Vertical Integration and Outsourcing
- 8.9 Supplier Concentration and Risk
- 8.10 Supply Chain Localization and Resilience
Chapter 9 Global Calcium Hypophosphite Market Regulations and Policies
- 9.1 Relevant Laws, Standards and Compliance Frameworks
- 9.2 Product, Service, Safety and Quality Requirements
- 9.3 Government Policies, Incentives and Subsidies
- 9.4 Imports, Exports and Trade Barriers
- 9.5 Public Procurement and Local Content Requirements
- 9.6 Environmental and Sustainability Compliance
- 9.7 Upcoming Policy Changes and Market Implications
Chapter 10 Global Calcium Hypophosphite Market Hotspots and Opportunities
- 10.1 Market Opportunity Mapping and Growth Hotspots
- 10.2 High-Growth Applications and Customer Groups
- 10.3 Underserved Markets and White-Space Opportunities
- 10.4 Emerging Technology and Product Opportunities
- 10.5 New Capacity and Investment Hotspots
- 10.6 Market Entry and Expansion Opportunities
- 10.7 Distribution and Partnership Opportunities
- 10.8 Near-Term and Long-Term Commercial Potential
- 10.9 Opportunity Attractiveness and Execution Risks
Chapter 11 Global Calcium Hypophosphite Market Outlook, 2025-2035
- 11.1 Market Size and Analysis
- 11.1.1 Revenue (Market Measurement: 2025: USD 243.6 million → 2035: USD 416.1 million)
- 11.1.2 Market Volume and Quantity Sold
- 11.1.3 Historical Market Size, 2018-2025
- 11.1.4 Base-Year Market Size, 2025
- 11.2 Market Forecast, 2025-2035
- 11.2.1 Revenue Forecast to 2035
- 11.2.2 Volume Forecast to 2035
- 11.2.3 CAGR and Year-on-Year Growth
- 11.2.4 Incremental Revenue Opportunity
- 11.3 Forecast Assumptions and Scenario Analysis
- 11.3.1 Base-Case Forecast
- 11.3.2 Optimistic and Conservative Scenarios
- 11.3.3 Technology, Pricing and Policy Sensitivities
- 11.4 Market Attractiveness and Growth Outlook
Chapter 12 Global Calcium Hypophosphite Market Segmentation and Outlook
- 12.1 Segmentation Summary and Market Shares, 2025
- 12.2 Largest and Fastest-Growing Segments
- 12.3 By Grade - Market Size and Forecast, 2025-2035
- 12.3.1 Segment Definition and Scope
- 12.3.2 Historical Market Size, 2018-2025
- 12.3.3 Revenue Forecast, 2025-2035
- 12.3.4 Volume Forecast, 2025-2035
- 12.3.5 Base-Year Market Share, 2025
- 12.3.6 Segment CAGR and Growth Drivers
- 12.3.7 Subsegment Market Size and Forecast
- 12.3.7.1 Industrial Grade
- 12.3.7.2 Pharmaceutical Grade
- 12.3.7.3 Food Grade
- 12.3.8 Subsegment Pricing and Adoption Trends
- 12.3.9 Leading Suppliers and Competition
- 12.3.10 Regional Demand and Opportunities
- 12.4 By Application - Market Size and Forecast, 2025-2035
- 12.4.1 Segment Definition and Scope
- 12.4.2 Historical Market Size, 2018-2025
- 12.4.3 Revenue Forecast, 2025-2035
- 12.4.4 Volume Forecast, 2025-2035
- 12.4.5 Base-Year Market Share, 2025
- 12.4.6 Segment CAGR and Growth Drivers
- 12.4.7 Subsegment Market Size and Forecast
- 12.4.7.1 Flame Retardants
- 12.4.7.2 Pharmaceuticals and Veterinary
- 12.4.7.3 Animal Feed and Agriculture
- 12.4.7.4 Food Additives
- 12.4.7.5 Water Treatment and Corrosion Control
- 12.4.7.6 Others
- 12.4.8 Subsegment Pricing and Adoption Trends
- 12.4.9 Leading Suppliers and Competition
- 12.4.10 Regional Demand and Opportunities
- 12.5 By Form - Market Size and Forecast, 2025-2035
- 12.5.1 Segment Definition and Scope
- 12.5.2 Historical Market Size, 2018-2025
- 12.5.3 Revenue Forecast, 2025-2035
- 12.5.4 Volume Forecast, 2025-2035
- 12.5.5 Base-Year Market Share, 2025
- 12.5.6 Segment CAGR and Growth Drivers
- 12.5.7 Subsegment Market Size and Forecast
- 12.5.7.1 Powder
- 12.5.7.2 Granules
- 12.5.7.3 Crystals
- 12.5.8 Subsegment Pricing and Adoption Trends
- 12.5.9 Leading Suppliers and Competition
- 12.5.10 Regional Demand and Opportunities
- 12.6 Segment Growth Comparison
- 12.7 Segment Attractiveness and Priority Matrix
Chapter 13 Global Calcium Hypophosphite End-Use and Application Market Outlook
- 13.1 End-Use Industry and Customer Demand Structure
- 13.2 Leading Applications and Customer Groups
- 13.3 End-Use Market Size, Share and Forecast
- 13.4 Major End-Use Industry Deep Dives
- 13.4.1 Customer Requirements and Use Cases
- 13.4.2 Demand and Replacement Cycles
- 13.4.3 Technical and Regulatory Considerations
- 13.4.4 Purchasing and Procurement Models
- 13.4.5 Leading Vendors and Distribution Channels
- 13.4.6 Forecast and Commercial Opportunities
- 13.5 Emerging Applications and Cross-Segment Demand
- 13.6 End-Use Industry Investment Priorities
Chapter 14 Global Calcium Hypophosphite Geographic Market Outlook, 2025-2035
- 14.1 Regional Market Size and Share, 2025
- 14.2 Regional Market Forecast, 2025-2035
- 14.3 Regional Pricing, Production and Demand Differences
- 14.4 North America
- 14.4.1 United States
- 14.4.2 Canada
- 14.4.3 Mexico
- 14.5 Europe
- 14.5.1 Germany
- 14.5.2 France
- 14.5.3 Italy
- 14.5.4 United Kingdom
- 14.5.5 Spain
- 14.5.6 Poland
- 14.5.7 Russia
- 14.5.8 Netherlands
- 14.5.9 Belgium
- 14.5.10 Sweden
- 14.5.11 Denmark
- 14.5.12 Norway
- 14.5.13 Rest of Europe
- 14.6 Asia Pacific
- 14.6.1 China
- 14.6.2 India
- 14.6.3 Japan
- 14.6.4 South Korea
- 14.6.5 Thailand
- 14.6.6 Indonesia
- 14.6.7 Vietnam
- 14.6.8 Malaysia
- 14.6.9 Australia
- 14.6.10 Rest of Asia Pacific
- 14.7 Latin America
- 14.7.1 Brazil
- 14.7.2 Argentina
- 14.7.3 Colombia
- 14.7.4 Chile
- 14.7.5 Rest of Latin America
- 14.8 Middle East
- 14.8.1 Saudi Arabia
- 14.8.2 United Arab Emirates
- 14.8.3 Turkey
- 14.8.4 Israel
- 14.8.5 Iran
- 14.8.6 Rest of the Middle East
- 14.9 Africa
- 14.9.1 South Africa
- 14.9.2 Egypt
- 14.9.3 Nigeria
- 14.9.4 Morocco
- 14.9.5 Rest of Africa
- 14.10 Regional Investment, Policy and Supply Chain Differences
- 14.11 Regional Competitive Landscape
- 14.12 Geographic Growth Hotspots
Chapter 15 Global Calcium Hypophosphite Technology, Innovation and Sustainability Outlook
- 15.1 Technology Landscape and Maturity
- 15.2 Product, Process and Service Innovation
- 15.3 AI, Automation and Digital Tools in the Industry
- 15.4 Technology Adoption and Performance Benchmarking
- 15.5 Innovation Pipeline and R&D Investment
- 15.6 Patent and Intellectual Property Trends
- 15.7 Energy Efficiency and Resource Management
- 15.8 Sustainability, Recycling and Circularity
- 15.9 Technology Roadmap, 2025-2035
- 15.10 Risks of Obsolescence and Technology Substitution
Chapter 16 Global Calcium Hypophosphite Market Key Strategic Imperatives
- 16.1 Growth and Market Entry Priorities
- 16.2 High-Return Products and Segments
- 16.3 Pricing, Profitability and Cost Optimization
- 16.4 Technology Investment and Product Differentiation
- 16.5 Supply Chain Localization and Resilience
- 16.6 Distribution and Customer Acquisition
- 16.7 Partnership, Acquisition and Capacity Strategy
- 16.8 Regional Expansion Priorities
- 16.9 Short-, Medium- and Long-Term Actions
Chapter 17 Competition Outlook
- 17.1 Industry Competition Characteristics
- 17.2 Market Structure and Concentration
- 17.3 Market Share and Competitive Positioning, 2025
- 17.4 Company-Wise Revenue and Product Benchmarking
- 17.5 Production and Service Capacity Benchmarking
- 17.6 Technology, Pricing and Differentiation
- 17.7 Regional Footprint and Distribution Strength
- 17.8 Mergers, Acquisitions and Strategic Alliances
- 17.9 New Entrants and Competitive Threats
- 17.10 Porter's Five Forces and Industry Attractiveness
- 17.11 Competitive Outlook, 2025-2035
Chapter 18 Company Profiles
- 18.1 Company Coverage and Selection Criteria
- 18.2 Italmatch Chemicals S.p.A.
- 18.2.1 Business Description
- 18.2.2 Company Ownership and Geographic Presence
- 18.2.3 Product and Service Portfolio
- 18.2.4 Manufacturing and Operating Footprint
- 18.2.5 Production Capacity and Expansion Plans
- 18.2.6 Financial Performance and Investment
- 18.2.7 Market Share and Competitive Position
- 18.2.8 Technology and Innovation Capabilities
- 18.2.9 Strategic Alliances or Partnerships
- 18.2.10 Recent Developments
- 18.2.11 Growth Strategy and Outlook
- 18.3 Solstice Advanced Materials
- 18.4 FUJIFILM Wako Pure Chemical Corporation
- 18.5 Thermo Fisher Scientific Inc.
- 18.6 American Elements
- 18.7 Other Relevant Market Participants
Note: Every listed company is profiled on the structure shown under the first company. The company list is preliminary and may change based on research findings, market developments, data availability and client requirements.
Chapter 19 Disclaimer
- 19.1 Research and Forecast Disclaimer
- 19.2 Data Source and Estimation Limitations
Note: The depth of individual sections depends on data availability for this market. Volume, capacity, trade and other unit-based metrics are included where applicable.

