
| REPORT ATTRIBUTE | DETAILS |
|---|---|
| Historical Period | 2019-2022 |
| Base Year | 2023 |
| Forecast Period | 2024-2032 |
| Ion Exchange Resins Market Size 2023 | USD 1429.13 Billion |
| Ion Exchange Resins Market, CAGR | 5.43% |
| Ion Exchange Resins Market Size 2032 | USD 2334.25 Billion |
Market Overview:
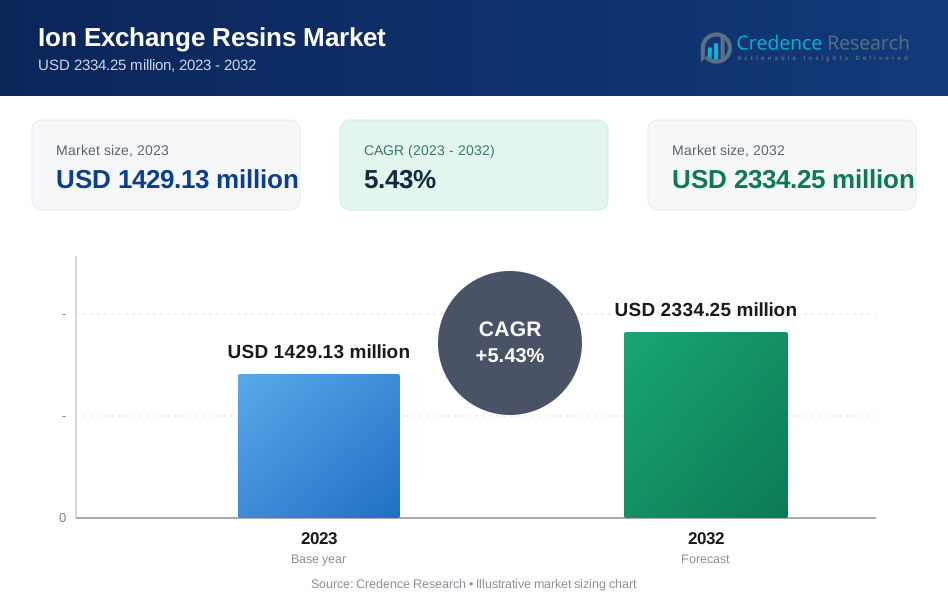
The Ion Exchange Resins market is projected to experience significant growth from USD 1429.13 million in 2023 to USD 2334.25 million by 2032, reflecting a compound annual growth rate (CAGR) of 5.43%. This growth is primarily driven by the increasing demand for clean water, efficient industrial processes, and adherence to stricter environmental regulations. Functionalized resins, known for their superior selectivity and efficiency, are leading the market and are expected to maintain their dominance, particularly in industries such as pharmaceuticals, chemicals, and food & beverage.
The market expansion is fueled by diversification in applications across various sectors. The water treatment segment is the largest and fastest-growing, expected to achieve a CAGR of 5.8%. This growth is driven by the need for clean drinking water and industrial wastewater treatment. Additionally, the pharmaceuticals, chemicals & petrochemicals, and food & beverage industries are significant contributors to market growth, with projected notable CAGR rates ranging from 4.7% to 5.2%. These sectors rely on ion exchange resins for various tasks, including purifying pharmaceuticals and enhancing product quality in food processing.
In terms of regional dominance, Asia Pacific is emerging as the frontrunner. It is set to dominate the market share and witness the fastest growth. This growth is fueled by rapid industrialization, increasing water treatment needs, and significant government investments in infrastructure development. Established markets like Europe and North America have leading manufacturers and prioritize advanced technologies. However, stakeholders should consider challenges such as fluctuating raw material prices, regulatory complexities, and market competition. Nevertheless, advancements in resin technology and a growing focus on sustainability are expected to drive continued expansion in the ion exchange resins market.
Ion Exchange Resin Categories
Ion exchange resins are classified based on their exchange capacity. High Capacity Resins offer a high exchange capacity per unit volume, making them ideal for large-scale industrial applications. These resins efficiently remove ions and require less frequent regeneration. On the other hand, Low Capacity Resins have a lower exchange capacity but may provide advantages such as higher selectivity for specific ions or better regeneration efficiency. These resins are suitable for specialized applications or polishing steps.
Regeneration Methods
Periodic regeneration is necessary to maintain the effectiveness of ion exchange resins. The most common type of regeneration is with Chloride-Form Resins, which use sodium chloride solutions. This method is cost-effective for many applications. However, it may not be suitable in scenarios where chloride contamination is a concern. In such cases, Sulfate-Form Resins are preferred. These resins are regenerated using sulfuric acid and are particularly useful in industries like pharmaceuticals and food & beverage, where strict purity standards must be met.
Regional Market Dynamics
The ion exchange resins market experiences different growth dynamics across regions. Asia Pacific leads the way with the fastest growth rate, driven by rapid industrialization, increasing water treatment needs, and heightened awareness of environmental regulations. North America, as a mature market with established players, is expected to grow steadily due to ongoing industrial activities and technological advancements. In Europe, stringent environmental regulations and a focus on sustainable practices will drive market expansion. Latin America, an emerging market, holds significant growth potential due to the increasing demand for clean water and industrial development. The Middle East & Africa region is also expected to witness substantial market expansion, fueled by growing economies and rising investments in infrastructure development.
Segmentations:
By Resin Type:
- Strong Acid Cation (SAC) Resins
- Weak Acid Cation (WAC) Resins
- Strong Base Anion (SBA) Resins
- Weak Base Anion (WBA) Resins
- Mixed Bed Resins
By Application:
- Water Treatment (Industrial & Municipal)
- Food & Beverage Processing
- Pharmaceuticals & Bioprocessing
- Power Generation
- Chemical & Petrochemical Processing
- Electronics Manufacturing
By Capacity:
- High Capacity Resins
- Low Capacity Resins
By Regeneration Type:
- Chloride-Form Resins
- Sulfate-Form Resins
By Region:
- North America
- The U.S.
- Canada
- Mexico
- Europe
- Germany
- France
- The U.K.
- Italy
- Spain
- Rest of Europe
- Asia Pacific
- China
- Japan
- India
- South Korea
- South-east Asia
- Rest of Asia Pacific
- Latin America
- Brazil
- Argentina
- Rest of Latin America
- Middle East & Africa
- GCC Countries
- South Africa
- Rest of the Middle East and Africa
Market Drivers:
Rising Demand for Clean Water:
The global concerns surrounding water scarcity and contamination are driving the need for efficient water purification technologies. It is projected that by 2032, two-thirds of the world's population could face water stress. Ion exchange resins, which are essential in various water treatment processes, are experiencing a surge in demand. These processes include municipal water treatment, industrial wastewater treatment, and power generation. These resins play a critical role in eliminating impurities like heavy metals, nitrates, and fluorides from water sources to ensure safe drinking water and meet strict regulatory standards. For example, in 2023, ion exchange resins were used to treat approximately 3 billion gallons of water daily.
Stringent Environmental Regulations:
The tightening of environmental regulations worldwide is propelling the adoption of advanced wastewater treatment solutions, including ion exchange resins. Governments are imposing stricter discharge standards for pollutants, necessitating the use of technologies like ion exchange resins to achieve compliance. For instance, the recent regulations by the US EPA limit arsenic levels in drinking water to 10 parts per billion. Furthermore, initiatives promoting water conservation and reuse are further driving the demand for these resins in industrial wastewater treatment. In 2023, the use of ion exchange resins in industrial wastewater treatment increased by 7% compared to the previous year.
Growth in Pharmaceutical and Bioprocessing Industries:
The expanding pharmaceutical and bioprocessing sectors require high-purity water for various critical applications. Ion exchange resins are indispensable in ensuring the required levels of purity in these industries by purifying proteins, enzymes, and other biomolecules used in drug development and production. Additionally, these resins play a vital role in fine chemical production by removing impurities from chemicals used in pharmaceuticals, cosmetics, and related sectors.
Expanding Food and Beverage Industry:
Ion exchange resins are increasingly being used across the food and beverage industry for various purposes. They are crucial in water softening to enhance taste and extend the shelf life of beverages. Moreover, these resins are employed in decolorization processes to improve the visual appeal of beverages like juices and syrups. In food processing, ion exchange resins assist in removing impurities and contaminants to elevate product quality and safety standards.
Technological Advancements and Innovation:
Continual advancements in ion exchange resin technology are driving the development of more efficient and cost-effective solutions. These innovations include the creation of resins with higher selectivity, allowing for the removal of specific target ions while minimizing the loss of desired components. Furthermore, improvements in regeneration efficiency are reducing chemical and water consumption during resin regeneration, thereby lowering operational costs and enhancing sustainability.
Rising Demand for Resource Recovery and Sustainability:
Growing environmental concerns have led to an increased focus on sustainable practices. Ion exchange resins play a crucial role in resource recovery by facilitating the extraction of valuable minerals and metals from wastewater streams. Additionally, advancements in resin regeneration processes are minimizing waste generation and promoting sustainable practices in water treatment and industrial processes.
Market Trends:
- Surging Demand for Water and Wastewater Treatment: Growing concerns over water scarcity and stricter environmental regulations are driving the demand for efficient water and wastewater treatment solutions. For instance,Ion exchange resins play a vital role in these processes, removing contaminants like heavy metals, minerals, and organic substances. This trend is expected to continue as populations expand and water resources become more stressed.
- Focus on Sustainability and Resource Recovery: Sustainability is increasingly becoming a priority across industries. As an example, ion exchange resins, a key component in water treatment processes, have a market that reflects this growth. Ion exchange resins can be regenerated and reused, making them an attractive option for eco-conscious businesses and municipalities. Additionally, some resins can be used to capture valuable resources from wastewater streams, further promoting their adoption in sustainable practices.
- Expansion into New Applications: The traditional applications of ion exchange resins in water treatment are being complemented by their growing use in new sectors. This includes applications in the food and beverage industry (purifying sugar and syrups), pharmaceuticals (purifying biomolecules), and the energy sector (nuclear power plant water treatment). As research and development efforts continue, the identification of new applications is expected to propel market growth further.
- Technological Advancements and Material Development: Continuous advancements in resin technology are leading to the development of more efficient, selective, and durable ion exchange resins. These advancements cater to specific requirements of various applications, offering improved performance and cost-effectiveness. Additionally, research in developing new materials with enhanced capacities and functionalities is expected to provide further competitive advantages in the market.
- Regional Market Growth: The Asia Pacific region is anticipated to witness the fastest growth in the ion exchange resins market due to factors like rapid industrialization, rising disposable income, and growing government initiatives for water treatment infrastructure development. However, significant growth is also expected in developed regions like North America and Europe, driven by stringent environmental regulations and ongoing efforts to upgrade aging water treatment facilities.
Market Restraints and Challenges:
- Fluctuating Prices and Supply Chain Disruptions:
The ion exchange resin market heavily relies on raw materials like styrene and acrylic monomers. The prices of these materials can be volatile due to factors like fluctuating oil prices, geopolitical instability, and supply chain disruptions. These price fluctuations can significantly impact the overall production costs of ion exchange resins, squeezing profit margins for manufacturers and potentially discouraging investments in capacity expansion. Additionally, global supply chain disruptions can lead to shortages of raw materials, hindering production and impacting the timely fulfillment of customer orders.
- Stringent Environmental Regulations and Waste Management Concerns:
Growing environmental regulations regarding wastewater treatment and disposal are putting pressure on the ion exchange resin industry. These regulations often mandate stricter limits on residual contaminants in treated water and require proper disposal of spent ion exchange resins. This necessitates the development of more efficient regeneration techniques and environmentally friendly disposal methods for spent resins, which can add complexity and cost to the overall ion exchange process. Furthermore, the potential environmental impact of improper resin disposal poses a challenge for the industry, requiring stricter regulations and responsible waste management practices.
- Technological Advancements and Competition from Alternative Technologies:
The ongoing development of alternative water treatment technologies like membrane filtration and advanced oxidation processes could pose a challenge to the dominance of ion exchange resins in certain applications. While ion exchange resins offer advantages in specific scenarios, these newer technologies might be more cost-effective or efficient for treating certain types of contaminants. Manufacturers in the ion exchange resin market need to continuously innovate and develop more advanced and cost-competitive resins to maintain their market share in the face of evolving technological alternatives.
- Limited Awareness and Knowledge in Developing Economies:
The adoption of ion exchange resins in some developing economies might be hindered by limited awareness and knowledge about their benefits and applications. While the market is expected to grow in these regions due to increasing industrialization and stricter environmental regulations, a lack of technical expertise and infrastructure for implementing ion exchange technology can be a barrier. Addressing this challenge requires targeted educational initiatives and capacity building efforts to promote the understanding and adoption of ion exchange resins in developing economies.
- High Initial Investment Costs and Maintenance Requirements:
Implementing ion exchange technology can involve a significant upfront investment in equipment and initial resin purchases. Additionally, the ongoing maintenance and regeneration of ion exchange resins can add to the operational costs. These factors might be a deterrent for smaller or budget-conscious companies, potentially limiting the broader adoption of ion exchange technology, particularly in industries with tighter profit margins. Manufacturers can address this challenge by offering more leasing or rental options for equipment and developing cost-effective regeneration techniques to make ion exchange technology more accessible to a wider range of users.
Key Players
- The Dow Chemical Company
- Lanxess AG
- Purolite Corporation
- ResinTech Inc.
- Sunresin New Materials Co., Ltd
- Mitsubishi Chemical Holdings Corporation
- Thermax Limited
- Ion Exchange India Ltd
- Samyang Holdings Corporation
- Jiangsu Suqing Water Treatment Engineering Group Co., Ltd.
- Alfa Aesar
- Novasep Holding
- Bio-Rad Laboratories, Inc
Recent Developments:
- In January 2023, Lanxess AG and TotalEnergies formed a partnership in which TotalEnergies will make styrene using tall oil as feedstock. It will account for sustainable manufacturing of respective products and lowering carbon footprint. Through the block, the company strengthens its product portfolio.
- In November 2022, Purolite, an Ecolab company and a prominent provider of synthetic and agarose-based resins used in bioprocessing, renewed and extended its deal with Repligen Corporation to supply five ligands until 2032.
Regional Analysis:
Asia Pacific :
The Asia Pacific region is poised to maintain its dominant market share throughout the forecast period. This dominance is attributed to several factors driving the demand for ion exchange resins. Rapid industrialization, particularly in countries like China and India, is fueling the expansion of industries such as power generation, chemicals, and textiles. As these industries grow, there is an increasing need for water treatment and purification processes, driving the demand for ion exchange resins. Additionally, the region's increasing focus on environmental regulations, especially regarding wastewater treatment, creates opportunities for ion exchange resins in treating industrial effluents. Moreover, rapid urbanization in Asia Pacific leads to a rise in water demand and puts pressure on freshwater resources, making ion exchange resins an efficient solution for water reuse and recycling initiatives.
North America and Europe :
North America and Europe are expected to collectively hold a significant market share, although growth might be comparatively limited due to mature markets and the presence of substitutes. These regions benefit from established industrial bases and stringent environmental regulations, which drive the adoption of advanced water treatment technologies like ion exchange resins. Despite the mature markets, continued investments in water treatment infrastructure and a strong focus on environmental sustainability are expected to sustain demand for ion exchange resins in North America and Europe.
Rest of the World :
The Rest of the World region, comprising Latin America, the Middle East, and Africa, is poised to witness emerging market potential for ion exchange resins. Growing economies in these regions, coupled with increasing awareness of water scarcity and government initiatives for water treatment infrastructure development, are expected to drive market growth. As these regions undergo industrialization and urbanization, the demand for water treatment solutions is likely to increase, presenting significant opportunities for the adoption of ion exchange resins to address water purification needs.
Future Outlook:
- Increasing Demand for High-Purity Water: Stringent regulations in various industries, such as pharmaceuticals, electronics, and power generation, will continue to drive the demand for high-purity water. Ion exchange resins play a vital role in water purification processes, ensuring compliance with these regulations.
- Growing Environmental Concerns: Rising environmental consciousness and stricter wastewater treatment regulations will propel the demand for ion exchange resins in wastewater treatment applications. These resins help remove pollutants and contaminants from wastewater, contributing to environmental sustainability.
- Expansion of Pharmaceutical and Biopharmaceutical Industries: The burgeoning pharmaceutical and biopharmaceutical industries are expected to create a significant demand for ion exchange resins used in purification processes for drugs and biomolecules.
- Technological Advancements: Continuous advancements in ion exchange resin technology, such as the development of more efficient and selective resins, will enhance their performance and broaden their application areas.
- Focus on Resource Recovery and Reuse: The growing focus on resource recovery and reuse will create opportunities for ion exchange resins in applications like metal recovery from wastewater streams and industrial processes.
- Rising Demand in Developing Economies: Rapid industrialization and growing water scarcity in developing economies will fuel the demand for ion exchange resins for water treatment and purification purposes.
- Integration with Automation and Smart Technologies: The integration of ion exchange resins with automation and smart technologies in water treatment plants will improve process efficiency and optimize resource utilization.
- Growing Adoption in Food and Beverage Industry: The increasing demand for safe and high-quality food and beverages will lead to the wider adoption of ion exchange resins in food and beverage processing for applications like demineralization and color removal.
- Focus on Sustainability: Manufacturers are expected to focus on developing sustainable ion exchange resins with improved biodegradability and lower environmental impact.
- Consolidation and Strategic Partnerships: The market may witness consolidation among existing players and strategic partnerships to expand product portfolios and geographical reach.
Request a Free Sample
Fill in your details and we'll send you a free sample report.
- Sample data tables & charts
- Research methodology
Need a Custom Version of This Report?
Tailor the scope, geography, or segments to your exact requirements.
- Custom geography or segment scope
- Direct access to our analyst team
Frequently Asked Questions
What is the projected growth of the Ion Exchange Resins market between 2023 and 2032?
What factors are driving the growth of the Ion Exchange Resins market?
Who are the major players in the Ion Exchange Resins market?
How is the availability of Ion Exchange Resins expanding, and through what channels?
Table of Content
Chapter 1. Report Introduction
- 1.1 Report Description & Purpose
- 1.1.1 Report Title & Market Definition
- 1.1.2 Unique Selling Propositions (USP) & Key Differentiators
- 1.1.3 Value Proposition for Stakeholders
- 1.2 Research Objectives
- 1.2.1 Market Sizing Objectives (Volume & Revenue)
- 1.2.2 Segmentation Objectives
- 1.2.3 Competitive Intelligence Objectives
- 1.2.4 Forecast & Scenario Objectives
- 1.3 Report Scope
- 1.3.1 Ion Exchange Resins Scope – Types & Subtypes Covered
- 1.3.2 Geographic Scope – Regions & Countries Covered
- 1.3.3 Historical Period, Base Year & Forecast Period (2023; forecast to 2032)
- 1.3.4 Inclusions & Exclusions
- 1.4 HS Code & Classification Framework
- 1.5 Currency, Units & Pricing Basis
- 1.6 Target Stakeholders
- 1.7 Limitations & Assumptions
Chapter 2. Executive Summary
- 2.1 Global Ion Exchange Resins Market Snapshot
- 2.1.1 Market Size – Historical (2023) & Forecast (2023-2032) (2023: USD 1429.13 million → 2032: USD 2334.25 million)
- 2.1.2 Volume & Revenue – Global Totals
- 2.1.3 Key Market Highlights – Top Five Facts
- 2.2 Ion Exchange Resins Market Segmentation Snapshot
- 2.2.1 Market Split by Region – 2023 vs. 2032
- 2.3 Competitive Snapshot
- 2.3.1 Top 10 Players by Revenue Share – 2023
- 2.3.2 Top 10 Players by Volume Share – 2023
- 2.3.3 Recent Strategic Developments (18-Month Summary)
- 2.4 Key Investment Highlights & Strategic Conclusions
Chapter 3. Ion Exchange Resins Market Dynamics & Industry Analysis
- 3.1 Market Overview & Context
- 3.1.1 Ion Exchange Resins Market Position in the Broader Automotive Value Chain
- 3.1.2 OEM vs. Replacement Market Dynamics
- 3.1.3 Market Maturity & Development Stage by Region
- 3.2 Ion Exchange Resins Market Drivers
- 3.3 Ion Exchange Resins Market Restraints & Challenges
- 3.4 Ion Exchange Resins Market Opportunities
- 3.5 Porter's Five Forces Analysis
- 3.5.1 Threat of New Entrants
- 3.5.2 Bargaining Power of Suppliers
- 3.5.3 Bargaining Power of Buyers
- 3.5.4 Threat of Substitutes
- 3.5.5 Competitive Rivalry – Intensity Assessment
- 3.6 Ion Exchange Resins Value Chain Analysis
- 3.6.1 Upstream – Raw Material/Input Suppliers
- 3.6.1.1 Raw Material/Input 1
- 3.6.1.2 Raw Material/Input 2
- 3.6.1.3 Raw Material/Input 3
- 3.6.2 Midstream – Production/Manufacturing/Service Delivery
- 3.6.2.1 Production/Process Overview
- 3.6.2.2 Key Facility Locations & Capacity by Manufacturer
- 3.6.3 Downstream – Distribution & End Consumer
- 3.6.3.1 Primary Channel – B2B/OEM
- 3.6.3.2 Secondary Channels – Dealer, Retail, Online, Direct
- 3.6.4 Value Chain Profitability Analysis
- 3.6.1 Upstream – Raw Material/Input Suppliers
- 3.7 PESTEL Analysis
- 3.7.1 Political Factors
- 3.7.2 Economic Factors
- 3.7.3 Social Factors
- 3.7.4 Technological Factors
- 3.7.5 Environmental Factors
- 3.7.6 Legal Factors
- 3.8 Ion Exchange Resins Supply Chain Analysis
- 3.8.1 Raw Material/Input Supply Risk Assessment
- 3.8.2 Manufacturing Concentration Risk (Geographic Exposure)
- 3.8.3 Trade Disruption Impact Analysis
- 3.9 Regulatory & Policy Landscape
Note: The regulatory and policy landscape section covers regulations based on their applicability to the market, Ion Exchange Resins category, geography, and scope of the study. Only regulatory frameworks with a material impact on operations, compliance, trade, sustainability, or market access are analyzed in detail.
Chapter 4. Key Investment Pockets & Opportunity Analysis
- 4.1 Ion Exchange Resins Market Attractiveness Analysis
- 4.1.1 By Region – Investment Attractiveness Matrix (Volume × CAGR)
- 4.2 Absolute Revenue Growth Opportunity
- 4.2.1 By Region – Absolute USD Growth Through 2032
- 4.3 Incremental Volume Opportunity
- 4.3.1 By Region – Incremental Volume Through 2032
- 4.3.2 Segment – Incremental Volume
- 4.4 Emerging Submarket Opportunity Deep Dive (Subject to Applicability)
- 4.5 Emerging Market Opportunity Scorecards
- 4.5.1 United States
- 4.5.2 Europe
- 4.5.3 Asia
- 4.5.4 Middle East & Africa
Note: Emerging Market Opportunity Scorecards will be included based on relevance and strategic importance. Regions listed are indicative and may vary depending on data availability and market dynamics.
Chapter 5. Ion Exchange Resins Import-Export Analysis & Trade Flows
- 5.1 Global Trade Overview
- 5.1.1 Global Export Value by Country (2023)
- 5.1.2 Global Export Volume by Country (2023)
- 5.1.3 Global Import Value by Country (2023)
- 5.1.4 Global Import Volume by Country (2023)
- 5.1.5 Net Trade Balance by Country (2023)
- 5.2 Export Analysis – Segment
- 5.2.1 Type 1 (HS Code)
- 5.2.2 Type 2 (HS Code)
- 5.2.3 Type 3 (HS Code)
- 5.2.4 Type 4 (HS Code)
- 5.2.5 Type 5 (HS Code)
- 5.3 Import Analysis – Segment
- 5.3.1 Type 1 (HS Code)
- 5.3.2 Type 2 (HS Code)
- 5.3.3 Type 3 (HS Code)
- 5.3.4 Type 4 (HS Code)
- 5.3.5 Type 5 (HS Code)
- 5.4 Average Unit Trade Prices
- 5.4.1 Average Export Price – Segment & Country
- 5.4.2 Average Import Price – Segment & Source Country
- 5.4.3 Price Trends (2023)
- 5.5 Key Trade Route Analysis
- 5.5.1 Trade Route 1
- 5.5.2 Trade Route 2
- 5.5.3 Trade Route 3
- 5.5.4 Trade Route 4
- 5.5.5 Trade Route 5
- 5.6 Trade Policy Impact Assessment
- 5.6.1 US Anti-Dumping & Section 301 Tariffs
- 5.6.2 EU Customs Union Impact
- 5.6.3 Major Free Trade Agreements
- 5.6.4 USMCA Rules of Origin
Note: Trade policy analysis will be included only where relevant to the Ion Exchange Resins market.
Chapter 6. Competitive Landscape & Company Benchmarking
- 6.1 Ion Exchange Resins Market Concentration & Structure
- 6.1.1 Herfindahl-Hirschman Index (HHI) – vs. 2023
- 6.1.2 Tier 1, Tier 2 & Tier 3 Market Structure
- 6.1.3 Global, Regional & Local Player Dynamics
- 6.2 Ion Exchange Resins Market Share Analysis – 2023
- 6.2.1 Global Revenue Share by Company
- 6.2.2 Global Volume Share by Company
- 6.2.3 Regional Revenue Share
- 6.2.4 Market Share Evolution ( vs. 2023)
- 6.2.5 OEM Segment Share by Company
- 6.2.6 Replacement Segment Share by Company
- 6.3 Production/Delivery Capacity & Facility Analysis
- 6.3.1 Global Installed Capacity
- 6.3.2 Capacity Utilization Rates
- 6.3.3 Production/Output Volume
- 6.3.4 Facility Locations & Capacity Map
- 6.3.5 Planned Capacity Additions
- 6.4 Ion Exchange Resins Competitive Benchmarking Matrix
- 6.4.1 Revenue, Volume, CAGR & Profitability Comparison
- 6.4.2 Channel Revenue Mix
- 6.4.3 Geographic Revenue Exposure
- 6.4.4 R&D Intensity
- 6.4.5 Sustainability Maturity
- 6.5 Strategic Developments in Ion Exchange Resins (Last 24 Months)
- 6.5.1 Mergers, Acquisitions & Divestments
- 6.5.2 New Ion Exchange Resins Launches
- 6.5.3 Facility Expansions
- 6.5.4 Strategic Alliances, Joint Ventures & Partnerships
- 6.5.5 Distribution Expansion & Market Entry
- 6.5.6 Sustainability & ESG Initiatives
- 6.6 Competitive Strategy Mapping
- 6.6.1 Leader, Challenger, Follower & Niche Classification
- 6.6.2 Pricing Strategy Comparison
- 6.6.3 Channel Strategy Matrix
Note: Strategic developments are included based on their materiality and the availability of reliable information.
Chapter 7. Global Ion Exchange Resins Market – By Distribution Channel
- 7.1 Segment Overview
- 7.1.1 Volume & Revenue Split by Channel (2023 & 2032)
- 7.1.2 Channel Mix Evolution (2023-2032)
Chapter 8. Regional Market Analysis – Global Overview
- 8.1 Global Regional Overview
- 8.1.1 Regional Volume Share
- 8.1.2 Regional Revenue Share
- 8.1.3 Regional Volume by Region
- 8.1.4 Regional Revenue by Region
- 8.1.5 Regional Forecast Through 2032
- 8.2 Cross-Regional Segment Analysis
- 8.2.1 By Distribution Channel
- 8.2.2 By Brand/Price Tier
Chapter 9. North America Ion Exchange Resins Market
- 9.1 United States
- 9.2 Canada
- 9.3 Mexico
Chapter 10. Europe Ion Exchange Resins Market
- 10.1 Germany
- 10.2 France
- 10.3 Italy
- 10.4 United Kingdom
- 10.5 Spain
- 10.6 Poland
- 10.7 Russia
- 10.8 Netherlands
- 10.9 Belgium
- 10.10 Sweden
- 10.11 Denmark
- 10.12 Norway
- 10.13 Rest of Europe
Chapter 11. Asia Pacific Ion Exchange Resins Market
- 11.1 China
- 11.2 India
- 11.3 Japan
- 11.4 South Korea
- 11.5 Thailand
- 11.6 Indonesia
- 11.7 Vietnam
- 11.8 Malaysia
- 11.9 Australia
- 11.10 Rest of Asia Pacific
Chapter 12. Latin America Ion Exchange Resins Market
- 12.1 Brazil
- 12.2 Argentina
- 12.3 Colombia
- 12.4 Chile
- 12.5 Rest of Latin America
Chapter 13. Middle East Ion Exchange Resins Market
- 13.1 Saudi Arabia
- 13.2 United Arab Emirates
- 13.3 Turkey
- 13.4 Israel
- 13.5 Iran
- 13.6 Rest of the Middle East
Chapter 14. Africa Ion Exchange Resins Market
- 14.1 South Africa
- 14.2 Egypt
- 14.3 Nigeria
- 14.4 Morocco
- 14.5 Rest of Africa
Chapter 15. Ion Exchange Resins Company Profiles
- 15.1 [Company 01]
- 15.1.1 Company Overview
- 15.1.2 Key Management Personnel
- 15.1.3 Products & Services Portfolio
- 15.1.4 Financial Performance
- 15.1.5 Key Market Focus & Geographic Presence
- 15.1.6 Recent Developments & Strategic Initiatives
Note: The company profile list is preliminary and may change based on research findings, market developments, data availability, and client requirements.
Chapter 16. Appendices
- Appendix A – List of Abbreviations & Acronyms
- Appendix B – Industry Classification Code Reference – Full Series
- Appendix C – Production & Capacity Data Tables
- Appendix D – End-Use & Demand Base Tables
- Appendix E – Consumption & Replacement Rate Assumptions
- Appendix F – ASP Reference Tables
- Appendix G – Manufacturing & Facility Database
- Appendix H – Import-Export Data Tables
- Appendix I – Regulatory Summary Tables
- Appendix J – Primary Research Participant List (Anonymized)
- Appendix K – Primary Research Questionnaire Framework
- Appendix L – Data Sources & Bibliography
- Appendix M – Market Size Divergence & Source Comparison
Chapter 17. Research Methodology
- 17.1 Research Framework & Philosophy
- 17.2 Secondary Research – Sources, Hierarchy & Data Extraction
- 17.3 Data Modeling – Bottom-Up & Top-Down Market Sizing
- 17.4 Primary Research – Stakeholder Framework, LOI & Sample Sizes
- 17.5 Forecast Methodology – Regression, Scenario & Sensitivity Analysis
- 17.6 Quality Control – Four-Layer Validation Framework
- 17.7 Limitations & Standard Assumptions
- 17.8 Disclaimer
