
Market Overview:
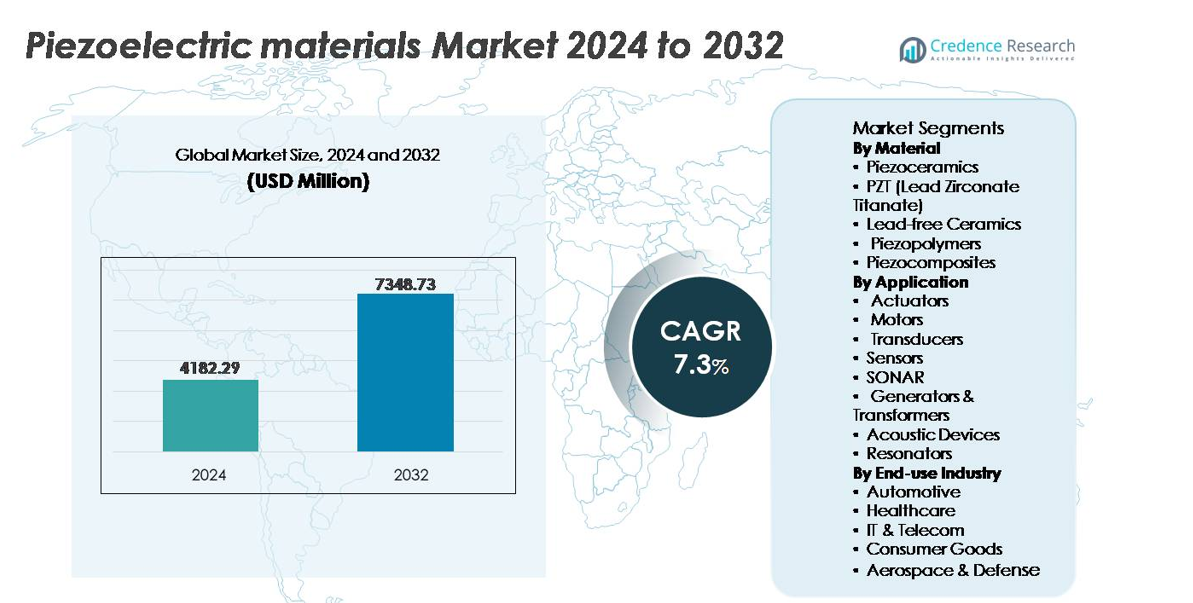
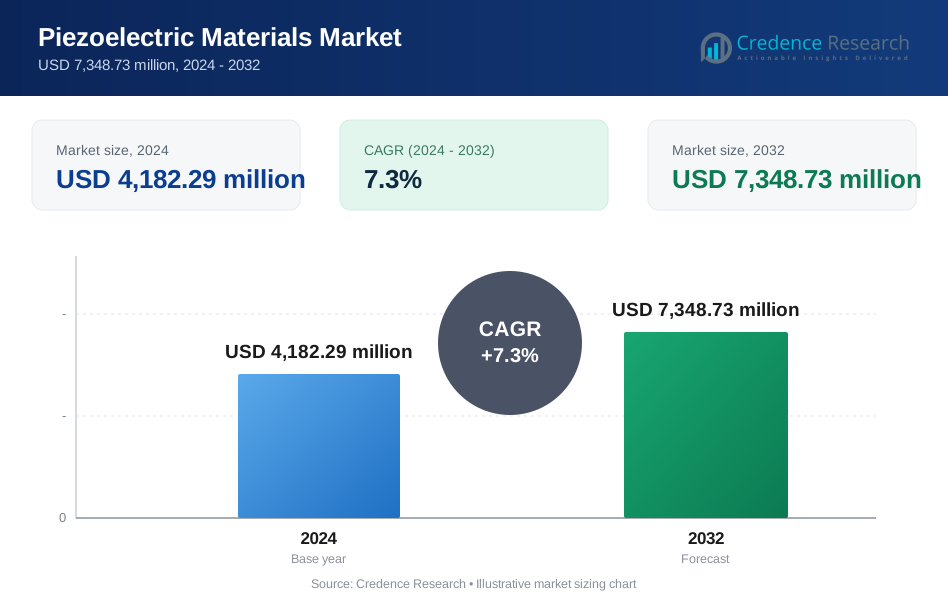
The global piezoelectric materials market was valued at USD 4,182.29 million in 2024 and is projected to reach USD 7,348.73 million by 2032, reflecting a compound annual growth rate (CAGR) of 7.3% throughout the forecast period.
| REPORT ATTRIBUTE | DETAILS |
|---|---|
| Historical Period | 2020-2023 |
| Base Year | 2024 |
| Forecast Period | 2025-2032 |
| Piezoelectric Materials Market Size 2024 | USD 4,182.29 million |
| Piezoelectric Materials Market, CAGR | 7.3% |
| Piezoelectric Materials Market Size 2032 | USD 7,348.73 million |
The piezoelectric materials market features strong competition among global manufacturers and specialty material developers, including Arkema, Sparkler Ceramics, PI Ceramics GmbH, TDK Corporation, APC International, Solvay, Piezomechanik GmbH, Hong Kong Piezo Co. Ltd., L3Harris Technologies, Inc., and CeramTec. These companies focus on advanced PZT formulations, lead-free ceramics, and flexible polymer-based solutions for evolving industrial, medical, and consumer applications. Asia Pacific leads the global market with an exact share of 67.5%, supported by its dominant electronics, automotive, and sensor manufacturing ecosystem. Europe and North America remain essential strategic regions due to strong adoption in healthcare imaging, aerospace navigation, and defense systems, contributing to sustained demand for high-performance and eco-compliant piezoelectric materials.
Market Insights:
- The global piezoelectric materials market was valued at USD 4,182.29 million in 2024 and is projected to reach USD 7,348.73 million by 2032, registering a CAGR of 7.3% during the forecast period.
- Market growth is driven by rising adoption of precision sensors, actuators, and ultrasound transducers across automotive, industrial automation, and medical diagnostics, supported by increasing demand for smart and energy-efficient devices.
- Key trends include the shift toward lead-free ceramics, flexible polymer-based piezoelectric materials, and miniaturized components powering wearables, robotics, and IoT-enabled sensing applications.
- The market remains competitive with major players investing in material innovation and supply chain integration, while challenges persist due to regulatory restrictions and performance limitations in lead-free alternatives.
- Asia Pacific dominates with 67.5% market share, driven by electronics and automotive manufacturing, while actuators represent the leading application segment, contributing the highest share globally, followed by sensors and transducers.
Market Segmentation Analysis:
By Material:
Piezoceramics represent the dominant material segment, accounting for the largest market share, primarily driven by their superior electromechanical coupling, high Curie temperature, and compatibility with high-voltage applications. Within this category, PZT (Lead Zirconate Titanate) remains the most widely used composition due to its tunable dielectric properties and proven performance in actuators, medical ultrasound, and precision motion control systems. However, the transition toward environmental compliance is accelerating adoption of lead-free ceramics, particularly for consumer electronics and healthcare. Piezopolymers and piezocomposites continue gaining traction in wearables, flexible sensors, and aerospace structures where low weight and design flexibility are essential.
- For instance, PI Ceramics manufactures multilayer PZT stacks with stroke lengths up to 20 micrometers and layer thicknesses as low as 20 micrometers, enabling nanometer-scale positioning for semiconductor and metrology equipment.
By Application:
Actuators form the dominant application segment, holding the highest market share due to expanding integration in automotive fuel injection, precision manufacturing, semiconductor lithography, and micro-robotics. The rising demand for miniaturized and adaptive motion systems strengthens growth across industrial automation and medical device fields. Sensors and transducers remain critical revenue contributors, particularly in condition monitoring, ultrasound imaging, and industrial feedback systems. SONAR technology sustains steady demand from naval and ocean exploration programs, while acoustic devices and resonators benefit from the proliferation of smartphones and 5G infrastructure requiring precise frequency control and noise-cancellation capabilities.
- For instance, TDK Corporation's COM45S5 piezo actuator delivers blocking forces up to 1400 Newtons(typically) with stroke lengths of 83 micrometers (at 160 V and 730 N of preload), enabling high-resolution motion control in chip-fabrication tools and robotic end-effectors.
By End-use Industry:
The automotive sector dominates the piezoelectric materials market, supported by rapid adoption in fuel atomization, tire pressure monitoring, knock detection, parking assistance, and advanced driver-assistance systems. Electrification and smart mobility trends further boost demand for piezoelectric sensors in battery monitoring and vibration-energy harvesting. Healthcare emerges as a high-growth end-use segment with increasing utilization in diagnostic ultrasound, surgical tools, wearable monitoring, and dental equipment. Meanwhile, the IT & telecom industry leverages piezoelectric materials for timing components in 5G networks, while aerospace and defense integrate them into navigation, structural health monitoring, and ruggedized sensing platforms.
Key Growth Drivers:
Rising Demand for Precision Sensors and Actuators in Automation
The accelerating integration of automation in manufacturing, robotics, semiconductor production, and automotive systems serves as one of the strongest growth drivers for piezoelectric materials. Industries increasingly deploy high-precision actuators and vibration, pressure, and motion sensors to enhance productivity, reduce defects, and enable predictive operations. Electric vehicles, collaborative robots, and autonomous systems rely heavily on piezoelectric components for feedback control, motion accuracy, fuel injection, noise suppression, and structural monitoring. Rapid miniaturization of components fuels adoption in micro-actuators, haptic interfaces, and MEMS-based devices. As factories transition toward Industry 4.0 with real-time analytics and edge intelligence, piezoelectric materials support long operational life, low power consumption, and accuracy under extreme environments. This positions them as foundational materials for compact, intelligent, sensor-enabled ecosystems across industrial and consumer technology platforms.
- For instance, Physik Instrumente (PI) GmbH developed its P-620 NanoCube® XYZ piezo stage offering 100 microns of travel range per axis with sub-nanometer resolution below 1 nm, supporting semiconductor metrology and nanolithography alignment systems.
Expanding Adoption in MedTech Imaging, Wearable Diagnostics, and Therapeutic Devices
Growing healthcare digitization and demand for minimally invasive diagnostics significantly boost the need for piezoelectric materials, particularly in ultrasound transducers, implantable devices, and therapeutic systems. Medical ultrasound remains the largest healthcare application due to rising chronic conditions and expanded use in cardiology, prenatal assessment, and emergency care. Piezoelectric ceramics and polymers enable high-resolution imaging, miniaturization of probes, and improved acoustic performance. The surge in wearable health monitoring drives new demand for flexible and lightweight piezopolymers for biosignal capture, gait analysis, drug delivery patches, and remote patient monitoring. Advancements in focused ultrasound surgery, lithotripsy, and rehabilitative stimulation further expand material opportunities. As aging demographics and home-based care models rise, piezoelectric-enabled devices bring precision, non-invasive diagnostics, and portable form factors, strengthening market penetration across global healthcare systems.
- For instance, GE Healthcare’s XDclear probe platform integrates single-crystal piezoelectric elements that deliver up to 170% greater bandwidth compared to conventional ceramic probes, enabling sharper contrast and deeper penetration in diagnostic imaging.
Military Investments in SONAR, Structural Health Monitoring, and Advanced Navigation
Defense modernization programs worldwide stimulate high-value demand for piezoelectric materials in SONAR arrays, hydrophones, navigation systems, missile guidance components, and structural vibration monitoring. Naval fleets increasingly invest in deep-water detection systems for submarine surveillance, mine detection, and ocean mapping, relying on piezoelectric ceramics for acoustic transmission and sensitivity. Aerospace applications utilize piezoelectric composites to monitor structural fatigue in wings, fuselage, and turbine assemblies, extending asset life and preventing catastrophic failure. Border surveillance and tactical communication systems incorporate piezoelectric resonators and filters for signal stability in harsh environments. Harsh-condition endurance, thermal reliability, and high sensitivity render these materials suitable for next-generation autonomous defense platforms, unmanned undersea vehicles, and space programs focused on durability and low power utilization.
Key Trends and Opportunities:
Transition Toward Lead-Free Ceramics and Sustainable Manufacturing
Environmental regulations and RoHS compliance continue driving investments in lead-free piezoelectric materials, particularly potassium sodium niobate (KNN), bismuth-based ceramics, and eco-friendly polymer-laminated composites. Consumer electronics, medical technologies, and children’s products are under increasing pressure to eliminate lead content without sacrificing performance. The development of advanced sintering processes, compositional engineering, and nano-additive reinforcement improves Curie temperature, reliability, and piezoelectric coefficients for lead-free alternatives. Sustainability also shapes production methods, promoting energy-efficient forming, reduced emissions, and closed-loop recycling for ceramic powders. This transition creates strategic opportunities for material manufacturers to differentiate through green certifications, regulatory compliance, and eco-ticketed product portfolios, supporting the accelerating global move toward low-toxicity and circular material ecosystems.
- For instance, Morgan Advanced Materials implemented a ceramic powder reclaiming and reprocessing loop capable of recapturing up to 150 tons of alumina-rich raw material annually from machining scrap in its UK ceramic facilities.
Emergence of Flexible Piezoelectric Materials for Wearables, Soft Robotics, and Energy Harvesting
The rapid advancement of flexible and stretchable piezopolymers and composite films unlocks new application areas in soft robotics, sports biometrics, gesture control, smart textiles, and structural energy-harvesting systems. Demand for self-powered electronics—driven by IoT expansion—encourages adoption of ultrathin piezoelectric layers capable of converting motion, vibration, and physiological signals into electrical output. Flexible materials enable form-fitting designs, bending durability, and integration into curved or moving surfaces, which traditional ceramics cannot accommodate. Opportunities expand in agricultural monitoring drones, bridge and railway infrastructure inspection, mobile charging platforms, and consumer fitness analytics. As materials overcome challenges associated with fatigue resistance and output efficiency, flexible piezoelectric solutions position as pivotal enablers of the next generation of wearable, autonomous, and low-energy digital ecosystems.
- For instance, Piezo Systems’ polyimide-laminated PVDF energy harvester modules deliver open-circuit voltages exceeding 20 volts under routine mechanical excitation, supporting autonomous sensor nodes in remote structural monitoring.
Key Challenges:
Material Performance Limitations and High Processing Complexity
Despite technological progress, improving energy conversion efficiency, thermal stability, and long-term mechanical reliability remains a core challenge for piezoelectric materials. Ceramics offer high sensitivity but are brittle, limiting use in impact-prone and lightweight designs; polymers provide flexibility but lower piezoelectric coefficients. Achieving high-performance lead-free materials that match PZT remains difficult due to processing complexity, compositional tuning, and cost-intensive sintering. Tight tolerances required for medical imaging and aerospace components elevate quality assurance costs. These performance constraints hinder scalability and often delay commercial adoption for emerging applications requiring durability with multifunctionality.
Regulatory Restrictions and Compliance Cost Burden
Stringent global policies restricting hazardous substances intensify pressures on manufacturers to migrate from lead-based compositions. Compliance with EU RoHS directives, medical-grade certifications, aerospace qualification standards, and export restrictions significantly increases R&D expenses and time-to-market cycles. Substituting well-established PZT with alternative materials requires extensive testing for acoustic fidelity, dielectric reliability, and device lifespan. The cost burden particularly affects SMEs and price-sensitive consumer markets. As industries pursue sustainability benchmarks, manufacturers must absorb redesign, retooling, and supply chain restructuring costs, posing challenges for profitability and competitive positioning in a rapidly evolving regulatory landscape.
Regional Analysis:
Asia Pacific
Asia Pacific leads the piezoelectric materials market with approximately 67.5% share, driven by its strong semiconductor, consumer electronics, automotive, and medical device manufacturing ecosystem. China, Japan, South Korea, and Taiwan anchor production with extensive R&D and vertically integrated supply chains. Expanding EV adoption, growth in industrial robotics, and rising use of sensors for predictive maintenance continue to accelerate demand. The region also benefits from government-backed manufacturing incentives and rapid urbanization. Increasing investment in flexible electronics, energy harvesting systems, and smart consumer devices positions Asia Pacific as the center of innovation and volume demand for piezoelectric materials.
North America
North America holds roughly 15% market share, supported by advanced medical imaging, defense systems, aerospace engineering, and industrial automation deployments. The United States drives regional demand through strong focus on high-precision actuators, ultrasound transducers, and next-generation navigation technologies. Leading research institutions and material manufacturers emphasize innovation in lead-free ceramics and polymer-based piezoelectric films. Rising adoption of autonomous vehicles and AI-enabled diagnostic equipment further strengthens the market. However, higher manufacturing costs and stringent regulatory compliance influence regional production strategies, prompting a pivot toward specialized high-value applications rather than mass-volume consumer electronics.
Europe
Europe accounts for nearly 12% market share, driven by established automotive production, industrial machinery, and clean energy initiatives. Germany, France, and the United Kingdom lead demand, leveraging piezoelectric components for fuel systems, safety monitoring, and automation. The region acts as a key advocate for environmentally sustainable materials, accelerating adoption of lead-free alternatives in medical and consumer applications. Strong aerospace engineering capabilities also support demand for vibration monitoring and high-performance navigation systems. While growth is moderate compared with Asia Pacific, Europe maintains influence due to technology standardization, innovation in composite materials, and cross-border industrial programs.
Latin America
Latin America captures an estimated 3% share of the global piezoelectric materials market, with gradual adoption driven by growing telecommunications networks, consumer electronics consumption, and industrial modernization. Brazil and Mexico represent the primary markets, supported by increasing manufacturing investments and infrastructure expansion. Opportunities emerge in energy harvesting for remote monitoring, industrial automation, and cost-sensitive automotive applications. However, limited regional production capabilities and competitive import dependencies constrain growth. As multinational OEMs expand operations and digitalization programs scale, the region is positioned for incremental demand, particularly for affordable piezoelectric sensors and transducers in utilities and industrial equipment.
Middle East & Africa
The Middle East & Africa region holds approximately 2% market share, with rising demand linked to smart infrastructure projects, oil and gas monitoring, defense technologies, and healthcare modernization. Gulf economies prioritize technologically advanced sensing systems for power grids, structural diagnostics, and security applications. Africa demonstrates early-stage adoption, influenced by improving telecommunications and renewable energy integration. Limited local manufacturing and reliance on imports restrain rapid growth; however, national investments in advanced medical equipment, aerospace capabilities, and smart city programs gradually expand the addressable market. The region presents long-term potential as equipment digitalization advances across critical industries.
Market Segmentations:
By Material
- Piezoceramics
- PZT (Lead Zirconate Titanate)
- Lead-free Ceramics
- Piezopolymers
- Piezocomposites
By Application
- Actuators
- Motors
- Transducers
- Sensors
- SONAR
- Generators & Transformers
- Acoustic Devices
- Resonators
By End-use Industry
- Automotive
- Healthcare
- IT & Telecom
- Consumer Goods
- Aerospace & Defense
By Geography
- North America
- U.S.
- Canada
- Mexico
- Europe
- Germany
- France
- U.K.
- Italy
- Spain
- Rest of Europe
- Asia Pacific
- China
- Japan
- India
- South Korea
- South-east Asia
- Rest of Asia Pacific
- Latin America
- Brazil
- Argentina
- Rest of Latin America
- Middle East & Africa
- GCC Countries
- South Africa
- Rest of the Middle East and Africa
Competitive Landscape:
The competitive landscape of the piezoelectric materials market is moderately consolidated, characterized by a mix of global ceramics manufacturers, specialty material suppliers, polymer innovators, and component integrators servicing application-specific needs. Leading companies emphasize R&D investments to develop high-performance PZT compositions, lead-free alternatives, and flexible polymer-based piezoelectric films for next-generation electronics and medical devices. Strategic priorities include securing raw material supply chains, scaling cost-efficient production, and forming partnerships with OEMs in automotive, healthcare, aerospace, and consumer electronics. Patent developments in additive manufacturing, nano-engineered composites, and low-temperature sintering enhance differentiation and market entry barriers. Market participants also pursue geographic expansion and mergers to strengthen distribution and reduce regulatory exposure associated with lead-based materials. As demand shifts toward miniaturization, sustainability, and application-specific customization, players that offer diversified portfolios and vertically integrated capabilities maintain competitive advantage.
Key Player Analysis:
- Arkema (France)
- Sparkler Ceramics (India)
- PI Ceramics GmbH (Germany)
- TDK Corporation (Japan)
- APC International, Ltd. (U.S.)
- Solvay (Belgium)
- Piezomechanik GmbH (Germany)
- Hong Kong Piezo Co. Ltd. (China)
- L3Harris Technologies, Inc. (U.S.)
- CeramTec (Germany)
Recent Developments:
- In November 2025, Arkema (France) announced its participation in Formnext 2025 to showcase sustainable, high-performance materials for additive manufacturing reflecting its ongoing investment in polymer-based piezoelectric and functional materials for advanced electronics and printed sensor applications.
- In October 2024, CeramTec unveiled a lead-free piezoceramic composition based on bismuth sodium titanate-barium titanate (BNT-BT), offering an alternative to lead-based PZT without sacrificing performance in many sensor and ultrasonic applications.
Report Coverage:
The research report offers an in-depth analysis based on Material, Application, End-User industry and Geography. It details leading market players, providing an overview of their business, product offerings, investments, revenue streams, and key applications. Additionally, the report includes insights into the competitive environment, SWOT analysis, current market trends, as well as the primary drivers and constraints. Furthermore, it discusses various factors that have driven market expansion in recent years. The report also explores market dynamics, regulatory scenarios, and technological advancements that are shaping the industry. It assesses the impact of external factors and global economic changes on market growth. Lastly, it provides strategic recommendations for new entrants and established companies to navigate the complexities of the market.
Future Outlook:
- Demand for piezoelectric materials will expand with greater automation across manufacturing, logistics, and robotics.
- Adoption of flexible piezoelectric polymers will increase to support wearable electronics and smart textiles.
- Lead-free ceramic development will accelerate due to stricter environmental and regulatory compliance.
- Piezoelectric energy harvesting systems will gain traction as IoT devices shift toward self-powered architectures.
- Miniaturized components will play a critical role in medical implants, microsurgical tools, and diagnostic imaging.
- Aerospace and defense programs will boost investments in precision navigation, SONAR, and vibration monitoring.
- Integration with AI-enabled predictive maintenance platforms will enhance industrial sensing accuracy.
- Consumer electronics will continue driving demand for acoustic components and haptic feedback systems.
- Additive manufacturing and nanostructuring will improve material performance and design flexibility.
- Expansion into smart infrastructure will support deployment in bridge, railway, and structural health monitoring applications.
Request a Free Sample
Fill in your details and we'll send you a free sample report.
- Sample data tables & charts
- Research methodology
Need a Custom Version of This Report?
Tailor the scope, geography, or segments to your exact requirements.
- Custom geography or segment scope
- Direct access to our analyst team
Frequently Asked Questions
What is the current market size for Piezoelectric Materials, and what is its projected size in 2032?
At what Compound Annual Growth Rate is the Piezoelectric Materials market projected to grow between 2024 and 2032?
Which Piezoelectric Materials segment held the largest share in 2024?
What are the primary factors fueling the growth of the Piezoelectric Materials market?
Who are the leading companies in the Piezoelectric Materials market?
Which region commanded the largest share of the Piezoelectric Materials market in 2024?
Table of Content
Chapter 1. Report Introduction
- 1.1 Report Description & Purpose
- 1.1.1 Report Title & Market Definition
- 1.1.2 Unique Selling Propositions (USP) & Key Differentiators
- 1.1.3 Value Proposition for Stakeholders
- 1.2 Research Objectives
- 1.2.1 Market Sizing Objectives (Volume & Revenue)
- 1.2.2 Segmentation Objectives
- 1.2.3 Competitive Intelligence Objectives
- 1.2.4 Forecast & Scenario Objectives
- 1.3 Report Scope
- 1.3.1 Piezoelectric Materials Scope – Types & Subtypes Covered
- 1.3.2 Geographic Scope – Regions & Countries Covered
- 1.3.3 Historical Period, Base Year & Forecast Period (2024; forecast to 2032)
- 1.3.4 Inclusions & Exclusions
- 1.4 HS Code & Classification Framework
- 1.5 Currency, Units & Pricing Basis
- 1.6 Target Stakeholders
- 1.7 Limitations & Assumptions
Chapter 2. Executive Summary
- 2.1 Global Piezoelectric Materials Market Snapshot
- 2.1.1 Market Size – Historical (2024) & Forecast (2024-2032) (2024: USD 4,182.29 million → 2032: USD 7,348.73 million)
- 2.1.2 Volume & Revenue – Global Totals
- 2.1.3 Key Market Highlights – Top Five Facts
- 2.2 Piezoelectric Materials Market Segmentation Snapshot
- 2.2.1 Market Split by Region – 2024 vs. 2032
- 2.3 Competitive Snapshot
- 2.3.1 Top 10 Players by Revenue Share – 2024
- 2.3.2 Top 10 Players by Volume Share – 2024
- 2.3.3 Recent Strategic Developments (18-Month Summary)
- 2.4 Key Investment Highlights & Strategic Conclusions
Chapter 3. Piezoelectric Materials Market Dynamics & Industry Analysis
- 3.1 Market Overview & Context
- 3.1.1 Piezoelectric Materials Market Position in the Broader Automotive Value Chain
- 3.1.2 OEM vs. Replacement Market Dynamics
- 3.1.3 Market Maturity & Development Stage by Region
- 3.2 Piezoelectric Materials Market Drivers
- 3.3 Piezoelectric Materials Market Restraints & Challenges
- 3.4 Piezoelectric Materials Market Opportunities
- 3.5 Porter's Five Forces Analysis
- 3.5.1 Threat of New Entrants
- 3.5.2 Bargaining Power of Suppliers
- 3.5.3 Bargaining Power of Buyers
- 3.5.4 Threat of Substitutes
- 3.5.5 Competitive Rivalry – Intensity Assessment
- 3.6 Piezoelectric Materials Value Chain Analysis
- 3.6.1 Upstream – Raw Material/Input Suppliers
- 3.6.1.1 Raw Material/Input 1
- 3.6.1.2 Raw Material/Input 2
- 3.6.1.3 Raw Material/Input 3
- 3.6.2 Midstream – Production/Manufacturing/Service Delivery
- 3.6.2.1 Production/Process Overview
- 3.6.2.2 Key Facility Locations & Capacity by Manufacturer
- 3.6.3 Downstream – Distribution & End Consumer
- 3.6.3.1 Primary Channel – B2B/OEM
- 3.6.3.2 Secondary Channels – Dealer, Retail, Online, Direct
- 3.6.4 Value Chain Profitability Analysis
- 3.6.1 Upstream – Raw Material/Input Suppliers
- 3.7 PESTEL Analysis
- 3.7.1 Political Factors
- 3.7.2 Economic Factors
- 3.7.3 Social Factors
- 3.7.4 Technological Factors
- 3.7.5 Environmental Factors
- 3.7.6 Legal Factors
- 3.8 Piezoelectric Materials Supply Chain Analysis
- 3.8.1 Raw Material/Input Supply Risk Assessment
- 3.8.2 Manufacturing Concentration Risk (Geographic Exposure)
- 3.8.3 Trade Disruption Impact Analysis
- 3.9 Regulatory & Policy Landscape
Note: The regulatory and policy landscape section covers regulations based on their applicability to the market, Piezoelectric Materials category, geography, and scope of the study. Only regulatory frameworks with a material impact on operations, compliance, trade, sustainability, or market access are analyzed in detail.
Chapter 4. Key Investment Pockets & Opportunity Analysis
- 4.1 Piezoelectric Materials Market Attractiveness Analysis
- 4.1.1 By Region – Investment Attractiveness Matrix (Volume × CAGR)
- 4.2 Absolute Revenue Growth Opportunity
- 4.2.1 By Region – Absolute USD Growth Through 2032
- 4.3 Incremental Volume Opportunity
- 4.3.1 By Region – Incremental Volume Through 2032
- 4.3.2 Segment – Incremental Volume
- 4.4 Emerging Submarket Opportunity Deep Dive (Subject to Applicability)
- 4.5 Emerging Market Opportunity Scorecards
- 4.5.1 United States
- 4.5.2 Europe
- 4.5.3 Asia
- 4.5.4 Middle East & Africa
Note: Emerging Market Opportunity Scorecards will be included based on relevance and strategic importance. Regions listed are indicative and may vary depending on data availability and market dynamics.
Chapter 5. Piezoelectric Materials Import-Export Analysis & Trade Flows
- 5.1 Global Trade Overview
- 5.1.1 Global Export Value by Country (2024)
- 5.1.2 Global Export Volume by Country (2024)
- 5.1.3 Global Import Value by Country (2024)
- 5.1.4 Global Import Volume by Country (2024)
- 5.1.5 Net Trade Balance by Country (2024)
- 5.2 Export Analysis – Segment
- 5.2.1 Type 1 (HS Code)
- 5.2.2 Type 2 (HS Code)
- 5.2.3 Type 3 (HS Code)
- 5.2.4 Type 4 (HS Code)
- 5.2.5 Type 5 (HS Code)
- 5.3 Import Analysis – Segment
- 5.3.1 Type 1 (HS Code)
- 5.3.2 Type 2 (HS Code)
- 5.3.3 Type 3 (HS Code)
- 5.3.4 Type 4 (HS Code)
- 5.3.5 Type 5 (HS Code)
- 5.4 Average Unit Trade Prices
- 5.4.1 Average Export Price – Segment & Country
- 5.4.2 Average Import Price – Segment & Source Country
- 5.4.3 Price Trends (2024)
- 5.5 Key Trade Route Analysis
- 5.5.1 Trade Route 1
- 5.5.2 Trade Route 2
- 5.5.3 Trade Route 3
- 5.5.4 Trade Route 4
- 5.5.5 Trade Route 5
- 5.6 Trade Policy Impact Assessment
- 5.6.1 US Anti-Dumping & Section 301 Tariffs
- 5.6.2 EU Customs Union Impact
- 5.6.3 Major Free Trade Agreements
- 5.6.4 USMCA Rules of Origin
Note: Trade policy analysis will be included only where relevant to the Piezoelectric Materials market.
Chapter 6. Competitive Landscape & Company Benchmarking
- 6.1 Piezoelectric Materials Market Concentration & Structure
- 6.1.1 Herfindahl-Hirschman Index (HHI) – vs. 2024
- 6.1.2 Tier 1, Tier 2 & Tier 3 Market Structure
- 6.1.3 Global, Regional & Local Player Dynamics
- 6.2 Piezoelectric Materials Market Share Analysis – 2024
- 6.2.1 Global Revenue Share by Company
- 6.2.2 Global Volume Share by Company
- 6.2.3 Regional Revenue Share
- 6.2.4 Market Share Evolution ( vs. 2024)
- 6.2.5 OEM Segment Share by Company
- 6.2.6 Replacement Segment Share by Company
- 6.3 Production/Delivery Capacity & Facility Analysis
- 6.3.1 Global Installed Capacity
- 6.3.2 Capacity Utilization Rates
- 6.3.3 Production/Output Volume
- 6.3.4 Facility Locations & Capacity Map
- 6.3.5 Planned Capacity Additions
- 6.4 Piezoelectric Materials Competitive Benchmarking Matrix
- 6.4.1 Revenue, Volume, CAGR & Profitability Comparison
- 6.4.2 Channel Revenue Mix
- 6.4.3 Geographic Revenue Exposure
- 6.4.4 R&D Intensity
- 6.4.5 Sustainability Maturity
- 6.5 Strategic Developments in Piezoelectric Materials (Last 24 Months)
- 6.5.1 Mergers, Acquisitions & Divestments
- 6.5.2 New Piezoelectric Materials Launches
- 6.5.3 Facility Expansions
- 6.5.4 Strategic Alliances, Joint Ventures & Partnerships
- 6.5.5 Distribution Expansion & Market Entry
- 6.5.6 Sustainability & ESG Initiatives
- 6.6 Competitive Strategy Mapping
- 6.6.1 Leader, Challenger, Follower & Niche Classification
- 6.6.2 Pricing Strategy Comparison
- 6.6.3 Channel Strategy Matrix
Note: Strategic developments are included based on their materiality and the availability of reliable information.
Chapter 7. Global Piezoelectric Materials Market – By Distribution Channel
- 7.1 Segment Overview
- 7.1.1 Volume & Revenue Split by Channel (2024 & 2032)
- 7.1.2 Channel Mix Evolution (2024-2032)
Chapter 8. Regional Market Analysis – Global Overview
- 8.1 Global Regional Overview
- 8.1.1 Regional Volume Share
- 8.1.2 Regional Revenue Share
- 8.1.3 Regional Volume by Region
- 8.1.4 Regional Revenue by Region
- 8.1.5 Regional Forecast Through 2032
- 8.2 Cross-Regional Segment Analysis
- 8.2.1 By Distribution Channel
- 8.2.2 By Brand/Price Tier
Chapter 9. North America Piezoelectric Materials Market
- 9.1 United States
- 9.2 Canada
- 9.3 Mexico
Chapter 10. Europe Piezoelectric Materials Market
- 10.1 Germany
- 10.2 France
- 10.3 Italy
- 10.4 United Kingdom
- 10.5 Spain
- 10.6 Poland
- 10.7 Russia
- 10.8 Netherlands
- 10.9 Belgium
- 10.10 Sweden
- 10.11 Denmark
- 10.12 Norway
- 10.13 Rest of Europe
Chapter 11. Asia Pacific Piezoelectric Materials Market
- 11.1 China
- 11.2 India
- 11.3 Japan
- 11.4 South Korea
- 11.5 Thailand
- 11.6 Indonesia
- 11.7 Vietnam
- 11.8 Malaysia
- 11.9 Australia
- 11.10 Rest of Asia Pacific
Chapter 12. Latin America Piezoelectric Materials Market
- 12.1 Brazil
- 12.2 Argentina
- 12.3 Colombia
- 12.4 Chile
- 12.5 Rest of Latin America
Chapter 13. Middle East Piezoelectric Materials Market
- 13.1 Saudi Arabia
- 13.2 United Arab Emirates
- 13.3 Turkey
- 13.4 Israel
- 13.5 Iran
- 13.6 Rest of the Middle East
Chapter 14. Africa Piezoelectric Materials Market
- 14.1 South Africa
- 14.2 Egypt
- 14.3 Nigeria
- 14.4 Morocco
- 14.5 Rest of Africa
Chapter 15. Piezoelectric Materials Company Profiles
- 15.1 [Company 01]
- 15.1.1 Company Overview
- 15.1.2 Key Management Personnel
- 15.1.3 Products & Services Portfolio
- 15.1.4 Financial Performance
- 15.1.5 Key Market Focus & Geographic Presence
- 15.1.6 Recent Developments & Strategic Initiatives
Note: The company profile list is preliminary and may change based on research findings, market developments, data availability, and client requirements.
Chapter 16. Appendices
- Appendix A – List of Abbreviations & Acronyms
- Appendix B – Industry Classification Code Reference – Full Series
- Appendix C – Production & Capacity Data Tables
- Appendix D – End-Use & Demand Base Tables
- Appendix E – Consumption & Replacement Rate Assumptions
- Appendix F – ASP Reference Tables
- Appendix G – Manufacturing & Facility Database
- Appendix H – Import-Export Data Tables
- Appendix I – Regulatory Summary Tables
- Appendix J – Primary Research Participant List (Anonymized)
- Appendix K – Primary Research Questionnaire Framework
- Appendix L – Data Sources & Bibliography
- Appendix M – Market Size Divergence & Source Comparison
Chapter 17. Research Methodology
- 17.1 Research Framework & Philosophy
- 17.2 Secondary Research – Sources, Hierarchy & Data Extraction
- 17.3 Data Modeling – Bottom-Up & Top-Down Market Sizing
- 17.4 Primary Research – Stakeholder Framework, LOI & Sample Sizes
- 17.5 Forecast Methodology – Regression, Scenario & Sensitivity Analysis
- 17.6 Quality Control – Four-Layer Validation Framework
- 17.7 Limitations & Standard Assumptions
- 17.8 Disclaimer
