
Market Overview:
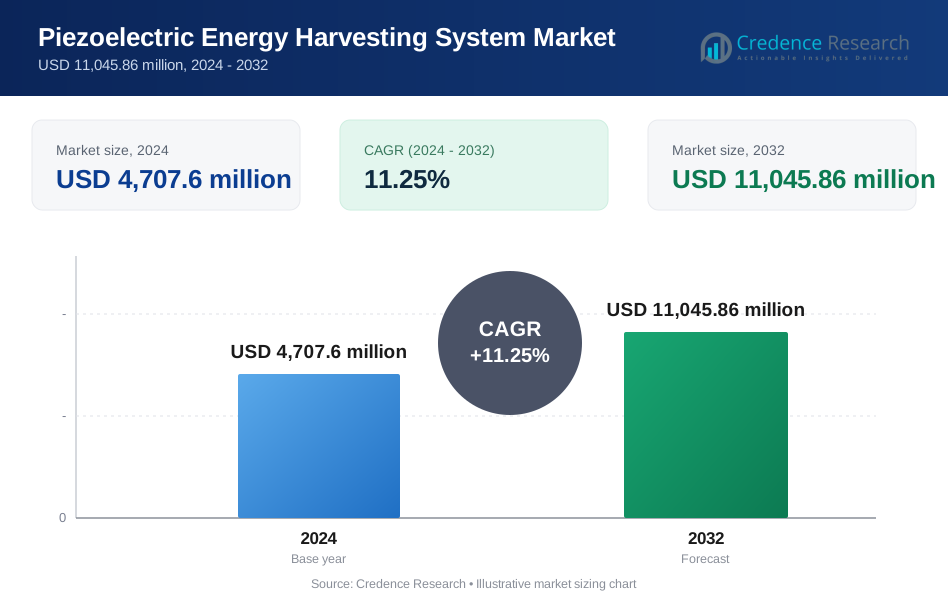
The global piezoelectric energy harvesting system market was valued at USD 4,707.6 million in 2024 and is projected to reach USD 11,045.86 million by 2032, registering a compound annual growth rate (CAGR) of 11.25% during the forecast period.
| REPORT ATTRIBUTE | DETAILS |
|---|---|
| Historical Period | 2020-2023 |
| Base Year | 2024 |
| Forecast Period | 2025-2032 |
|
|
USD 4,707.6 million |
|
|
11.25% |
|
|
USD 11,045.86 million |
The competitive landscape of the piezoelectric energy harvesting system market features a diversified mix of technology providers and material innovation companies, including ABB Ltd., Honeywell International Inc., STMicroelectronics N.V., Texas Instruments Incorporated, EnOcean GmbH, Fujitsu Limited, Bionic Power Inc., Arveni, Convergence Wireless, Cymbet Corporation, Powercast Corporation, Energy Partners, and Voltree Power Inc. These players focus on advancing high-efficiency transducers, flexible piezoelectric materials, and ultra-low-power chipsets for IoT and industrial applications. Asia Pacific leads the global market with approximately 40% share, driven by large-scale electronics manufacturing and smart infrastructure expansion, followed by North America with around 40%, supported by strong R&D and early adoption of autonomous sensor networks.

Market Insights:
- The piezoelectric energy harvesting system market was valued at USD 4,707.6 million in 2024 and is forecast to reach USD 11,045.86 million by 2032, at a CAGR of 11.25%.
- Market drivers include the growing deployment of IoT-enabled wireless sensors, rising adoption of self-powered medical and wearable devices, and increasing demand for maintenance-free monitoring systems in industrial automation and smart infrastructure.
- Emerging trends focus on flexible and printed piezoelectric materials, integration with AI-based predictive maintenance, and expanding use in consumer electronics for motion-powered devices.
- The competitive landscape includes global technology leaders and specialized solution providers emphasizing efficiency improvements, miniaturization, and material advancements to strengthen product portfolios and OEM partnerships.
- Asia Pacific holds about 40% market share, driven by electronics production and smart-city projects; North America follows with 40%, while electromagnetic energy harvesting leads the technology segment, supported by high conversion capability in vibration-rich environments.
Market Segmentation Analysis:
By Technology
The By Technology segment is led by Electromagnetic Energy Harvesting, holding the dominant share due to its higher energy-conversion efficiency and suitability for low-frequency vibration environments such as industrial machinery, motor systems, and automotive applications. Its ability to generate higher power outputs from mechanical movements-without requiring direct sunlight or thermal gradients-drives adoption in condition monitoring, asset tracking, and predictive maintenance ecosystems. Light energy harvesting grows steadily, supported by its relevance in IoT-enabled smart wearables and indoor sensor networks, though efficiency challenges in low-light environments limit its dominance compared to electromagnetic systems.
- For instance, SKF Perpetuum's electromagnetic vibration harvesters generate up to 20 mW to 50 mWof continuous power from machinery vibrations, primarily tuned to specific frequencies around 50 Hz, 60 Hz, or 100 Hz, enabling permanently powered wireless condition-monitoring sensors in rail and manufacturing sectors.
By Component
The By Component segment is dominated by Transducers, accounting for the highest share as they form the core mechanism responsible for converting mechanical stress into usable electrical energy. Demand is driven by growing integration in self-powered wireless sensor nodes, medical implants, and environmental monitoring equipment requiring long operational lifecycles with minimal maintenance. Advancements in high-output piezoelectric ceramics and flexible polymer-based transducers enable improved durability and integration into compact electronic designs. Secondary batteries support system storage requirements but remain supplementary, as transducers define system performance and energy conversion capability.
- For instance, TDK’s PiezoHaptic™ transducers utilize advanced multilayer piezoelectric ceramics that generate up to 5 G acceleration feedback while maintaining thicknesses as low as 35 mm, enabling integration into compact medical wearables and next-generation IoT devices.
Key Growth Drivers:
Surge in IoT Adoption and Self-Powered Device Integration
The rapid expansion of IoT ecosystems across smart manufacturing, healthcare, building automation, and transportation acts as a primary catalyst for piezoelectric energy harvesting systems. As billions of connected devices rely on continuous power for sensing, communication, and data processing, the limitations of conventional batteries-including disposal impact, replacement cost, and restricted lifecycle-have accelerated the shift toward self-sustaining power sources. Piezoelectric harvesting enables maintenance-free operation of wireless sensor networks by converting vibrations, motion, and structural stress into electricity, particularly in industrial settings where machinery-induced vibrations are abundant. This reduces dependency on wired power infrastructure and supports predictive maintenance programs that rely on uninterrupted sensor data. The push toward decentralized, autonomous devices aligns with the technology’s capabilities, making it critical for next-gen smart infrastructure and Industry 4.0 deployments.
- For instance, "Honeywell offers a range of industrial sensing solutions that includeaccelerometer-driven vibration sensors, which are used for predictive maintenance and condition monitoring of machinery.
Growing Adoption in Medical and Wearable Smart Device Applications
Advancements in wearable electronics, implantable biomedical devices, and patient monitoring solutions are driving significant demand for piezoelectric energy harvesting. Devices such as pacemakers, health trackers, and orthopedic implants increasingly require long-lasting, compact power solutions to eliminate surgical battery replacements and enhance user comfort. Piezoelectric materials can generate power from human activities including walking, muscle movement, or even cardiovascular motion, enabling continuous energy supply with minimal risk. The miniaturization of flexible piezoelectric films accelerates adoption in skin-adhesive patches and soft robotics used for rehabilitation, while healthcare digitization continues increasing the volume of connected medical devices. As regulatory frameworks emphasize longevity, safety, and sustainability in medical electronics, piezoelectric energy harvesting emerges as a strategic enabler for next-generation, non-invasive biomedical systems.
- For instance, MicroGen Systems, now part of Wireless Sensor Solutions LLC, developed a piezoelectric MEMS energy harvester capable of producing power in the range of 25-500 µW (depending on frequency and configuration) from low-frequency human/environmental motion, enabling power autonomy for health-monitoring wearables and other wireless sensor networks.
Sustainability Targets and Increasing Global Focus on Energy Efficiency
Environmental sustainability objectives and circular-economy mandates from governments and enterprises are fueling adoption of piezoelectric energy harvesting in industrial and urban infrastructure. Organizations seek to reduce battery waste and operational energy consumption, particularly in remote monitoring systems installed in pipelines, railways, bridges, and telecommunication assets that remain difficult or costly to access. Piezoelectric harvesting supports carbon-reduction goals by capturing ambient mechanical energy that would otherwise dissipate. Integration within smart cities-from traffic systems to structural health sensorsaligns with net-zero timelines and digital infrastructure expansion. As global regulations tighten around hazardous waste management and resource efficiency, piezoelectric systems provide a scalable and eco-aligned approach to powering autonomous technologies.
Key Trends & Opportunities:
Advancements in Flexible and Printed Piezoelectric Materials
Breakthroughs in flexible ceramic-polymer composites, printed piezoelectric surfaces, and nano-engineered materials present substantial opportunities for market expansion. These materials enable integration on curved surfaces, textiles, footwear soles, and implantable biomedical devices, opening new commercialization avenues beyond industrial uses. Progress in additive manufacturing and roll-to-roll printing allows cost-efficient production of lightweight transducers, making mass deployment viable in consumer devices and retail analytics. This trend paves the way for self-powered e-skins, motion-powered wearables, and embedded OEM solutions, contributing to global adoption of unobtrusive, low-maintenance electronics.
- For instance, Royole Corporation’s fully flexible piezoelectric sensor film supports bending radii below 1 mm while maintaining signal integrity for motion-capture and human-machine interface applications.
Integration with AI-Based Predictive Maintenance Platforms
The pairing of piezoelectric energy harvesting with AI-enabled predictive maintenance platforms represents a key strategic trend. By powering vibration and acoustic sensors used to monitor asset health, piezoelectric systems support real-time analytics that extend equipment lifespan and reduce downtime. As heavy industries transition from calendar-based servicing to condition-based maintenance, sensor uptime becomes mission-critical, creating strong demand for autonomous power sources. The emergence of digital twins, edge analytics, and cloud-based diagnostics enhances value creation and further positions piezoelectric harvesting as a cornerstone technology for intelligent industrial operations.
- For instance, Siemens’ Senseye Predictive Maintenance platform enables AI-driven machine diagnostics capable of reducing unplanned downtime by up to 50%, with real-time data supported by autonomous vibration-powered sensors.
Key Challenges:
High Material Costs and Manufacturing Complexity
Despite strong functional advantages, the market faces cost constraints driven by the complexity of producing high-efficiency piezoelectric materials such as PZT ceramics and advanced composites. Precision manufacturing, high sintering temperatures, and specialized fabrication equipment increase production expenditures, limiting price competitiveness against conventional lithium batteries for low-cost applications. Companies deploying large-scale sensor networks may face higher capital investment compared to traditional power solutions. Achieving cost parity requires scaling production, improving material yields, and maturing manufacturing ecosystems across Asia and Europe while regulatory restrictions on lead-based ceramics introduce additional compliance challenges.
Limited Power Output for High-Demand Applications
While effective for low-power electronics, piezoelectric energy harvesting currently delivers limited output for devices requiring continuous or high-voltage power. This restricts adoption in energy-intensive applications such as industrial robotics, autonomous vehicles, security systems, and high-bandwidth communication devices. Environmental dependency-where inconsistent or insufficient vibration sources reduce energy generation-further complicates deployment in static or low-activity settings. Energy storage integration remains essential to stabilize output, but adds cost and design complexity. To unlock larger commercial opportunities, the industry must improve conversion efficiency, develop hybrid harvesting models, and optimize system architecture for variable operating conditions.
Regional Analysis:
North America
North America accounts for roughly 40 % of the global piezoelectric energy harvesting market. The region leads due to its mature industrial base, robust R&D ecosystem, and high adoption of smart infrastructure, IoT and wireless sensor networks in sectors such as aerospace, healthcare, and industrial automation. Regulatory support for energy-efficient systems and strong innovation pipelines empower rapid commercialization of advanced piezoelectric solutions. The presence of major market players and investment in next-generation technologies further consolidates North America’s market dominance.
Asia Pacific
Asia Pacific contributes roughly 35 % of the global market share and represents the fastest-growing region. Rapid industrialization, rising consumer electronics manufacturing, and expanding smart-city and infrastructure projects fuel demand for maintenance-free, self-powered sensor solutions. Growth in countries such as China, India, Japan, and Southeast-Asia-with government backing for renewable energy adoption-drives deployment across industrial automation, wearables, and IoT networks. This combination of high demand, favorable policies, and large-scale adoption positions Asia Pacific as the primary growth engine globally.
Europe
Europe holds about 25 % of the global market for piezoelectric harvesting systems. The region’s share rests on strong environmental regulations, emphasis on energy-efficient systems, and widespread adoption of sensor-based automation in manufacturing, utilities, building systems, and transportation. Western European nations-driven by sustainability and smart-infrastructure initiatives-lead the adoption, while gradually, other parts of Europe contribute as industrial modernization spreads. Investment in green technologies and IoT-enabled infrastructure supports stable demand and market growth across the region.
Latin America
Latin America accounts for about 5 % of the global piezoelectric market share. The region remains at an early adoption stage, yet growing interest in energy-efficient and low-maintenance power solutions for infrastructure monitoring, agriculture, and utilities is gradually driving demand. As governments and private stakeholders increasingly invest in modernization and energy sustainability, piezoelectric energy harvesting presents a viable option for remote or distributed installations where traditional power sources are impractical. Market growth here remains modest but carries promising long-term potential.
Middle East & Africa
The Middle East & Africa region contributes approximately 3 % of the global market share. Adoption remains limited, but pockets of growth emerge in infrastructure monitoring, utility management and remote installations where grid-independent power solutions are valuable. Rising interest in sustainable and autonomous energy systems-especially for remote or off-grid deployment-provides niche opportunities. However, slower economic diversification, lower technology penetration and limited awareness across large parts of the region constrain widespread adoption in the near to medium term.
Market Segmentations:
By Technology
- Light Energy Harvesting
- Electromagnetic Energy Harvesting
By Component
- Transducers
- Secondary Batteries
By Geography
- North America
- U.S.
- Canada
- Mexico
- Europe
- Germany
- France
- U.K.
- Italy
- Spain
- Rest of Europe
- Asia Pacific
- China
- Japan
- India
- South Korea
- South-east Asia
- Rest of Asia Pacific
- Latin America
- Brazil
- Argentina
- Rest of Latin America
- Middle East & Africa
- GCC Countries
- South Africa
- Rest of the Middle East and Africa
Competitive Landscape:
The competitive landscape of the piezoelectric energy harvesting system market is characterized by a mix of established electronics manufacturers, material science innovators, and specialized energy harvesting solution providers focusing on high-efficiency and miniature power systems. Companies compete on the basis of material performance, output efficiency, device integration capability, and application-specific customization targeting industrial IoT, healthcare, automotive, and consumer electronics. Strategic priorities include improving conversion efficiency of piezoelectric materials, expanding flexible and printed device portfolios, and scaling cost-effective manufacturing to support mass deployment. Partnerships with sensor manufacturers, OEMs, and infrastructure solution providers play a critical role in securing long-term contracts and accelerating product commercialization. Additionally, intellectual property protection and advancements in ceramic-polymer composite technologies form a key differentiator, while mergers and research collaborations reinforce global positioning in this rapidly evolving market.
Key Player Analysis:
- ABB Ltd.
- Bionic Power Inc.
- Cymbet Corporation
- Arveni
- Fujitsu Limited
- STMicroelectronics N.V.
- Convergence Wireless
- Honeywell International Inc.
- Powercast Corporation
- EnOcean GmbH
Recent Developments:
- In July 2025, Powercast announced new sustainable wireless power solutions designed to eliminate disposable batteries in IoT devices, emphasizing battery-free operation for a wide range of sensors and reducing e-waste in large-scale deployments.
- In January 2025, Powercast unveiled a suite of wirelessly-powered products at CES 2025, showcasing over-the-air RF charging and magnetic-resonance based power transfer that aim to supply dozens of devices simultaneously without batteries or wires.
- In March 2024, STMicroelectronics launched an “energy harvesting microcontroller” targeting ultra-low power IoT devices, signaling a push toward self-powered sensors and systems.
Report Coverage:
The research report offers an in-depth analysis based on Technology, Component and Geography. It details leading market players, providing an overview of their business, product offerings, investments, revenue streams, and key applications. Additionally, the report includes insights into the competitive environment, SWOT analysis, current market trends, as well as the primary drivers and constraints. Furthermore, it discusses various factors that have driven market expansion in recent years. The report also explores market dynamics, regulatory scenarios, and technological advancements that are shaping the industry. It assesses the impact of external factors and global economic changes on market growth. Lastly, it provides strategic recommendations for new entrants and established companies to navigate the complexities of the market.
Future Outlook:
- Adoption will increase as demand rises for self-powered IoT and wireless sensor networks.
- Flexible and printed piezoelectric materials will enable new wearable and biomedical applications.
- Integration with AI and digital-twin monitoring will enhance predictive maintenance capabilities.
- Miniaturized transducers will support growth in compact consumer electronics and smart wearables.
- Industrial automation and smart factories will accelerate deployment in vibration-rich environments.
- Smart city infrastructure will utilize piezoelectric harvesting for traffic, utilities, and structural monitoring.
- Hybrid harvesting systems combining piezoelectric with solar or thermal will expand use cases.
- Medical implants and health-monitoring devices will rely more on motion-powered systems.
- Sustainability goals and battery waste reduction will drive regulatory alignment and adoption.
- Technological advancements will reduce material costs and improve conversion efficiency for wider commercialization.
Request a Free Sample
Fill in your details and we'll send you a free sample report.
- Sample data tables & charts
- Research methodology
Need a Custom Version of This Report?
Tailor the scope, geography, or segments to your exact requirements.
- Custom geography or segment scope
- Direct access to our analyst team
Frequently Asked Questions
What is the current market size for the Piezoelectric Energy Harvesting System market, and what is its projected size in 2032?
At what Compound Annual Growth Rate is the Piezoelectric Energy Harvesting System market expected to grow between 2024 and 2032?
Which Piezoelectric Energy Harvesting System segment held the largest share in 2024?
What are the primary factors fueling the growth of the Piezoelectric Energy Harvesting System market?
Who are the leading companies in the Piezoelectric Energy Harvesting System market?
Table of Content
Chapter 1. Report Introduction
- 1.1 Report Description & Purpose
- 1.1.1 Report Title & Market Definition
- 1.1.2 Unique Selling Propositions (USP) & Key Differentiators
- 1.1.3 Value Proposition for Stakeholders
- 1.2 Research Objectives
- 1.2.1 Market Sizing Objectives (Volume & Revenue)
- 1.2.2 Segmentation Objectives
- 1.2.3 Competitive Intelligence Objectives
- 1.2.4 Forecast & Scenario Objectives
- 1.3 Report Scope
- 1.3.1 Piezoelectric Energy Harvesting System Scope – Types & Subtypes Covered
- 1.3.2 Geographic Scope – Regions & Countries Covered
- 1.3.3 Historical Period, Base Year & Forecast Period (2024; forecast to 2032)
- 1.3.4 Inclusions & Exclusions
- 1.4 HS Code & Classification Framework
- 1.5 Currency, Units & Pricing Basis
- 1.6 Target Stakeholders
- 1.7 Limitations & Assumptions
Chapter 2. Executive Summary
- 2.1 Global Piezoelectric Energy Harvesting System Market Snapshot
- 2.1.1 Market Size – Historical (2024) & Forecast (2024-2032) (2024: USD 4,707.6 million → 2032: USD 11,045.86 million)
- 2.1.2 Volume & Revenue – Global Totals
- 2.1.3 Key Market Highlights – Top Five Facts
- 2.2 Piezoelectric Energy Harvesting System Market Segmentation Snapshot
- 2.2.1 Market Split by Region – 2024 vs. 2032
- 2.3 Competitive Snapshot
- 2.3.1 Top 10 Players by Revenue Share – 2024
- 2.3.2 Top 10 Players by Volume Share – 2024
- 2.3.3 Recent Strategic Developments (18-Month Summary)
- 2.4 Key Investment Highlights & Strategic Conclusions
Chapter 3. Piezoelectric Energy Harvesting System Market Dynamics & Industry Analysis
- 3.1 Market Overview & Context
- 3.1.1 Piezoelectric Energy Harvesting System Market Position in the Broader Automotive Value Chain
- 3.1.2 OEM vs. Replacement Market Dynamics
- 3.1.3 Market Maturity & Development Stage by Region
- 3.2 Piezoelectric Energy Harvesting System Market Drivers
- 3.3 Piezoelectric Energy Harvesting System Market Restraints & Challenges
- 3.4 Piezoelectric Energy Harvesting System Market Opportunities
- 3.5 Porter's Five Forces Analysis
- 3.5.1 Threat of New Entrants
- 3.5.2 Bargaining Power of Suppliers
- 3.5.3 Bargaining Power of Buyers
- 3.5.4 Threat of Substitutes
- 3.5.5 Competitive Rivalry – Intensity Assessment
- 3.6 Piezoelectric Energy Harvesting System Value Chain Analysis
- 3.6.1 Upstream – Raw Material/Input Suppliers
- 3.6.1.1 Raw Material/Input 1
- 3.6.1.2 Raw Material/Input 2
- 3.6.1.3 Raw Material/Input 3
- 3.6.2 Midstream – Production/Manufacturing/Service Delivery
- 3.6.2.1 Production/Process Overview
- 3.6.2.2 Key Facility Locations & Capacity by Manufacturer
- 3.6.3 Downstream – Distribution & End Consumer
- 3.6.3.1 Primary Channel – B2B/OEM
- 3.6.3.2 Secondary Channels – Dealer, Retail, Online, Direct
- 3.6.4 Value Chain Profitability Analysis
- 3.6.1 Upstream – Raw Material/Input Suppliers
- 3.7 PESTEL Analysis
- 3.7.1 Political Factors
- 3.7.2 Economic Factors
- 3.7.3 Social Factors
- 3.7.4 Technological Factors
- 3.7.5 Environmental Factors
- 3.7.6 Legal Factors
- 3.8 Piezoelectric Energy Harvesting System Supply Chain Analysis
- 3.8.1 Raw Material/Input Supply Risk Assessment
- 3.8.2 Manufacturing Concentration Risk (Geographic Exposure)
- 3.8.3 Trade Disruption Impact Analysis
- 3.9 Regulatory & Policy Landscape
Note: The regulatory and policy landscape section covers regulations based on their applicability to the market, Piezoelectric Energy Harvesting System category, geography, and scope of the study. Only regulatory frameworks with a material impact on operations, compliance, trade, sustainability, or market access are analyzed in detail.
Chapter 4. Key Investment Pockets & Opportunity Analysis
- 4.1 Piezoelectric Energy Harvesting System Market Attractiveness Analysis
- 4.1.1 By Region – Investment Attractiveness Matrix (Volume × CAGR)
- 4.2 Absolute Revenue Growth Opportunity
- 4.2.1 By Region – Absolute USD Growth Through 2032
- 4.3 Incremental Volume Opportunity
- 4.3.1 By Region – Incremental Volume Through 2032
- 4.3.2 Segment – Incremental Volume
- 4.4 Emerging Submarket Opportunity Deep Dive (Subject to Applicability)
- 4.5 Emerging Market Opportunity Scorecards
- 4.5.1 United States
- 4.5.2 Europe
- 4.5.3 Asia
- 4.5.4 Middle East & Africa
Note: Emerging Market Opportunity Scorecards will be included based on relevance and strategic importance. Regions listed are indicative and may vary depending on data availability and market dynamics.
Chapter 5. Piezoelectric Energy Harvesting System Import-Export Analysis & Trade Flows
- 5.1 Global Trade Overview
- 5.1.1 Global Export Value by Country (2024)
- 5.1.2 Global Export Volume by Country (2024)
- 5.1.3 Global Import Value by Country (2024)
- 5.1.4 Global Import Volume by Country (2024)
- 5.1.5 Net Trade Balance by Country (2024)
- 5.2 Export Analysis – Segment
- 5.2.1 Type 1 (HS Code)
- 5.2.2 Type 2 (HS Code)
- 5.2.3 Type 3 (HS Code)
- 5.2.4 Type 4 (HS Code)
- 5.2.5 Type 5 (HS Code)
- 5.3 Import Analysis – Segment
- 5.3.1 Type 1 (HS Code)
- 5.3.2 Type 2 (HS Code)
- 5.3.3 Type 3 (HS Code)
- 5.3.4 Type 4 (HS Code)
- 5.3.5 Type 5 (HS Code)
- 5.4 Average Unit Trade Prices
- 5.4.1 Average Export Price – Segment & Country
- 5.4.2 Average Import Price – Segment & Source Country
- 5.4.3 Price Trends (2024)
- 5.5 Key Trade Route Analysis
- 5.5.1 Trade Route 1
- 5.5.2 Trade Route 2
- 5.5.3 Trade Route 3
- 5.5.4 Trade Route 4
- 5.5.5 Trade Route 5
- 5.6 Trade Policy Impact Assessment
- 5.6.1 US Anti-Dumping & Section 301 Tariffs
- 5.6.2 EU Customs Union Impact
- 5.6.3 Major Free Trade Agreements
- 5.6.4 USMCA Rules of Origin
Note: Trade policy analysis will be included only where relevant to the Piezoelectric Energy Harvesting System market.
Chapter 6. Competitive Landscape & Company Benchmarking
- 6.1 Piezoelectric Energy Harvesting System Market Concentration & Structure
- 6.1.1 Herfindahl-Hirschman Index (HHI) – vs. 2024
- 6.1.2 Tier 1, Tier 2 & Tier 3 Market Structure
- 6.1.3 Global, Regional & Local Player Dynamics
- 6.2 Piezoelectric Energy Harvesting System Market Share Analysis – 2024
- 6.2.1 Global Revenue Share by Company
- 6.2.2 Global Volume Share by Company
- 6.2.3 Regional Revenue Share
- 6.2.4 Market Share Evolution ( vs. 2024)
- 6.2.5 OEM Segment Share by Company
- 6.2.6 Replacement Segment Share by Company
- 6.3 Production/Delivery Capacity & Facility Analysis
- 6.3.1 Global Installed Capacity
- 6.3.2 Capacity Utilization Rates
- 6.3.3 Production/Output Volume
- 6.3.4 Facility Locations & Capacity Map
- 6.3.5 Planned Capacity Additions
- 6.4 Piezoelectric Energy Harvesting System Competitive Benchmarking Matrix
- 6.4.1 Revenue, Volume, CAGR & Profitability Comparison
- 6.4.2 Channel Revenue Mix
- 6.4.3 Geographic Revenue Exposure
- 6.4.4 R&D Intensity
- 6.4.5 Sustainability Maturity
- 6.5 Strategic Developments in Piezoelectric Energy Harvesting System (Last 24 Months)
- 6.5.1 Mergers, Acquisitions & Divestments
- 6.5.2 New Piezoelectric Energy Harvesting System Launches
- 6.5.3 Facility Expansions
- 6.5.4 Strategic Alliances, Joint Ventures & Partnerships
- 6.5.5 Distribution Expansion & Market Entry
- 6.5.6 Sustainability & ESG Initiatives
- 6.6 Competitive Strategy Mapping
- 6.6.1 Leader, Challenger, Follower & Niche Classification
- 6.6.2 Pricing Strategy Comparison
- 6.6.3 Channel Strategy Matrix
Note: Strategic developments are included based on their materiality and the availability of reliable information.
Chapter 7. Global Piezoelectric Energy Harvesting System Market – By Distribution Channel
- 7.1 Segment Overview
- 7.1.1 Volume & Revenue Split by Channel (2024 & 2032)
- 7.1.2 Channel Mix Evolution (2024-2032)
Chapter 8. Regional Market Analysis – Global Overview
- 8.1 Global Regional Overview
- 8.1.1 Regional Volume Share
- 8.1.2 Regional Revenue Share
- 8.1.3 Regional Volume by Region
- 8.1.4 Regional Revenue by Region
- 8.1.5 Regional Forecast Through 2032
- 8.2 Cross-Regional Segment Analysis
- 8.2.1 By Distribution Channel
- 8.2.2 By Brand/Price Tier
Chapter 9. North America Piezoelectric Energy Harvesting System Market
- 9.1 United States
- 9.2 Canada
- 9.3 Mexico
Chapter 10. Europe Piezoelectric Energy Harvesting System Market
- 10.1 Germany
- 10.2 France
- 10.3 Italy
- 10.4 United Kingdom
- 10.5 Spain
- 10.6 Poland
- 10.7 Russia
- 10.8 Netherlands
- 10.9 Belgium
- 10.10 Sweden
- 10.11 Denmark
- 10.12 Norway
- 10.13 Rest of Europe
Chapter 11. Asia Pacific Piezoelectric Energy Harvesting System Market
- 11.1 China
- 11.2 India
- 11.3 Japan
- 11.4 South Korea
- 11.5 Thailand
- 11.6 Indonesia
- 11.7 Vietnam
- 11.8 Malaysia
- 11.9 Australia
- 11.10 Rest of Asia Pacific
Chapter 12. Latin America Piezoelectric Energy Harvesting System Market
- 12.1 Brazil
- 12.2 Argentina
- 12.3 Colombia
- 12.4 Chile
- 12.5 Rest of Latin America
Chapter 13. Middle East Piezoelectric Energy Harvesting System Market
- 13.1 Saudi Arabia
- 13.2 United Arab Emirates
- 13.3 Turkey
- 13.4 Israel
- 13.5 Iran
- 13.6 Rest of the Middle East
Chapter 14. Africa Piezoelectric Energy Harvesting System Market
- 14.1 South Africa
- 14.2 Egypt
- 14.3 Nigeria
- 14.4 Morocco
- 14.5 Rest of Africa
Chapter 15. Piezoelectric Energy Harvesting System Company Profiles
- 15.1 [Company 01]
- 15.1.1 Company Overview
- 15.1.2 Key Management Personnel
- 15.1.3 Products & Services Portfolio
- 15.1.4 Financial Performance
- 15.1.5 Key Market Focus & Geographic Presence
- 15.1.6 Recent Developments & Strategic Initiatives
Note: The company profile list is preliminary and may change based on research findings, market developments, data availability, and client requirements.
Chapter 16. Appendices
- Appendix A – List of Abbreviations & Acronyms
- Appendix B – Industry Classification Code Reference – Full Series
- Appendix C – Production & Capacity Data Tables
- Appendix D – End-Use & Demand Base Tables
- Appendix E – Consumption & Replacement Rate Assumptions
- Appendix F – ASP Reference Tables
- Appendix G – Manufacturing & Facility Database
- Appendix H – Import-Export Data Tables
- Appendix I – Regulatory Summary Tables
- Appendix J – Primary Research Participant List (Anonymized)
- Appendix K – Primary Research Questionnaire Framework
- Appendix L – Data Sources & Bibliography
- Appendix M – Market Size Divergence & Source Comparison
Chapter 17. Research Methodology
- 17.1 Research Framework & Philosophy
- 17.2 Secondary Research – Sources, Hierarchy & Data Extraction
- 17.3 Data Modeling – Bottom-Up & Top-Down Market Sizing
- 17.4 Primary Research – Stakeholder Framework, LOI & Sample Sizes
- 17.5 Forecast Methodology – Regression, Scenario & Sensitivity Analysis
- 17.6 Quality Control – Four-Layer Validation Framework
- 17.7 Limitations & Standard Assumptions
- 17.8 Disclaimer
