Market Overview
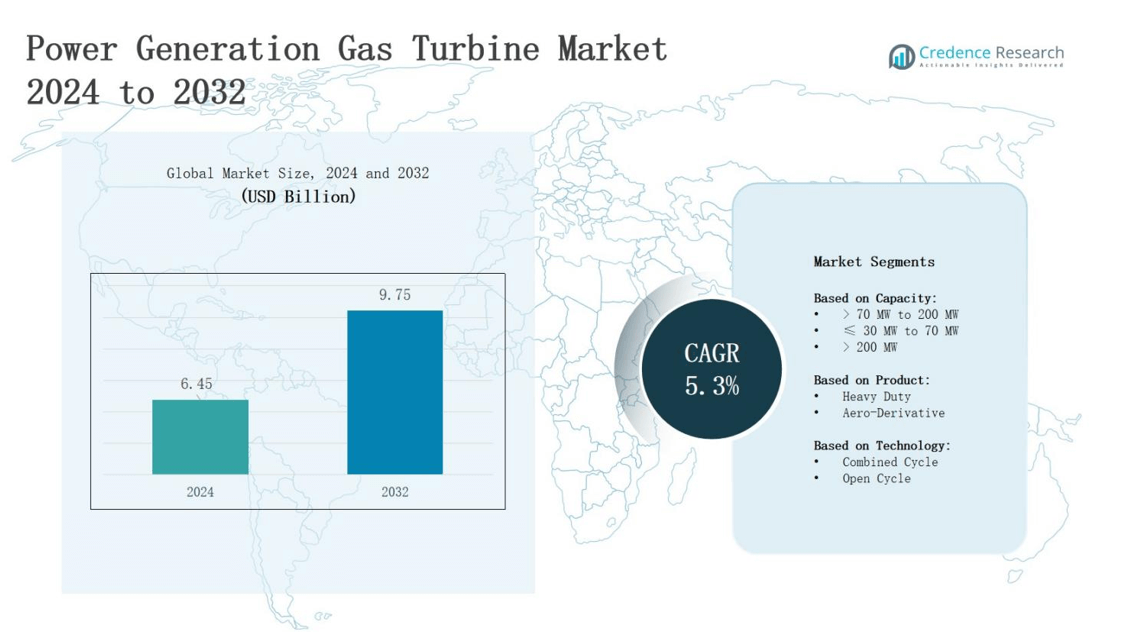
In the power generation gas turbine market, revenue is projected to grow from USD 6.45 billion in 2024 to USD 9.75 billion by 2032, registering a CAGR of 5.3%.
| REPORT ATTRIBUTE | DETAILS |
|---|---|
| Historical Period | 2020-2023 |
| Base Year | 2024 |
| Forecast Period | 2025-2032 |
| Power Generation Gas Turbine Market Size 2024 | USD 6.45 billion |
| Power Generation Gas Turbine Market, CAGR | 5.3% |
| Power Generation Gas Turbine Market Size 2032 | USD 9.75 billion |
The power generation gas turbine market is driven by the rising demand for reliable and efficient electricity generation across industrial and commercial sectors. Increasing investments in renewable energy integration and combined-cycle power plants enhance turbine adoption, while technological advancements in high-efficiency and low-emission turbines reduce operational costs and environmental impact. Market trends include the development of advanced aeroderivative and heavy-duty gas turbines, the growing focus on digital monitoring and predictive maintenance, and the shift toward flexible and decentralized power generation solutions. These factors collectively propel market growth, supporting both sustainability goals and the need for uninterrupted power supply globally.
The power generation gas turbine market demonstrates strong regional diversity, with North America holding 32% market share, Europe 27%, Asia-Pacific 25%, and the Rest of the World 16%. Key players including GE Vernova, Siemens, Mitsubishi Heavy Industries, Rolls Royce, Bharat Heavy Electricals Limited (BHEL), Ansaldo Energia, Kawasaki Heavy Industries, MAN Energy Solutions, Opra Turbines, Solar Turbines, Harbin Electric, JSC United Engine, and Flex Energy Solutions operate across these regions. It leverages technological innovation, high-efficiency designs, and low-emission solutions to meet regional energy demand and regulatory requirements while expanding global market presence.
Market Insights
- In the power generation gas turbine market, revenue is projected to grow from USD 6.45 billion in 2024 to USD 9.75 billion by 2032, registering a CAGR of 5.3%, driven by rising demand for reliable and efficient electricity across industrial and commercial sectors.
- The >70 MW to 200 MW capacity segment dominates with a 42% share, offering high efficiency and moderate capital investment, while ≤30 MW to 70 MW holds 28% and >200 MW 30%, supporting medium and large-scale projects.
- Heavy-duty turbines lead with a 55% share due to robust performance and long lifespan, while aero-derivative turbines account for 45%, offering fast start-up and flexible operation for peaking applications.
- Combined cycle technology commands 60% of the market, maximizing energy output and reducing emissions, whereas open cycle turbines hold 40%, preferred for peaking applications and variable power demand locations.
- North America captures 32% market share, Europe 27%, Asia-Pacific 25%, and Rest of the World 16%, with key players driving growth through innovation, efficiency, low-emission solutions, and global expansion.
Market Drivers
Rising Demand for Efficient Power Generation
The power generation gas turbine market experiences strong growth due to increasing demand for reliable electricity across industrial, commercial, and residential sectors. It supports combined-cycle and cogeneration plants, which enhance fuel efficiency and overall power output. Rising urbanization and industrialization drive governments and private enterprises to invest in modern power infrastructure. It also enables utilities to maintain grid stability while meeting peak energy requirements. High-efficiency turbines reduce fuel consumption and operational expenses, making it a preferred solution. Continuous modernization of aging power plants further strengthens market adoption.
- For instance, in 2023 Mitsubishi Power delivered M701JAC turbines to a 1,600 MW power project in Thailand, which are designed for over 64% efficiency in combined-cycle use, enabling significant reductions in fuel consumption compared to older units.
Technological Advancements in Gas Turbines
Rapid innovations in turbine design and materials propel market growth. The power generation gas turbine market benefits from advanced aerodynamics, high-temperature alloys, and digital control systems, which enhance performance and lifespan. It provides low-emission solutions that comply with stringent environmental regulations, attracting environmentally conscious stakeholders. Manufacturers implement predictive maintenance technologies to minimize operational risks and optimize efficiency. These innovations increase the versatility of turbines across multiple fuel types, including natural gas and biofuels. It also supports modular designs, allowing flexible capacity expansion.
Integration with Renewable Energy Sources
Increasing renewable energy integration drives demand for flexible and responsive gas turbines. The power generation gas turbine market plays a crucial role in balancing intermittent energy output from solar and wind sources. It provides fast-start capabilities, allowing utilities to respond to fluctuating demand and maintain grid reliability. Operators rely on it for hybrid systems that combine conventional and renewable generation. Modern turbines deliver high efficiency during partial load operations, making it suitable for renewable-heavy grids. It also reduces reliance on fossil fuels while ensuring consistent power supply. Investments in hybrid and microgrid projects further expand market opportunities.
- For instance, General Electric (GE) deployed its LM6000 gas turbine at the Inland Empire Energy Center in California, enabling rapid ramp-up cycles to balance variable solar generation and prevent blackouts during peak demand.
Government Initiatives and Policy Support
Government regulations and incentives significantly support turbine adoption. The power generation gas turbine market benefits from policies promoting low-emission and high-efficiency power plants. It receives backing through subsidies, tax incentives, and grants for modernization projects. Governments encourage private investment in clean energy infrastructure, increasing turbine installations. Strict environmental compliance standards drive the replacement of outdated, inefficient equipment. It also supports energy security objectives by ensuring diversified and reliable electricity generation. Policy-driven funding and strategic initiatives accelerate market penetration and technological advancements.
Market Trends
Adoption of Advanced Turbine Designs
The power generation gas turbine market experiences growth due to adoption of advanced turbine designs that enhance efficiency and reliability. Manufacturers focus on high-temperature alloys, improved aerodynamics, and lightweight components to boost performance. It enables operators to reduce fuel consumption and extend equipment lifespan. Modular and compact designs support flexible installations and scalable power output. Operators rely on it for both new plants and retrofitting older units. Digital control systems improve operational precision and stability, strengthening overall grid performance. Advanced turbines also facilitate compliance with stringent emission regulations, enhancing environmental sustainability.
- For instance, Siemens Energy’s SGT-800 turbine offers modular configurations that allow operators to adjust from 50 to 62 MW, making it widely used for industrial power as well as combined heat and power (CHP) systems.
Focus on Low-Emission and Sustainable Solutions
Low-emission technologies drive market trends in the power generation gas turbine market. Turbines integrate dry low NOx combustion systems and advanced cooling methods to meet environmental standards. It supports natural gas, hydrogen blending, and alternative fuels, reducing carbon footprint. Operators prefer turbines that balance efficiency with environmental compliance to satisfy regulatory requirements. Continuous research enhances emissions control and fuel flexibility. It plays a critical role in enabling sustainable energy strategies for utilities. Adoption of low-emission turbines aligns with global initiatives for cleaner power generation and decarbonization.
- For instance, Mitsubishi Power’s turbines support up to 30% hydrogen blending while maintaining low NOx emissions, and Siemens Energy’s SGT-800 turbines use advanced dry low NOx systems for efficient, fuel-flexible operation.
Integration with Renewable and Hybrid Systems
The power generation gas turbine market benefits from integration with renewable and hybrid energy systems. It provides fast-start and load-following capabilities, complementing intermittent energy sources such as solar and wind. Operators deploy it to stabilize grid fluctuations and maintain consistent electricity supply. Hybrid configurations combine conventional and renewable power, improving overall system efficiency. It allows efficient energy storage integration and peak demand management. Digital monitoring optimizes performance in hybrid setups. Flexible operation supports emerging microgrid and decentralized energy projects globally, expanding market opportunities.
Emphasis on Digitalization and Predictive Maintenance
Digitalization trends shape the power generation gas turbine market by enhancing operational efficiency. It integrates predictive maintenance, real-time monitoring, and analytics to reduce downtime and optimize performance. Advanced sensors track temperature, vibration, and pressure, enabling proactive interventions. Operators utilize it to improve turbine reliability and extend service life. Cloud-based platforms and AI tools support data-driven decision-making. It ensures consistent power delivery while lowering operational costs. Digital solutions also facilitate remote supervision, strengthening turbine management in complex power networks.
Market Challenges Analysis
High Capital Investment and Operational Costs
The power generation gas turbine market faces challenges due to high capital investment requirements for purchasing and installing advanced turbines. It demands substantial expenditure on infrastructure, commissioning, and integration with existing power plants. Maintenance and spare parts also incur significant costs, impacting overall project economics. Operators must allocate skilled personnel and specialized tools to ensure optimal performance. Long payback periods discourage small and medium-scale investors from adopting it. Fluctuating fuel prices further increase operational uncertainty. These financial constraints limit rapid market expansion, particularly in developing regions.
Regulatory Compliance and Environmental Constraints
Strict environmental regulations and emission standards challenge the power generation gas turbine market. It must adhere to limits on NOx, CO, and CO₂ emissions while maintaining efficiency and reliability. Retrofitting older turbines to meet compliance standards requires additional investment and technical expertise. Operators face penalties and operational restrictions if turbines fail to comply. Limited availability of low-emission fuels and infrastructure can constrain adoption. The market also experiences pressure from evolving policies that prioritize renewable energy over conventional gas-based generation. These regulatory and environmental pressures slow deployment and increase operational complexity.
Market Opportunities
Expansion in Emerging Economies
The power generation gas turbine market presents significant opportunities in emerging economies experiencing rapid industrialization and urbanization. It offers reliable and efficient electricity solutions to meet growing energy demand. Governments in these regions provide incentives and favorable policies to support modern power infrastructure. It enables private and public utilities to upgrade aging plants and enhance grid stability. Increasing investments in industrial parks and commercial complexes further drive turbine adoption. Operators leverage it to reduce fuel costs and improve operational efficiency. Expanding electricity access in rural and semi-urban areas also creates new market avenues.
Adoption of Hybrid and Renewable-Compatible Systems
The power generation gas turbine market benefits from opportunities in hybrid and renewable-compatible energy systems. It integrates with solar, wind, and energy storage solutions to provide consistent and flexible power supply. Utilities rely on it to manage intermittent renewable output and peak demand fluctuations efficiently. It supports hydrogen blending and alternative fuel applications, promoting low-emission energy generation. Advanced digital monitoring and predictive maintenance improve operational reliability and cost-effectiveness. Growing global emphasis on sustainable energy encourages further deployment. These opportunities allow operators to expand market presence while contributing to cleaner and more resilient power systems.
Market Segmentation Analysis:
By Capacity
In the power generation gas turbine market, the >70 MW to 200 MW capacity segment dominates with a market share of approximately 42%, driven by its balance of high efficiency and moderate capital investment. It caters to industrial plants and medium-sized power projects that require reliable and cost-effective generation. The ≤30 MW to 70 MW segment accounts for 28%, appealing to decentralized and smaller commercial installations. The >200 MW segment holds 30%, preferred in large-scale utility projects and combined-cycle plants. Rising industrialization and expanding grid infrastructure support growth across all capacity ranges.
- For instance, General Electric's smaller heavy-duty turbines in this capacity are favored in offshore oil and gas platforms due to their lightweight design.
By Product
The heavy-duty turbine segment leads the power generation gas turbine market with a 55% share, favored for large-scale and continuous power operations. It provides robust performance, extended lifespan, and higher efficiency under sustained load conditions. Aero-derivative turbines hold 45% of the market, appealing to applications requiring fast start-up and flexible operation, including peaking power plants and emergency backup systems. Both segments benefit from technological advancements and low-emission designs. Increasing demand for reliable and flexible power generation drives adoption of these product types globally.
- For instance, Siemens Energy’s SGT-A65 aero-derivative turbine delivers up to 76 MW and can achieve full load in less than 10 minutes, a key feature for balancing fluctuating renewable generation.
By Technology
The combined cycle technology segment commands the power generation gas turbine market with a 60% share due to its superior efficiency and reduced emissions. It integrates gas and steam turbines to maximize energy output and optimize fuel utilization. Open cycle turbines account for 40%, preferred for peaking applications and locations with variable power demand. Operators adopt it to achieve fast-start capability and lower upfront costs. Growth in sustainable energy integration and utility modernization initiatives drives combined cycle adoption, while open cycle remains essential for grid flexibility and backup generation.
Segments:
Based on Capacity:
- > 70 MW to 200 MW
- ≤ 30 MW to 70 MW
- > 200 MW
Based on Product:
- Heavy Duty
- Aero-Derivative
Based on Technology:
- Combined Cycle
- Open Cycle
Based on the Geography:
- North America
- U.S.
- Canada
- Mexico
- Europe
- Germany
- France
- U.K.
- Italy
- Spain
- Rest of Europe
- Asia Pacific
- China
- Japan
- India
- South Korea
- South-east Asia
- Rest of Asia Pacific
- Latin America
- Brazil
- Argentina
- Rest of Latin America
- Middle East & Africa
- GCC Countries
- South Africa
- Rest of the Middle East and Africa
Regional Analysis
North America
North America holds 32% of the power generation gas turbine market, driven by strong industrial demand and well-established power infrastructure. It benefits from continuous modernization of aging power plants and the integration of renewable energy sources with gas turbines. It supports high-efficiency combined cycle and aero-derivative applications to maintain grid reliability and reduce emissions. Favorable government policies and investment incentives encourage upgrades and new installations. Operators rely on it to ensure consistent electricity supply in industrial and commercial sectors. Technological advancements in digital monitoring and predictive maintenance enhance operational efficiency. North America remains a key market for high-capacity and heavy-duty turbines.
Europe
Europe captures 27% of the market share, propelled by stringent environmental regulations and a strong focus on sustainable energy. It drives adoption of low-emission and hydrogen-ready gas turbines for combined cycle and open cycle applications. It supports utilities in balancing intermittent renewable energy output while meeting peak demand efficiently. Market growth benefits from government incentives for energy efficiency and decarbonization projects. Operators utilize it to upgrade legacy infrastructure with modern, high-efficiency turbines. Continuous R&D in emissions control and turbine flexibility strengthens Europe’s market position. Energy security initiatives further encourage turbine deployment across the region.
Asia-Pacific
Asia-Pacific accounts for 25% of the power generation gas turbine market due to rapid industrialization, urbanization, and increasing electricity demand. It drives significant investments in new power plants and modernization of existing facilities. It provides reliable generation for industrial hubs and growing metropolitan regions. Market growth benefits from government infrastructure projects, energy access initiatives, and incentives for high-efficiency turbines. Operators implement combined cycle and aero-derivative solutions to optimize fuel consumption and reduce operational costs. Rising focus on sustainable energy integration and hybrid systems supports market expansion. Asia-Pacific remains a key region for both capacity expansion and technological adoption.
Rest of the World (RoW)
The Rest of the World holds 16% of the market, driven by emerging economies investing in power generation infrastructure. It focuses on decentralized and medium-capacity plants to meet industrial and commercial electricity demand. Turbines offer flexible operation and reliable performance in regions with unstable grids. It supports hybrid and renewable-compatible energy systems to enhance energy security. Operators adopt advanced monitoring and predictive maintenance to improve efficiency and lifespan. Market growth benefits from foreign investment and technology transfer initiatives. RoW presents opportunities for both small-scale and large-scale turbine deployment.
Key Player Analysis
- Rolls Royce
- Bharat Heavy Electricals Limited (BHEL)
- Siemens
- GE Vernova
- Opra Turbines
- Flex Energy Solutions
- MAN Energy Solutions
- Kawasaki Heavy Industries
- JSC United Engine
- Harbin Electric
- Ansaldo Energia
- Mitsubishi Heavy Industries
- Solar Turbines
Competitive Analysis
The power generation gas turbine market is highly competitive, driven by technological innovation, efficiency improvements, and low-emission solutions. Key players such as GE Vernova, Siemens, Mitsubishi Heavy Industries, Rolls Royce, Bharat Heavy Electricals Limited (BHEL), Ansaldo Energia, Kawasaki Heavy Industries, MAN Energy Solutions, Opra Turbines, Solar Turbines, Harbin Electric, JSC United Engine, and Flex Energy Solutions continually enhance product portfolios to maintain market leadership. It focuses on high-efficiency combined cycle and aero-derivative turbines for industrial, commercial, and utility-scale applications. Companies invest in research and development to deliver advanced turbine designs, digital monitoring, and predictive maintenance solutions that optimize performance and reduce operational costs. It faces pressure to meet stringent environmental regulations while offering flexible and reliable power generation. Strategic partnerships, acquisitions, and geographic expansion support growth and strengthen competitive positioning. Technological differentiation and customer-centric solutions remain critical for capturing market share and responding to evolving energy demands globally.
Recent Developments
- In year 2025, Mitsubishi Power secured major orders to supply six M501JAC gas turbines for Saudi Arabia's Rumah-1 and Al-Nairyah-1 projects, totaling 3.6 GW capacity.
- In April 2025, GE Vernova partnered with Duke Energy to install 11 7HA gas turbines across multiple projects, enhancing infrastructure to meet AI-driven power demands.
- In June 2025, Siemens Energy developed the F(X) ATEP upgrade for its SGT6-5000F turbines, boosting output by up to 30 MW per unit and improving efficiency.
- In January 2025, GE Vernova, Chevron, and Engine No. 1 announced a partnership to build natural gas power plants connected to data centers in the U.S.
Market Concentration & Characteristics
The power generation gas turbine market exhibits a moderately concentrated structure, dominated by a mix of global and regional players including GE Vernova, Siemens, Mitsubishi Heavy Industries, Rolls Royce, Bharat Heavy Electricals Limited (BHEL), Ansaldo Energia, Kawasaki Heavy Industries, MAN Energy Solutions, Opra Turbines, Solar Turbines, Harbin Electric, JSC United Engine, and Flex Energy Solutions. It relies on technological innovation, high-efficiency designs, and low-emission solutions to maintain competitiveness. Market players focus on combined cycle and aero-derivative turbines to meet diverse industrial, commercial, and utility-scale demands. It demonstrates a strong emphasis on digital monitoring, predictive maintenance, and fuel flexibility to optimize performance and reduce operational costs. Strategic partnerships, acquisitions, and geographic expansion enhance market presence. It also reflects high entry barriers due to significant capital investment, technical expertise, and regulatory compliance requirements. The market’s growth depends on innovation, sustainability, and the ability to deliver reliable power solutions globally.
Report Coverage
The research report offers an in-depth analysis based on Capacity, Product, Technology and Geography. It details leading market players, providing an overview of their business, product offerings, investments, revenue streams, and key applications. Additionally, the report includes insights into the competitive environment, SWOT analysis, current market trends, as well as the primary drivers and constraints. Furthermore, it discusses various factors that have driven market expansion in recent years. The report also explores market dynamics, regulatory scenarios, and technological advancements that are shaping the industry. It assesses the impact of external factors and global economic changes on market growth. Lastly, it provides strategic recommendations for new entrants and established companies to navigate the complexities of the market.
Future Outlook
- The power generation gas turbine market will witness increased adoption of combined cycle and aero-derivative turbines for diverse applications.
- It will focus on low-emission and hydrogen-ready technologies to meet stringent environmental regulations.
- Digital monitoring and predictive maintenance will enhance operational efficiency and reliability across installations.
- Flexible and modular turbine designs will support decentralized and hybrid power generation systems.
- Integration with renewable energy sources will drive demand for fast-start and load-following capabilities.
- Emerging economies will present significant opportunities for new installations and infrastructure modernization.
- Technological innovation will continue to improve fuel efficiency and reduce operational costs.
- Strategic partnerships and acquisitions will strengthen global market presence of key players.
- It will support energy security initiatives by providing reliable and uninterrupted power supply.
- Investments in research and development will accelerate deployment of next-generation high-performance turbines.

Request a Free Sample
Fill in your details and we'll send you a free sample report.
- Sample data tables & charts
- Research methodology
Need a Custom Version of This Report?
Tailor the scope, geography, or segments to your exact requirements.
- Custom geography or segment scope
- Direct access to our analyst team
Frequently Asked Questions
What is the current market size for Power generation gas turbine market, and what is its projected size in 2032?
Which Power generation gas turbine market segment held the largest share in 2024?
What are the primary factors fueling the growth of the Power generation gas turbine market?
Who are the leading companies in the Power generation gas turbine market?
Table of Content
Chapter 1. Report Introduction
- 1.1 Report Description & Purpose
- 1.1.1 Report Title & Market Definition
- 1.1.2 Unique Selling Propositions (USP) & Key Differentiators
- 1.1.3 Value Proposition for Stakeholders
- 1.2 Research Objectives
- 1.2.1 Market Sizing Objectives (Volume & Revenue) (Volume Where Applicable)
- 1.2.2 Segmentation Objectives
- 1.2.3 Competitive Intelligence Objectives
- 1.2.4 Forecast & Scenario Objectives
- 1.3 Report Scope
- 1.3.1 Power Generation Gas Turbine Scope – Segments & Subsegments Covered
- 1.3.2 Geographic Scope – Regions & Countries Covered
- 1.3.3 Historical Period, Base Year & Forecast Period (2024; forecast to 2032)
- 1.3.4 Inclusions & Exclusions
- 1.4 Industry Classification & Applicable Codes
- 1.5 Currency, Measurement Units & Valuation Basis
- 1.6 Target Stakeholders
- 1.7 Limitations & Assumptions
Chapter 2. Executive Summary
- 2.1 Global Power Generation Gas Turbine Market Snapshot
- 2.1.1 Market Size – Historical (2024) & Forecast (2024-2032) (2024: USD 6.45 billion → 2032: USD 9.75 billion)
- 2.1.2 Volume & Revenue – Global Totals (Volume Where Applicable)
- 2.1.3 Key Market Highlights – Top Five Facts
- 2.2 Power Generation Gas Turbine Market Segmentation Snapshot
- 2.2.1 Market Split by Region – 2024 vs. 2032
- 2.3 Competitive Snapshot
- 2.3.1 Top 10 Players by Revenue Share – 2024
- 2.3.2 Top 10 Players by Volume Share – 2024 (Volume Where Applicable)
- 2.3.3 Recent Strategic Developments (18-Month Summary)
- 2.4 Key Investment Highlights & Strategic Conclusions
Chapter 3. Power Generation Gas Turbine Market Dynamics & Industry Analysis
- 3.1 Market Overview & Context
- 3.1.1 Power Generation Gas Turbine Market Position in the Broader Industry Value Chain
- 3.1.2 Demand Structure & Purchasing Dynamics
- 3.1.3 Market Maturity & Development Stage by Region
- 3.2 Power Generation Gas Turbine Market Drivers
- 3.3 Power Generation Gas Turbine Market Restraints & Challenges
- 3.4 Power Generation Gas Turbine Market Opportunities
- 3.5 Porter's Five Forces Analysis
- 3.5.1 Threat of New Entrants
- 3.5.2 Bargaining Power of Suppliers
- 3.5.3 Bargaining Power of Buyers
- 3.5.4 Threat of Substitutes
- 3.5.5 Competitive Rivalry – Intensity Assessment
- 3.6 Power Generation Gas Turbine Value Chain Analysis
- 3.6.1 Upstream – Key Inputs, Resources & Suppliers
- 3.6.1.1 Key Input/Resource 1
- 3.6.1.2 Key Input/Resource 2
- 3.6.1.3 Key Input/Resource 3
- 3.6.2 Midstream – Core Operations & Value Creation
- 3.6.2.1 Operating Model & Process Overview
- 3.6.2.2 Key Operating Locations & Capabilities by Company
- 3.6.3 Downstream – Market Channels & End Users
- 3.6.3.1 Direct Sales & Customer Engagement Channels
- 3.6.3.2 Indirect Sales, Intermediaries & Partner Channels
- 3.6.4 Value Chain Profitability Analysis
- 3.6.1 Upstream – Key Inputs, Resources & Suppliers
- 3.7 PESTEL Analysis
- 3.7.1 Political Factors
- 3.7.2 Economic Factors
- 3.7.3 Social Factors
- 3.7.4 Technological Factors
- 3.7.5 Environmental Factors
- 3.7.6 Legal Factors
- 3.8 Power Generation Gas Turbine Supply Chain Analysis
- 3.8.1 Critical Input & Resource Availability Risk Assessment
- 3.8.2 Supplier & Operational Concentration Risk (Geographic Exposure)
- 3.8.3 Supply & Service Disruption Impact Analysis
- 3.9 Regulatory & Policy Landscape
Note: The regulatory and policy landscape section covers regulations based on their applicability to the market, Power Generation Gas Turbine category, geography, and scope of the study. Only regulatory frameworks with a material impact on operations, compliance, trade, sustainability, or market access are analyzed in detail.
Chapter 4. Key Investment Pockets & Opportunity Analysis
- 4.1 Power Generation Gas Turbine Market Attractiveness Analysis
- 4.1.1 By Region – Investment Attractiveness Matrix (Market Size × CAGR)
- 4.2 Absolute Revenue Growth Opportunity
- 4.2.1 By Region – Absolute Revenue Growth Through 2032
- 4.3 Incremental Demand Opportunity
- 4.3.1 By Region – Incremental Demand Through 2032
- 4.3.2 Segment – Incremental Demand
- 4.4 Emerging Submarket Opportunity Deep Dive (Subject to Applicability)
- 4.5 Priority Market Opportunity Scorecards
- 4.5.1 United States
- 4.5.2 Europe
- 4.5.3 Asia
- 4.5.4 Middle East & Africa
Note: Priority market opportunity scorecards reflect the geographic scope and strategic relevance of the study. Listed markets are indicative and may be adapted to the industry.
Chapter 5. Power Generation Gas Turbine Cross-Border Trade & Market Access Analysis
- 5.1 International Trade & Cross-Border Activity Overview
- 5.1.1 Global Export Value by Country (2024)
- 5.1.2 Global Export Volume by Country (2024) (Volume Where Applicable)
- 5.1.3 Global Import Value by Country (2024)
- 5.1.4 Global Import Volume by Country (2024) (Volume Where Applicable)
- 5.1.5 Net Trade Balance by Country (2024)
- 5.2 Export Analysis – Segment
- 5.2.1 Category 1 (Applicable Classification Code)
- 5.2.2 Category 2 (Applicable Classification Code)
- 5.2.3 Category 3 (Applicable Classification Code)
- 5.2.4 Category 4 (Applicable Classification Code)
- 5.2.5 Category 5 (Applicable Classification Code)
- 5.3 Import Analysis – Segment
- 5.3.1 Category 1 (Applicable Classification Code)
- 5.3.2 Category 2 (Applicable Classification Code)
- 5.3.3 Category 3 (Applicable Classification Code)
- 5.3.4 Category 4 (Applicable Classification Code)
- 5.3.5 Category 5 (Applicable Classification Code)
- 5.4 Cross-Border Pricing & Transaction Benchmarks
- 5.4.1 Export Pricing – Segment & Country
- 5.4.2 Import Pricing – Segment & Source Country
- 5.4.3 Price Trends (2024)
- 5.5 Key Cross-Border Trade & Delivery Routes
- 5.5.1 Cross-Border Trade/Delivery Route 1
- 5.5.2 Cross-Border Trade/Delivery Route 2
- 5.5.3 Cross-Border Trade/Delivery Route 3
- 5.5.4 Cross-Border Trade/Delivery Route 4
- 5.5.5 Cross-Border Trade/Delivery Route 5
- 5.6 Trade Policy & Market Access Impact Assessment
- 5.6.1 Tariff & Non-Tariff Barriers
- 5.6.2 Regional Trade & Economic Integration Frameworks
- 5.6.3 Bilateral & Multilateral Trade Agreements
- 5.6.4 Cross-Border Operating, Licensing & Localization Requirements
Note: This chapter applies where cross-border trade or delivery is relevant to Power Generation Gas Turbine. Goods, services, and digital offerings are assessed using applicable classifications and transaction measures. Import-export volumes, trade balances, and route analyses are included only where meaningful to the market.
Chapter 6. Competitive Landscape & Company Benchmarking
- 6.1 Power Generation Gas Turbine Market Concentration & Structure
- 6.1.1 Herfindahl-Hirschman Index (HHI) – vs. 2024
- 6.1.2 Leading, Mid-Sized & Emerging Player Structure
- 6.1.3 Global, Regional & Local Player Dynamics
- 6.2 Power Generation Gas Turbine Market Share Analysis – 2024
- 6.2.1 Global Revenue Share by Company
- 6.2.2 Global Volume Share by Company (Volume Where Applicable)
- 6.2.3 Regional Revenue Share
- 6.2.4 Market Share Evolution ( vs. 2024)
- 6.2.5 Company Market Share by Key Segment
- 6.2.6 Company Market Share by Customer Group
- 6.3 Operating Scale, Capacity & Infrastructure Analysis
- 6.3.1 Global Operating Scale & Supply Capacity
- 6.3.2 Resource Utilization & Operating Efficiency
- 6.3.3 Output, Service Delivery & Activity Metrics
- 6.3.4 Operating Footprint & Infrastructure Map
- 6.3.5 Planned Operational & Capacity Expansion
- 6.4 Power Generation Gas Turbine Competitive Benchmarking Matrix
- 6.4.1 Revenue, Growth, Profitability & Operating Metric Comparison
- 6.4.2 Channel Revenue Mix
- 6.4.3 Geographic Revenue Exposure
- 6.4.4 R&D Intensity
- 6.4.5 Sustainability Maturity
- 6.5 Strategic Developments in Power Generation Gas Turbine (Last 24 Months)
- 6.5.1 Mergers, Acquisitions & Divestments
- 6.5.2 New Products, Services & Solutions in Power Generation Gas Turbine
- 6.5.3 Operational & Infrastructure Expansions
- 6.5.4 Strategic Alliances, Joint Ventures & Partnerships
- 6.5.5 Distribution Expansion & Market Entry
- 6.5.6 Sustainability & ESG Initiatives
- 6.6 Competitive Strategy Mapping
- 6.6.1 Leader, Challenger, Follower & Niche Classification
- 6.6.2 Pricing Strategy Comparison
- 6.6.3 Channel Strategy Matrix
Note: Strategic developments are included based on their materiality and the availability of reliable information.
Chapter 7. Global Power Generation Gas Turbine Market – By Sales & Delivery Channel
- 7.1 Segment Overview
- 7.1.1 Volume & Revenue Split by Channel (2024 & 2032) (Volume Where Applicable)
- 7.1.2 Channel Mix Evolution (2024-2032)
Chapter 8. Regional Market Analysis – Global Overview
- 8.1 Global Regional Overview
- 8.1.1 Regional Volume Share (Volume Where Applicable)
- 8.1.2 Regional Revenue Share
- 8.1.3 Regional Volume by Region (Volume Where Applicable)
- 8.1.4 Regional Revenue by Region
- 8.1.5 Regional Forecast Through 2032
- 8.2 Cross-Regional Segment Analysis
- 8.2.1 By Sales & Delivery Channel
- 8.2.2 By Competitive Positioning & Price Tier
Chapter 9. North America Power Generation Gas Turbine Market
- 9.1 United States
- 9.2 Canada
- 9.3 Mexico
Chapter 10. Europe Power Generation Gas Turbine Market
- 10.1 Germany
- 10.2 France
- 10.3 Italy
- 10.4 United Kingdom
- 10.5 Spain
- 10.6 Poland
- 10.7 Russia
- 10.8 Netherlands
- 10.9 Belgium
- 10.10 Sweden
- 10.11 Denmark
- 10.12 Norway
- 10.13 Rest of Europe
Chapter 11. Asia Pacific Power Generation Gas Turbine Market
- 11.1 China
- 11.2 India
- 11.3 Japan
- 11.4 South Korea
- 11.5 Thailand
- 11.6 Indonesia
- 11.7 Vietnam
- 11.8 Malaysia
- 11.9 Australia
- 11.10 Rest of Asia Pacific
Chapter 12. Latin America Power Generation Gas Turbine Market
- 12.1 Brazil
- 12.2 Argentina
- 12.3 Colombia
- 12.4 Chile
- 12.5 Rest of Latin America
Chapter 13. Middle East Power Generation Gas Turbine Market
- 13.1 Saudi Arabia
- 13.2 United Arab Emirates
- 13.3 Turkey
- 13.4 Israel
- 13.5 Iran
- 13.6 Rest of the Middle East
Chapter 14. Africa Power Generation Gas Turbine Market
- 14.1 South Africa
- 14.2 Egypt
- 14.3 Nigeria
- 14.4 Morocco
- 14.5 Rest of Africa
Chapter 15. Power Generation Gas Turbine Company Profiles
- 15.1 [Company 01]
- 15.1.1 Company Overview
- 15.1.2 Key Management Personnel
- 15.1.3 Products & Services Portfolio
- 15.1.4 Financial Performance
- 15.1.5 Key Market Focus & Geographic Presence
- 15.1.6 Recent Developments & Strategic Initiatives
Note: The company profile list is preliminary and may change based on research findings, market developments, data availability, and client requirements.
Chapter 16. Appendices
- Appendix A – List of Abbreviations & Acronyms
- Appendix B – Industry Classification Code Reference – Full Series
- Appendix C – Supply, Output & Operating Capacity Data Tables
- Appendix D – End-Use & Demand Base Tables
- Appendix E – Demand, Adoption & Usage Assumptions
- Appendix F – Pricing & Revenue Metric Reference Tables
- Appendix G – Company Operations & Infrastructure Database
- Appendix H – Cross-Border Trade & Activity Data Tables (Where Applicable)
- Appendix I – Regulatory Summary Tables
- Appendix J – Primary Research Participant List (Anonymized)
- Appendix K – Primary Research Questionnaire Framework
- Appendix L – Data Sources & Bibliography
- Appendix M – Market Size Divergence & Source Comparison
Chapter 17. Research Methodology
- 17.1 Research Framework & Philosophy
- 17.2 Secondary Research – Sources, Hierarchy & Data Extraction
- 17.3 Data Modeling – Bottom-Up & Top-Down Market Sizing
- 17.4 Primary Research – Stakeholder Framework, LOI & Sample Sizes
- 17.5 Forecast Methodology – Regression, Scenario & Sensitivity Analysis
- 17.6 Quality Control – Four-Layer Validation Framework
- 17.7 Limitations & Standard Assumptions
- 17.8 Disclaimer