
Market Overview
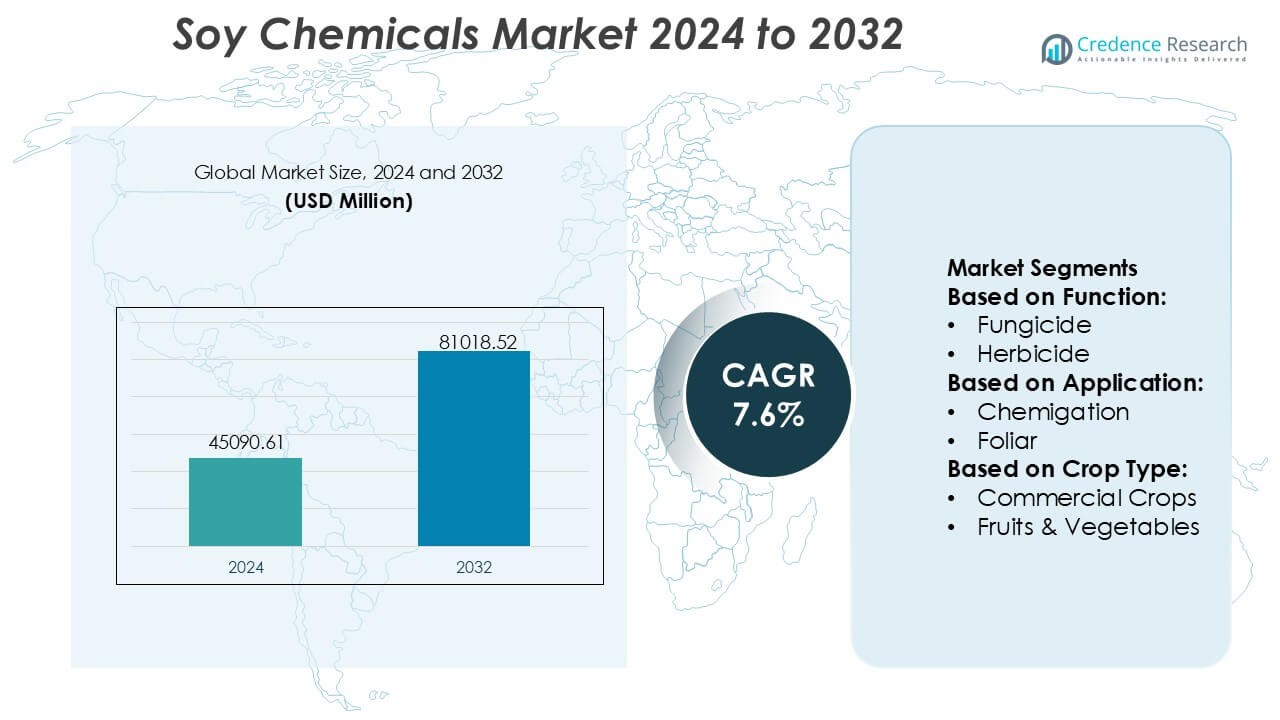
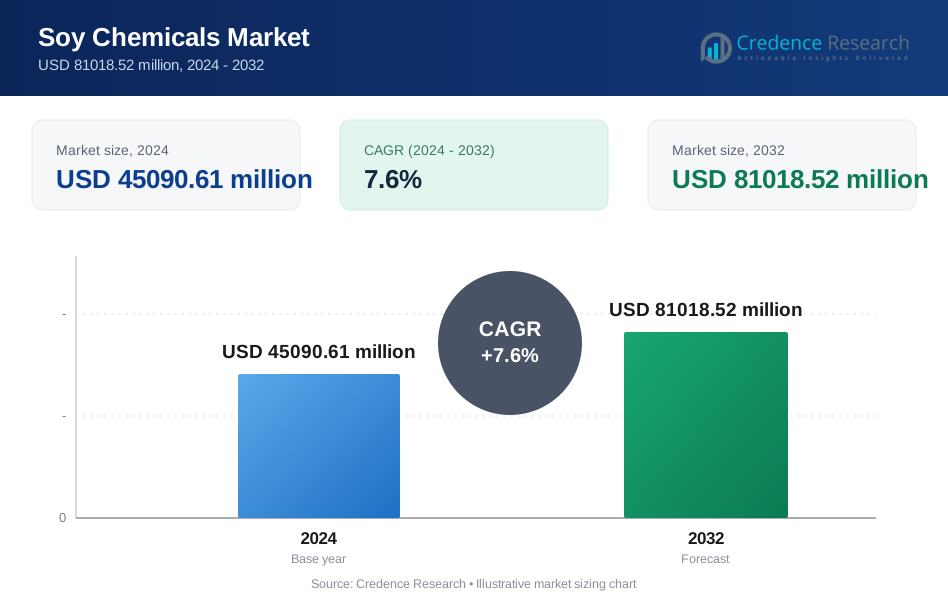
Soy Chemicals Market size was valued USD 45090.61 million in 2024 and is anticipated to reach USD 81018.52 million by 2032, at a CAGR of 7.6% during the forecast period.
| REPORT ATTRIBUTE | DETAILS |
|---|---|
| Historical Period | 2020-2023 |
| Base Year | 2024 |
| Forecast Period | 2025-2032 |
| Soy Chemicals Market Size 2024 | USD 45090.61 Million |
| Soy Chemicals Market, CAGR | 7.6% |
| Soy Chemicals Market Size 2032 | USD 81018.52 Million |
The Soy Chemicals Market is shaped by a group of globally established manufacturers that compete through innovation in bio-based polyols, esters, surfactants, and specialty derivatives, supported by strong R&D capabilities and expanding production efficiencies. These companies focus on improving product performance, enhancing sustainability attributes, and strengthening supply chain reliability to meet rising demand from coatings, personal care, automotive, and industrial sectors. Asia-Pacific emerges as the leading regional market with an exact 42% share, driven by abundant feedstock availability, rapid industrial expansion, and strong government support for renewable chemical production, positioning it as the central hub for long-term market growth.
Market Insights
- The market reached USD 45090.61 million in 2024 and is projected to achieve USD 81018.52 million by 2032 at a 7.6% CAGR, reflecting strong global adoption of renewable chemical alternatives.
- Growing demand for bio-based polyols, esters, and surfactants, supported by sustainability commitments and low-VOC formulation needs, drives widespread use across coatings, personal care, automotive, and industrial manufacturing segments.
- Innovation in enzymatic modification, green processing technologies, and specialty-grade soy derivatives strengthens competitive positioning and accelerates product diversification.
- Supply chain fluctuations linked to soybean price volatility and competition from alternative bio-feedstocks act as key restraints, affecting cost stability for manufacturers.
- Asia-Pacific holds the leading 42% regional share, driven by large-scale processing capacity and industrial demand, while soy polyols and methyl esters represent the most rapidly expanding segments due to broad application versatility.
Market Segmentation Analysis:
By Function
The Soy Chemicals Market shows strong adoption across multiple functional categories, with herbicides emerging as the dominant sub-segment with an estimated 42% share. Herbicides lead due to their broad-spectrum weed control efficiency, compatibility with large-scale mechanized farming, and rising preference for bio-based crop protection inputs that reduce soil toxicity. Demand accelerates in regions facing herbicide-resistant weed proliferation, where soy-derived chemistries support safer and more sustainable field management. Fungicides and insecticides gain steady traction as growers shift toward integrated pest-control programs, yet herbicides maintain clear leadership because of their consistent performance and higher application frequency.
- For instance, Croda's Atlox 4916 are used in agriculture to improve herbicide droplet retention on crop leaves, enabling more efficient delivery of active ingredients and often reducing overall spray volumes during application tests.
By Application
Within applications, foliar treatment holds the dominant share at approximately 45%, driven by its rapid nutrient absorption, improved crop response, and greater operational flexibility compared to chemigation or seed treatment. Farmers prefer foliar applications for mid-season corrective actions, enabling enhanced crop vigor and minimized input waste. The adoption of precision spraying technologies further boosts this segment by optimizing dosage and reducing off-target drift. Seed treatment grows steadily as soybean-based bio-stimulants improve germination quality, while chemigation remains niche in areas with advanced irrigation infrastructure. Nonetheless, foliar application retains its lead due to higher efficiency and broad crop compatibility.
- For instance, LANXESS’ biodegradable chelating agent Baypure® CX (iminodisuccinate) documented to achieve >80% biodegradation within 28 days (OECD 301E test) is used in foliar micronutrient formulations to enhance metal ion stability and improve leaf uptake efficiency, particularly for Fe, Zn, and Mn.
By Crop Type
Across crop categories, grains & cereals dominate the Soy Chemicals Market with nearly 40% share, supported by extensive acreage, high input intensity, and increasing grower reliance on sustainable crop protection products for wheat, corn, and rice. Adoption strengthens as producers prioritize residue-free solutions to meet export regulations and consumer expectations for cleaner food chains. Pulses & oilseeds show rising uptake due to expanding soy cultivation and the need for targeted pest management. While fruits and vegetables benefit from bio-based alternatives in high-value farming, grains & cereals retain leadership because of scale, consistent demand, and strong return-on-input efficiency.
Key Growth Drivers
Rising Demand for Bio-Based and Renewable Chemical Alternatives
The market grows as industries prioritize renewable, low-carbon materials to reduce dependency on petroleum-derived chemicals. Soy-based ingredients such as soy methyl esters, soy polyols, and soy waxes gain rapid acceptance in coatings, adhesives, personal care, and lubricants due to their biodegradability and cost stability. Regulatory pressures promoting sustainable formulations and corporate commitments to carbon-neutral operations further accelerate adoption. Increasing consumer preference for green products strengthens commercial demand across automotive, packaging, personal care, and cleaning sectors, positioning soy chemicals as essential components in eco-optimized supply chains.
- For instance, Huntsman opened an Innovation Center in Tienen, Belgium, housing over 100 scientists focused on polyurethanes, performance products, and advanced materials to accelerate technology translation into commercial solutions.
Expansion of Industrial Applications Across High-Value Sectors
Soy chemicals benefit from expanding usage in coatings, plastics, elastomers, printing inks, and bio-lubricants as manufacturers pursue enhanced performance with lower environmental risks. Soy polyols support rapid innovation in flexible and rigid polyurethane foams, while soy oil derivatives gain traction in rubber processing and high-solids coatings. Advancements in catalytic and enzymatic modification techniques improve functionality and thermal stability, enabling soy-based chemicals to compete with synthetic counterparts. Rising investment in bio-industrial platforms and green polymer resins further strengthens market penetration across diverse manufacturing ecosystems.
- For instance, Lubrizol introduced Sancure™ 942 Polyurethane Dispersion, a new PUD technology engineered for wood coatings that delivers improved film hardness and abrasion resistance compared with legacy binders, enabling enhanced durability in both residential and commercial finishes.
Favorable Agricultural Supply Dynamics and Cost Competitiveness
Stable and expanding global soybean production ensures consistent feedstock availability at competitive prices, supporting scalable manufacturing of soy-derived chemical intermediates. The vertically integrated value chain from farming to crushing to downstream refining reduces raw material volatility and enhances supply resilience. Agro-technological improvements, high-yield cultivars, and expansion of soybean processing facilities in Asia-Pacific and South America strengthen feedstock security. These dynamics allow manufacturers to maintain cost-effective operations and offer sustainable products without price premiums, driving higher adoption across cost-sensitive industrial segments.
Key Trends & Opportunities
Advancement in Bio-Polymer and Bio-Plastic Innovations
Strong opportunities arise as soy derivatives become integral to next-generation bioplastics, biodegradable packaging, and sustainable polymer blends. Soy-based polyols and resins support the development of eco-friendly foams, films, and molded components, addressing rising demand for circular materials. Innovation in hybrid bio-polymer systems enhances tensile strength, heat resistance, and processability, enabling broader industrial usage. Growing interest from packaging, automotive, and consumer goods companies creates a high-value pipeline for soy-derived polymers, positioning the market to benefit from global sustainability transitions.
- For instance, Solvay’s ISCC-PLUS certified ReCycle MB specialty polymers such as Udel® PSU ReCycle MB and Radel® PPSU ReCycle MB derived via a mass balance approach that tracks renewable and circular content throughout the value chain and enables customers to reduce Scope 3 emissions while maintaining high performance in demanding applications.
Growth of Specialty and High-Purity Soy Chemical Grades
Manufacturers increasingly focus on developing high-purity soy fatty acids, refined lecithin, and functionalized esters to serve personal care, nutraceutical, and pharmaceutical applications. Demand for natural emollients, bio-surfactants, and plant-derived actives creates profitable opportunities in premium formulation segments. Enhanced fractionation and enzymatic refining technologies enable precise molecular tailoring, improving stability and application performance. Rising consumer interest in plant-based, allergen-free, and non-GMO products further drives adoption, encouraging companies to expand specialty chemical portfolios and diversify revenue streams beyond industrial-grade derivatives.
- For instance, Clariant’s continued expansion in specialty bio-based ingredients is exemplified by its Vita-series ethoxylates and propoxylates, which are derived from 100% renewable bio-ethanol and deliver up to 85% renewable carbon content.
Integration of Green Manufacturing and Low-Carbon Production Technologies
Growing emphasis on carbon-neutral operations and cleaner industrial processes fosters investment in energy-efficient refining, enzymatic conversion, and low-emission esterification technologies. Companies adopting renewable energy, closed-loop water systems, and waste valorization methods strengthen their ESG positioning and reduce production costs over time. Government incentives supporting bio-refineries and sustainable feedstock utilization enhance economic viability. These shifts create opportunities for differentiated, low-carbon soy chemical offerings that meet rising procurement standards from environmentally conscious industries.
Key Challenges
Competition from Other Bio-Based Feedstocks and Synthetic Alternatives
The market faces competitive pressure from other renewable feedstocks such as palm, rapeseed, and algae oils, as well as petroleum-based chemicals that remain cost-advantaged during periods of low crude prices. These alternatives often deliver comparable or superior performance in certain applications, limiting soy chemicals' penetration in high-spec industrial segments. Manufacturers must invest in process optimization and functional modifications to differentiate soy derivatives. Maintaining consistent performance, cost parity, and technical relevance remains a persistent challenge as competing feedstocks evolve.
Supply Chain Variability and Sensitivity to Agricultural Fluctuations
Soy-based chemical production remains exposed to agricultural volatility driven by climate variability, geopolitical trade dynamics, and fluctuations in global soybean crushing capacity. Unpredictable yield patterns and price instability can pressure margins and disrupt downstream manufacturing schedules. Additionally, competition from food and feed sectors influences feedstock allocation and may tighten availability for chemical processors during peak demand cycles. Ensuring stable supply, diversifying sourcing regions, and strengthening storage and logistics infrastructure remain critical challenges for long-term market stability.
Regional Analysis
North America
North America holds an estimated 36% share of the soy chemicals market, supported by strong demand for bio-based ingredients across coatings, adhesives, lubricants, personal care, and packaging sectors. The region benefits from advanced R&D capabilities, well-established soybean processing infrastructure, and regulatory incentives promoting green chemistry. Manufacturers accelerate commercialization of soy polyols, methyl esters, and specialty fatty acid derivatives to meet sustainability goals in automotive, construction, and consumer goods applications. High adoption of low-VOC and renewable materials, combined with steady industrial modernization, reinforces North America’s dominant position in the global soy chemicals landscape.
Europe
Europe accounts for roughly 28% of the global market, driven by stringent environmental regulations, strong circular-economy policies, and growing industrial commitment to carbon-neutral operations. The region’s chemical, automotive, and personal care industries increasingly integrate soy-derived polyols, resins, surfactants, and waxes into sustainable product portfolios. Demand expands as manufacturers transition from petrochemical-based intermediates to renewable alternatives and adopt eco-optimized production technologies. Rising consumer preference for plant-based, non-GMO, and allergen-friendly products strengthens market penetration. Europe’s regulatory alignment with bio-based innovation continues to position the region as a high-value hub for specialty soy chemical applications.
Asia-Pacific
Asia-Pacific leads the global soy chemicals market with an approximate 42% share, supported by abundant feedstock availability, large-scale soybean processing, and rapidly expanding industrial demand. Rising consumption in coatings, plastics, adhesives, and bio-lubricants drives significant growth across China, India, Japan, and Southeast Asia. Regional manufacturers invest heavily in bio-refinery technologies, enzyme-modified derivatives, and specialty soy-based intermediates to serve fast-growing end-use industries. Expanding food processing, packaging, automotive, and construction sectors further accelerate adoption. Strong government support for renewable materials and competitive production economics reinforce Asia-Pacific’s leadership in both volume and manufacturing capacity.
Latin America
Latin America holds nearly 8% of the market, driven primarily by its strong soybean cultivation base and growing interest in value-added downstream chemical processing. Brazil and Argentina act as key contributors, leveraging expanding crushing capacities and export-oriented supply chains. The region experiences rising demand for soy-based methyl esters, polyols, and lecithin in local food, agribusiness, and industrial manufacturing segments. However, limited specialty chemical infrastructure restricts higher-value production. Increasing government initiatives promoting bio-based industrial development and investments in processing technologies provide opportunities for Latin America to strengthen its role in global soy chemical exports.
Middle East & Africa
The Middle East & Africa region accounts for around 6% of the soy chemicals market, supported by expanding demand for sustainable industrial ingredients in coatings, construction chemicals, detergents, and personal care sectors. Although the region relies heavily on imports due to limited soybean cultivation and processing capacity, investments in renewable materials and industrial diversification create growth opportunities. Rising urbanization, infrastructure expansion, and increasing preference for low-VOC and bio-based materials enhance adoption. Regional manufacturers explore soy-based polyols and esters as substitutes for petrochemical derivatives, gradually strengthening MEA’s role in emerging bio-based value chains.
Market Segmentations:
By Function:
- Fungicide
- Herbicide
By Application:
- Chemigation
- Foliar
By Crop Type:
- Commercial Crops
- Fruits & Vegetables
By Geography
- North America
- U.S.
- Canada
- Mexico
- Europe
- Germany
- France
- U.K.
- Italy
- Spain
- Rest of Europe
- Asia Pacific
- China
- Japan
- India
- South Korea
- South-east Asia
- Rest of Asia Pacific
- Latin America
- Brazil
- Argentina
- Rest of Latin America
- Middle East & Africa
- GCC Countries
- South Africa
- Rest of the Middle East and Africa
Competitive Landscape
The Soy Chemicals Market features a competitive ecosystem shaped by leading global manufacturers, including Croda International Plc, Lanxess, Kemira Oyj, Huntsman International LLC, Evonik Industries AG, Akzo Nobel N.V., The Lubrizol Corporation, Solvay, Clariant AG, and DuPont. The Soy Chemicals Market is shaped by continuous innovation, expanding application versatility, and strong emphasis on sustainable chemical alternatives. Market participants focus on developing high-performance soy-derived polyols, esters, fatty acids, and surfactants that meet rising demand for low-VOC, biodegradable, and renewable formulations across coatings, adhesives, personal care, automotive, and industrial manufacturing sectors. Companies increasingly invest in advanced enzymatic and catalytic technologies to enhance product functionality and reduce carbon intensity in production. Strategic priorities include strengthening supply chain integration, optimizing feedstock utilization, and expanding bio-refinery partnerships to ensure cost-efficient scalability. Growing regulatory support for bio-based materials and the rapid transition toward circular economy frameworks further intensify competition, promoting faster commercialization of innovative soy-based chemical solutions.
Key Player Analysis
- Croda International Plc
- Lanxess
- Kemira Oyj
- Huntsman International LLC
- Evonik Industries AG
- Akzo Nobel N.V.
- The Lubrizol Corporation
- Solvay
- Clariant AG
- DuPont
Recent Developments
- In June 2025, DCM Shriram to acquire specialty chemicals firm for Rs 375 crore to enter advanced materials segment. DCM Shriram Ltd has announced. This move enhances DCM's footprint in specialty chemical manufacturing and facilities expansion into high-value products such as specialty intermediates and polymers.
- In April 2024, BASF SE announced its sustainable PA6 and PA6.6 polyamides, branded as Ultramid Ccycled, received Recycled Claim Standard (RCS) certification, allowing them to market textiles made from chemically recycled plastic waste, offering a lower carbon footprint with unchanged quality for the textile industry.
- In January 2024, Devan Chemicals, a provider of sustainable textile finishes, is excited to announce its upcoming participation in Heimtextil 2024. Devan invites attendees to visit their booth in Hall 11.0, booth A21, to experience firsthand the latest sustainable textile finishes they have developed.
Report Coverage
The research report offers an in-depth analysis based on Function, Application, Crop Type and Geography. It details leading market players, providing an overview of their business, product offerings, investments, revenue streams, and key applications. Additionally, the report includes insights into the competitive environment, SWOT analysis, current market trends, as well as the primary drivers and constraints. Furthermore, it discusses various factors that have driven market expansion in recent years. The report also explores market dynamics, regulatory scenarios, and technological advancements that are shaping the industry. It assesses the impact of external factors and global economic changes on market growth. Lastly, it provides strategic recommendations for new entrants and established companies to navigate the complexities of the market.
Future Outlook
- The market will expand as industries accelerate the shift from petroleum-based chemicals to renewable, plant-derived alternatives.
- Demand for soy-based polyols, esters, and surfactants will rise with greater adoption of low-carbon and biodegradable formulations.
- Innovation in enzymatic and catalytic modification technologies will enhance performance and broaden application potential.
- Bio-polymer and bio-plastic development will create new opportunities in sustainable packaging and green materials.
- Manufacturers will strengthen supply chains through expanded soybean processing capacities and regional sourcing diversification.
- Specialty-grade soy chemicals will gain traction in personal care, pharmaceuticals, and high-value industrial applications.
- Regulatory incentives supporting green chemistry will accelerate commercialization of advanced soy-derived intermediates.
- Partnerships between bio-refineries and chemical manufacturers will increase to scale production efficiently.
- Asia-Pacific will remain the fastest-growing market due to robust industrial demand and competitive production economics.
- Sustainability-driven procurement policies will push more companies to integrate soy chemicals into mainstream product formulations.
Request a Free Sample
Fill in your details and we'll send you a free sample report.
- Sample data tables & charts
- Research methodology
Need a Custom Version of This Report?
Tailor the scope, geography, or segments to your exact requirements.
- Custom geography or segment scope
- Direct access to our analyst team
Frequently Asked Questions
What is the current market size for the Soy Chemicals Market, and what is its projected size in 2032?
At what Compound Annual Growth Rate is the Soy Chemicals Market projected to grow between 2024 and 2032?
Which Soy Chemicals Market segment held the largest share in 2024?
What are the primary factors fueling the growth of the Soy Chemicals Market?
Who are the leading companies in the Soy Chemicals Market?
Which region commanded the largest share of the Soy Chemicals Market in 2024?
Table of Content
Chapter 1. Report Introduction
- 1.1 Report Description & Purpose
- 1.1.1 Report Title & Market Definition
- 1.1.2 Unique Selling Propositions (USP) & Key Differentiators
- 1.1.3 Value Proposition for Stakeholders
- 1.2 Research Objectives
- 1.2.1 Market Sizing Objectives (Volume & Revenue)
- 1.2.2 Segmentation Objectives
- 1.2.3 Competitive Intelligence Objectives
- 1.2.4 Forecast & Scenario Objectives
- 1.3 Report Scope
- 1.3.1 Soy Chemicals Scope – Types & Subtypes Covered
- 1.3.2 Geographic Scope – Regions & Countries Covered
- 1.3.3 Historical Period, Base Year & Forecast Period (2024; forecast to 2032)
- 1.3.4 Inclusions & Exclusions
- 1.4 HS Code & Classification Framework
- 1.5 Currency, Units & Pricing Basis
- 1.6 Target Stakeholders
- 1.7 Limitations & Assumptions
Chapter 2. Executive Summary
- 2.1 Global Soy Chemicals Market Snapshot
- 2.1.1 Market Size – Historical (2024) & Forecast (2024-2032) (2024: USD 45090.61 million → 2032: USD 81018.52 million)
- 2.1.2 Volume & Revenue – Global Totals
- 2.1.3 Key Market Highlights – Top Five Facts
- 2.2 Soy Chemicals Market Segmentation Snapshot
- 2.2.1 Market Split by Region – 2024 vs. 2032
- 2.3 Competitive Snapshot
- 2.3.1 Top 10 Players by Revenue Share – 2024
- 2.3.2 Top 10 Players by Volume Share – 2024
- 2.3.3 Recent Strategic Developments (18-Month Summary)
- 2.4 Key Investment Highlights & Strategic Conclusions
Chapter 3. Soy Chemicals Market Dynamics & Industry Analysis
- 3.1 Market Overview & Context
- 3.1.1 Soy Chemicals Market Position in the Broader Automotive Value Chain
- 3.1.2 OEM vs. Replacement Market Dynamics
- 3.1.3 Market Maturity & Development Stage by Region
- 3.2 Soy Chemicals Market Drivers
- 3.3 Soy Chemicals Market Restraints & Challenges
- 3.4 Soy Chemicals Market Opportunities
- 3.5 Porter's Five Forces Analysis
- 3.5.1 Threat of New Entrants
- 3.5.2 Bargaining Power of Suppliers
- 3.5.3 Bargaining Power of Buyers
- 3.5.4 Threat of Substitutes
- 3.5.5 Competitive Rivalry – Intensity Assessment
- 3.6 Soy Chemicals Value Chain Analysis
- 3.6.1 Upstream – Raw Material/Input Suppliers
- 3.6.1.1 Raw Material/Input 1
- 3.6.1.2 Raw Material/Input 2
- 3.6.1.3 Raw Material/Input 3
- 3.6.2 Midstream – Production/Manufacturing/Service Delivery
- 3.6.2.1 Production/Process Overview
- 3.6.2.2 Key Facility Locations & Capacity by Manufacturer
- 3.6.3 Downstream – Distribution & End Consumer
- 3.6.3.1 Primary Channel – B2B/OEM
- 3.6.3.2 Secondary Channels – Dealer, Retail, Online, Direct
- 3.6.4 Value Chain Profitability Analysis
- 3.6.1 Upstream – Raw Material/Input Suppliers
- 3.7 PESTEL Analysis
- 3.7.1 Political Factors
- 3.7.2 Economic Factors
- 3.7.3 Social Factors
- 3.7.4 Technological Factors
- 3.7.5 Environmental Factors
- 3.7.6 Legal Factors
- 3.8 Soy Chemicals Supply Chain Analysis
- 3.8.1 Raw Material/Input Supply Risk Assessment
- 3.8.2 Manufacturing Concentration Risk (Geographic Exposure)
- 3.8.3 Trade Disruption Impact Analysis
- 3.9 Regulatory & Policy Landscape
Note: The regulatory and policy landscape section covers regulations based on their applicability to the market, Soy Chemicals category, geography, and scope of the study. Only regulatory frameworks with a material impact on operations, compliance, trade, sustainability, or market access are analyzed in detail.
Chapter 4. Key Investment Pockets & Opportunity Analysis
- 4.1 Soy Chemicals Market Attractiveness Analysis
- 4.1.1 By Region – Investment Attractiveness Matrix (Volume × CAGR)
- 4.2 Absolute Revenue Growth Opportunity
- 4.2.1 By Region – Absolute USD Growth Through 2032
- 4.3 Incremental Volume Opportunity
- 4.3.1 By Region – Incremental Volume Through 2032
- 4.3.2 Segment – Incremental Volume
- 4.4 Emerging Submarket Opportunity Deep Dive (Subject to Applicability)
- 4.5 Emerging Market Opportunity Scorecards
- 4.5.1 United States
- 4.5.2 Europe
- 4.5.3 Asia
- 4.5.4 Middle East & Africa
Note: Emerging Market Opportunity Scorecards will be included based on relevance and strategic importance. Regions listed are indicative and may vary depending on data availability and market dynamics.
Chapter 5. Soy Chemicals Import-Export Analysis & Trade Flows
- 5.1 Global Trade Overview
- 5.1.1 Global Export Value by Country (2024)
- 5.1.2 Global Export Volume by Country (2024)
- 5.1.3 Global Import Value by Country (2024)
- 5.1.4 Global Import Volume by Country (2024)
- 5.1.5 Net Trade Balance by Country (2024)
- 5.2 Export Analysis – Segment
- 5.2.1 Type 1 (HS Code)
- 5.2.2 Type 2 (HS Code)
- 5.2.3 Type 3 (HS Code)
- 5.2.4 Type 4 (HS Code)
- 5.2.5 Type 5 (HS Code)
- 5.3 Import Analysis – Segment
- 5.3.1 Type 1 (HS Code)
- 5.3.2 Type 2 (HS Code)
- 5.3.3 Type 3 (HS Code)
- 5.3.4 Type 4 (HS Code)
- 5.3.5 Type 5 (HS Code)
- 5.4 Average Unit Trade Prices
- 5.4.1 Average Export Price – Segment & Country
- 5.4.2 Average Import Price – Segment & Source Country
- 5.4.3 Price Trends (2024)
- 5.5 Key Trade Route Analysis
- 5.5.1 Trade Route 1
- 5.5.2 Trade Route 2
- 5.5.3 Trade Route 3
- 5.5.4 Trade Route 4
- 5.5.5 Trade Route 5
- 5.6 Trade Policy Impact Assessment
- 5.6.1 US Anti-Dumping & Section 301 Tariffs
- 5.6.2 EU Customs Union Impact
- 5.6.3 Major Free Trade Agreements
- 5.6.4 USMCA Rules of Origin
Note: Trade policy analysis will be included only where relevant to the Soy Chemicals market.
Chapter 6. Competitive Landscape & Company Benchmarking
- 6.1 Soy Chemicals Market Concentration & Structure
- 6.1.1 Herfindahl-Hirschman Index (HHI) – vs. 2024
- 6.1.2 Tier 1, Tier 2 & Tier 3 Market Structure
- 6.1.3 Global, Regional & Local Player Dynamics
- 6.2 Soy Chemicals Market Share Analysis – 2024
- 6.2.1 Global Revenue Share by Company
- 6.2.2 Global Volume Share by Company
- 6.2.3 Regional Revenue Share
- 6.2.4 Market Share Evolution ( vs. 2024)
- 6.2.5 OEM Segment Share by Company
- 6.2.6 Replacement Segment Share by Company
- 6.3 Production/Delivery Capacity & Facility Analysis
- 6.3.1 Global Installed Capacity
- 6.3.2 Capacity Utilization Rates
- 6.3.3 Production/Output Volume
- 6.3.4 Facility Locations & Capacity Map
- 6.3.5 Planned Capacity Additions
- 6.4 Soy Chemicals Competitive Benchmarking Matrix
- 6.4.1 Revenue, Volume, CAGR & Profitability Comparison
- 6.4.2 Channel Revenue Mix
- 6.4.3 Geographic Revenue Exposure
- 6.4.4 R&D Intensity
- 6.4.5 Sustainability Maturity
- 6.5 Strategic Developments in Soy Chemicals (Last 24 Months)
- 6.5.1 Mergers, Acquisitions & Divestments
- 6.5.2 New Soy Chemicals Launches
- 6.5.3 Facility Expansions
- 6.5.4 Strategic Alliances, Joint Ventures & Partnerships
- 6.5.5 Distribution Expansion & Market Entry
- 6.5.6 Sustainability & ESG Initiatives
- 6.6 Competitive Strategy Mapping
- 6.6.1 Leader, Challenger, Follower & Niche Classification
- 6.6.2 Pricing Strategy Comparison
- 6.6.3 Channel Strategy Matrix
Note: Strategic developments are included based on their materiality and the availability of reliable information.
Chapter 7. Global Soy Chemicals Market – By Distribution Channel
- 7.1 Segment Overview
- 7.1.1 Volume & Revenue Split by Channel (2024 & 2032)
- 7.1.2 Channel Mix Evolution (2024-2032)
Chapter 8. Regional Market Analysis – Global Overview
- 8.1 Global Regional Overview
- 8.1.1 Regional Volume Share
- 8.1.2 Regional Revenue Share
- 8.1.3 Regional Volume by Region
- 8.1.4 Regional Revenue by Region
- 8.1.5 Regional Forecast Through 2032
- 8.2 Cross-Regional Segment Analysis
- 8.2.1 By Distribution Channel
- 8.2.2 By Brand/Price Tier
Chapter 9. North America Soy Chemicals Market
- 9.1 United States
- 9.2 Canada
- 9.3 Mexico
Chapter 10. Europe Soy Chemicals Market
- 10.1 Germany
- 10.2 France
- 10.3 Italy
- 10.4 United Kingdom
- 10.5 Spain
- 10.6 Poland
- 10.7 Russia
- 10.8 Netherlands
- 10.9 Belgium
- 10.10 Sweden
- 10.11 Denmark
- 10.12 Norway
- 10.13 Rest of Europe
Chapter 11. Asia Pacific Soy Chemicals Market
- 11.1 China
- 11.2 India
- 11.3 Japan
- 11.4 South Korea
- 11.5 Thailand
- 11.6 Indonesia
- 11.7 Vietnam
- 11.8 Malaysia
- 11.9 Australia
- 11.10 Rest of Asia Pacific
Chapter 12. Latin America Soy Chemicals Market
- 12.1 Brazil
- 12.2 Argentina
- 12.3 Colombia
- 12.4 Chile
- 12.5 Rest of Latin America
Chapter 13. Middle East Soy Chemicals Market
- 13.1 Saudi Arabia
- 13.2 United Arab Emirates
- 13.3 Turkey
- 13.4 Israel
- 13.5 Iran
- 13.6 Rest of the Middle East
Chapter 14. Africa Soy Chemicals Market
- 14.1 South Africa
- 14.2 Egypt
- 14.3 Nigeria
- 14.4 Morocco
- 14.5 Rest of Africa
Chapter 15. Soy Chemicals Company Profiles
- 15.1 [Company 01]
- 15.1.1 Company Overview
- 15.1.2 Key Management Personnel
- 15.1.3 Products & Services Portfolio
- 15.1.4 Financial Performance
- 15.1.5 Key Market Focus & Geographic Presence
- 15.1.6 Recent Developments & Strategic Initiatives
Note: The company profile list is preliminary and may change based on research findings, market developments, data availability, and client requirements.
Chapter 16. Appendices
- Appendix A – List of Abbreviations & Acronyms
- Appendix B – Industry Classification Code Reference – Full Series
- Appendix C – Production & Capacity Data Tables
- Appendix D – End-Use & Demand Base Tables
- Appendix E – Consumption & Replacement Rate Assumptions
- Appendix F – ASP Reference Tables
- Appendix G – Manufacturing & Facility Database
- Appendix H – Import-Export Data Tables
- Appendix I – Regulatory Summary Tables
- Appendix J – Primary Research Participant List (Anonymized)
- Appendix K – Primary Research Questionnaire Framework
- Appendix L – Data Sources & Bibliography
- Appendix M – Market Size Divergence & Source Comparison
Chapter 17. Research Methodology
- 17.1 Research Framework & Philosophy
- 17.2 Secondary Research – Sources, Hierarchy & Data Extraction
- 17.3 Data Modeling – Bottom-Up & Top-Down Market Sizing
- 17.4 Primary Research – Stakeholder Framework, LOI & Sample Sizes
- 17.5 Forecast Methodology – Regression, Scenario & Sensitivity Analysis
- 17.6 Quality Control – Four-Layer Validation Framework
- 17.7 Limitations & Standard Assumptions
- 17.8 Disclaimer
