
Market Overview:
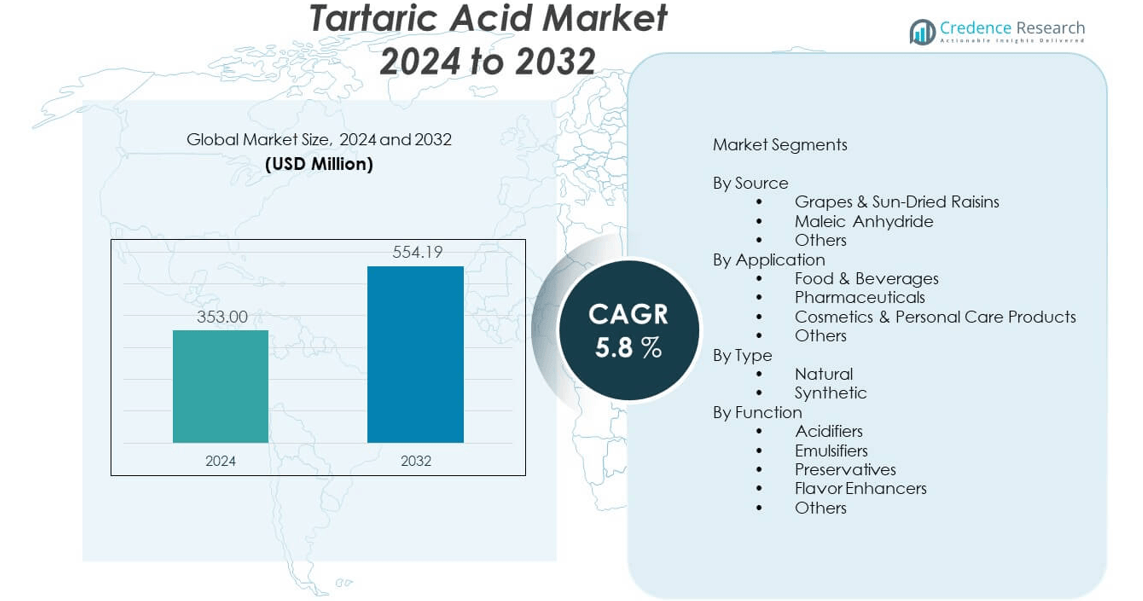
The Tartaric acid market is projected to grow from USD 353 million in 2024 to an estimated USD 554.19 million by 2032, at a compound annual growth rate (CAGR) of 5.8% during the forecast period.
| REPORT ATTRIBUTE | DETAILS |
|---|---|
| Historical Period | 2020-2023 |
| Base Year | 2024 |
| Forecast Period | 2025-2032 |
| Tartaric Acid Market Size 2024 | USD 353 million |
| Tartaric Acid Market, CAGR | 5.8% |
| Tartaric Acid Market Size 2032 | USD 554.19 million |
The market growth is driven by rising consumption in the food and beverage sector, where tartaric acid is valued for its flavor enhancement, pH control, and preservation properties. Its strong application in wine manufacturing, particularly in Europe, contributes significantly to demand. Expanding pharmaceutical usage for effervescent formulations and stabilizers, along with adoption in personal care products, further supports growth. Additionally, industrial applications in ceramics, textiles, and construction materials create a diverse demand base.
Europe leads the tartaric acid market due to its strong wine industry and established food processing sector, with Italy, France, and Spain as key contributors. North America maintains a stable share, supported by advanced pharmaceutical and bakery industries. The Asia-Pacific region is emerging rapidly, fueled by expanding food manufacturing, rising health awareness, and increasing wine production in countries like China and Australia. Latin America presents growing opportunities with its developing beverage and wine sectors, while the Middle East and Africa show potential from increasing industrial and packaged food demand.
Market Insights:
- The tartaric acid market was valued at USD 353 million in 2024 and is projected to reach USD 554.19 million by 2032, growing at a CAGR of 5.8% during the forecast period.
- Growth is driven by rising demand in food and beverages, particularly wine, bakery, and confectionery products, where it acts as an acidulant, flavor enhancer, and stabilizer.
- Expanding pharmaceutical and nutraceutical applications, including effervescent formulations and dietary supplements, further support market expansion.
- Market growth is restrained by raw material price volatility, seasonal dependency of grape harvests, and stringent regulatory compliance requirements for purity and quality.
- Europe leads the market, supported by its strong wine industry and mature food processing sector, with Italy, France, and Spain as key contributors.
- North America maintains a stable share, driven by demand in bakery, beverages, and pharmaceuticals, along with strong manufacturing capabilities.
- Asia-Pacific is the fastest-growing region, fueled by rising wine production, expanding food and beverage industries, and growing pharmaceutical manufacturing in China, India, and Australia.
Market Drivers:
Rising Adoption of Tartaric Acid in Food and Beverage Applications as a Natural Additive:
The tartaric acid market benefits from increasing demand in food and beverage processing, particularly in bakery, confectionery, and wine production. Its role as a natural acidulant and stabilizer aligns with consumer preferences for clean-label products. The compound enhances flavor, improves texture, and extends product shelf life, strengthening its commercial importance. Wine producers, especially in Europe, rely on it for maintaining acidity balance and ensuring product consistency. Regulatory support for natural additives further drives adoption. The global wine industry’s expansion, particularly in emerging markets, contributes to steady growth. It is also widely integrated in soft drinks, energy beverages, and ready-to-drink formulations, extending its presence across multiple beverage categories.
- For instance,Givaudan, a leading flavor and fragrance company, reported in 2023 that over 80% of their beverage acidulant formulations incorporate tartaric acid derived from grapes due to its superior flavor stability and natural origin.
Expanding Pharmaceutical and Nutraceutical Applications Supporting Demand Growth:
Tartaric acid’s role in pharmaceutical formulations, especially effervescent tablets and syrups, is a key demand driver. It functions as a pH regulator, excipient, and stabilizer, enhancing solubility and improving palatability. Nutraceutical manufacturers utilize its antioxidant properties in functional food and dietary supplement production. Rising global emphasis on preventive healthcare and over-the-counter wellness products encourages wider application. The shift toward natural and safe excipients in drug manufacturing further supports demand. Expanding healthcare access in developing economies boosts consumption. It also finds applications in chewable vitamins and oral care products, broadening its pharmaceutical and nutraceutical footprint.
- For instance, Nutraceutical producers incorporate tartaric acid for its antioxidant properties in dietary supplements and functional foods, with growing application in chewable vitamins and oral care formulations.
Industrial Utilization in Construction, Ceramics, and Textile Sectors:
The tartaric acid market is strengthened by its diverse industrial applications, particularly in gypsum board manufacturing where it acts as a setting retarder. In ceramics, it improves material workability, while in textiles, it assists in dyeing and finishing processes. Its stabilizing and reaction-controlling properties are valuable across manufacturing workflows. Growing infrastructure projects in emerging economies fuel construction-related usage. Its biodegradable and non-toxic profile makes it an eco-friendly substitute for certain synthetic chemicals. Industrial growth in Asia-Pacific and Latin America supports further adoption. This versatility ensures that demand remains steady across multiple industrial segments.
Rising Consumer Preference for Sustainable and Bio-Based Ingredients:
Sustainability trends in manufacturing have increased the adoption of tartaric acid derived from natural sources like grapes. Food, beverage, and pharmaceutical sectors seek eco-friendly additives that reduce environmental impact without compromising quality. Regulatory initiatives limiting synthetic chemicals accelerate this shift. Wineries and fruit processors are adopting closed-loop production models to recover tartaric acid as a by-product, reinforcing sustainable sourcing. The demand for organic and clean-label products further drives this transition. Brands leverage sustainable sourcing as a competitive advantage, particularly in premium product categories. It is increasingly recognized as a key differentiator in both mature and developing markets.
Market Trends:
Advancements in Extraction and Purification Technologies:
Technological improvements in tartaric acid extraction from natural sources are enhancing production efficiency and purity levels. Modern processing systems minimize waste and maximize yield, making operations more cost-effective. Automated filtration and crystallization techniques reduce impurities, improving product quality for sensitive applications like pharmaceuticals. These advancements help manufacturers meet stringent regulatory standards. Improved extraction efficiency also supports sustainable production goals. Innovations in enzymatic and membrane-based separation methods further optimize recovery rates. This technological evolution is expected to expand capacity and diversify supply chains.
- For instance, Innovative membrane-based separation technologies also contribute to higher recovery rates and scalable production capabilities for global demand.
Integration of Tartaric Acid in Premium and Specialty Food Products:
Manufacturers are increasingly incorporating tartaric acid into high-value and specialty food categories. It plays a critical role in premium baked goods, confectionery items, and gourmet beverages, enhancing flavor stability and texture. The growing demand for artisanal and craft food products boosts its adoption in niche segments. In wine production, premium labels emphasize natural tartaric acid use to highlight authenticity. The compound’s clean-label profile appeals to health-conscious consumers seeking minimally processed foods. Its versatility allows it to serve both functional and marketing purposes in premium segments. This integration is shaping new opportunities for market expansion.
Rising Focus on Circular Economy Practices in Production:
The tartaric acid market is experiencing increased adoption of circular economy practices, particularly in wine-producing regions. Producers are recovering tartaric acid from grape pomace and lees, reducing waste and creating additional revenue streams. These practices align with environmental regulations and sustainability commitments. Circular production not only minimizes raw material waste but also lowers production costs. The trend is gaining traction among mid-sized and large manufacturers aiming to enhance environmental credentials. It also fosters partnerships between wineries and tartaric acid producers. This approach supports both profitability and environmental responsibility.
Development of Application-Specific Formulations:
Producers are introducing application-specific grades of tartaric acid to cater to specialized requirements. Pharmaceutical-grade variants meet stringent purity standards, while food-grade options are optimized for flavor enhancement and stability. Industrial-grade formulations are designed for construction and ceramic applications. Tailored product offerings improve performance in target sectors and strengthen client relationships. Customization allows manufacturers to capture niche markets with unique needs. It also facilitates compliance with industry-specific regulations. This strategy is creating competitive differentiation in a growing market.
Market Challenges Analysis:
Volatility in Raw Material Availability and Pricing:
The tartaric acid market faces challenges from fluctuations in the availability and cost of raw materials, particularly grapes. Seasonal variations in grape harvests, adverse weather conditions, and supply chain disruptions can affect production volumes. Price volatility impacts manufacturing costs, influencing profitability for both small-scale and large producers. Regions heavily dependent on viticulture are more exposed to these risks. Limited alternative natural sources restrict flexibility in sourcing. While synthetic production can offset shortages, it often faces regulatory and consumer acceptance barriers. Managing these challenges requires robust supply chain planning and diversification strategies.
Stringent Regulatory Compliance and Quality Standards:
Compliance with varying international quality and safety regulations presents a significant challenge. The tartaric acid market must meet strict purity standards for food and pharmaceutical applications, requiring advanced processing and testing infrastructure. Regulatory frameworks differ between regions, adding complexity for exporters. Failure to meet these requirements can lead to market access restrictions and reputational damage. Achieving certifications and maintaining consistent quality demands continuous investment. Smaller manufacturers may find it difficult to bear the cost of compliance. Adapting to evolving global regulatory norms is essential for long-term market participation.
Market Opportunities:
Expanding Demand in Emerging Economies:
The tartaric acid market has strong growth potential in emerging economies, where food and beverage industries are rapidly expanding. Rising disposable incomes, urbanization, and increasing wine production in countries such as China, India, and Brazil create new revenue streams. Growing pharmaceutical manufacturing in Asia-Pacific and Latin America also supports demand. Expanding consumer awareness of product quality and safety enhances market penetration. Targeted marketing and localized production can help manufacturers establish a strong presence in these developing regions.
Increasing Use in Personal Care and Cosmetic Products:
Personal care and cosmetics represent a growing application area for tartaric acid due to its exfoliating and pH-balancing properties. Skincare formulations are incorporating it for gentle exfoliation and anti-aging benefits. The clean-label movement in cosmetics aligns with the use of naturally derived ingredients, boosting its acceptance. Premium cosmetic brands are leveraging its multifunctional role for both performance and marketing appeal. This diversification into non-traditional sectors enhances market resilience and growth prospects.
Market Segmentation Analysis:
By Source
Grapes and sun-dried raisins dominate the tartaric acid market due to their high natural acid content and strong association with the global wine industry. Maleic anhydride serves as an important synthetic source, providing stable supply for industrial and pharmaceutical applications. Other sources, including apricots, tamarind, bananas, and apples, contribute to smaller-scale production, supporting niche and region-specific demands.
- For instance, Synthetic sources such as maleic anhydride are less common but provide stable supply for pharmaceutical and industrial uses.
By Application
Food and beverages form the largest application segment, driven by tartaric acid’s role as an acidulant, flavor enhancer, and stabilizer in bakery, confectionery, and wine production. Pharmaceuticals account for a significant share, using it as a safe excipient and pH regulator in effervescent formulations. Cosmetics and personal care products utilize it for exfoliation and pH balance, while other applications include industrial uses such as construction materials and animal feed.
- For instance, The personal care industry uses tartaric acid for exfoliation and pH regulation in skincare, representing around 5% of market use.
By Type
Natural tartaric acid holds strong demand in premium and clean-label applications where natural sourcing is a key purchasing factor. Synthetic variants are preferred in cost-sensitive, large-scale industrial processes where supply stability and price competitiveness are critical.
By Function
Tartaric acid serves multiple functional roles, including acidifiers, emulsifiers, preservatives, and flavor enhancers. It is also used in other specialized functions such as chemical processing aids and stabilizers. This wide functional versatility ensures consistent demand across diverse industries, from food and beverages to pharmaceuticals, cosmetics, and construction.
Segmentation:
By Source
- Grapes & Sun-Dried Raisins
- Maleic Anhydride
- Others (including apricots, tamarind, bananas, and apples)
By Application
- Food & Beverages
- Pharmaceuticals
- Cosmetics & Personal Care Products
- Others (including industrial use and animal feed)
By Type
- Natural
- Synthetic
By Function
- Acidifiers
- Emulsifiers
- Preservatives
- Flavor Enhancers
- Others
- North America
- U.S.
- Canada
- Mexico
- Europe
- Germany
- France
- U.K.
- Italy
- Spain
- Rest of Europe
- Asia Pacific
- China
- Japan
- India
- South Korea
- South-east Asia
- Rest of Asia Pacific
- Latin America
- Brazil
- Argentina
- Rest of Latin America
- Middle East & Africa
- GCC Countries
- South Africa
- Rest of the Middle East and Africa
Regional Analysis:
Europe – Established Market Leadership with Strong Wine Industry Presence
Europe dominates the tartaric acid market, supported by its extensive wine industry and mature food processing sector. Countries such as Italy, France, and Spain lead production and consumption due to high demand in winemaking and bakery applications. The region holds a significant share of the global market, benefiting from well-developed manufacturing infrastructure and regulatory frameworks favoring natural additives. The established presence of wineries and food manufacturers ensures consistent demand. Continuous innovation in sustainable production methods strengthens Europe’s market position.
North America – Stable Growth Driven by Diverse Industrial and Food Applications
North America maintains a steady market share, supported by strong demand in food, beverage, and pharmaceutical applications. The United States leads the region with significant consumption in bakery products, beverages, and dietary supplements. Industrial applications in construction materials and ceramics also contribute to demand. High consumer awareness of product quality and clean-label trends supports adoption. The region benefits from advanced manufacturing capabilities and a robust distribution network. Regulatory compliance is a key factor influencing product positioning in this market.
Asia-Pacific – Fastest-Growing Region with Expanding Manufacturing Base
Asia-Pacific is emerging as the fastest-growing region for the tartaric acid market, driven by rapid industrialization and expanding food and beverage production. Countries such as China, India, and Australia are increasing adoption in both wine production and processed food manufacturing. Rising disposable incomes and urban lifestyles fuel demand for packaged foods and beverages. Pharmaceutical manufacturing growth further strengthens the market. Government support for local production and foreign investment in manufacturing facilities enhances regional competitiveness.
Key Player Analysis:
- Tarac Technologies
- American Tartaric Products
- Cargill
- Distillerie Mazzari S.p.A.
- Australian Tartaric Products
- The Tartaric Chemicals Corporation
- Sagar Chemicals
- RANDI GROUP
- Caviro Distillerie
- Distillerie Bonollo
Competitive Analysis:
The tartaric acid market is moderately consolidated, with a mix of global producers and regional manufacturers competing on product quality, application diversity, and pricing. Leading companies focus on technological advancements in extraction and purification to meet stringent quality standards. Competition is shaped by the ability to maintain consistent supply, particularly in regions dependent on seasonal grape harvests. Strategic partnerships with wineries and food manufacturers enhance sourcing stability. Companies also invest in expanding production capacity to cater to emerging markets. Product differentiation through application-specific grades remains a key competitive strategy.
Recent Developments:
- In May 2025, Cargill received global recognition by ranking #1 on the Edible Oil Supplier Index for removing industrial trans fats from their oils, indirectly benefiting their tartaric acid applications in beverage formulations supporting clean-label and healthier consumer products.
Market Concentration & Characteristics:
The tartaric acid market exhibits a moderate concentration, with a limited number of key players dominating global supply while numerous small and mid-sized manufacturers serve regional markets. It is characterized by a balanced mix of natural and synthetic production methods, although natural sourcing remains more prevalent in the premium segment. Product differentiation is primarily based on purity levels, application suitability, and compliance with international quality standards. Long-term supply agreements with wineries and food producers play a critical role in ensuring stability. Continuous innovation in sustainable extraction methods is shaping competitive dynamics.
Report Coverage:
The research report offers an in-depth analysis based on by source, application, type, and function. It details leading market players, providing an overview of their business, product offerings, investments, revenue streams, and key applications. Additionally, the report includes insights into the competitive environment, SWOT analysis, current market trends, as well as the primary drivers and constraints. Furthermore, it discusses various factors that have driven market expansion in recent years. The report also explores market dynamics, regulatory scenarios, and technological advancements that are shaping the industry. It assesses the impact of external factors and global economic changes on market growth. Lastly, it provides strategic recommendations for new entrants and established companies to navigate the complexities of the market.
Future Outlook:
- Growth expected in both food and beverage applications, particularly in wine production and bakery.
- Pharmaceutical and nutraceutical adoption to rise due to demand for natural excipients.
- Emerging economies to contribute significantly to market expansion.
- Sustainable production practices to become a competitive differentiator.
- Increasing role in personal care and cosmetic formulations.
- Technological advancements to improve extraction efficiency and yield.
- Industrial applications in construction and ceramics to remain steady.
- Rising regulatory focus on natural additives to favor market demand.
- Circular economy initiatives to strengthen supply chain sustainability.
- Expansion into niche premium product categories to open new revenue streams.

Request a Free Sample
Fill in your details and we'll send you a free sample report.
- Sample data tables & charts
- Research methodology
Market Dynamics
Rising Adoption in Food and Beverage Applications
Tartaric acid is increasingly used as a natural acidulant, flavor enhancer, and stabilizer in bakery, confectionery, and especially wine production, aligning with consumer demand for clean-label and natural ingredients. Its ability to improve flavor, texture, and shelf life makes it essential in processed foods and beverages.
Expansion of Pharmaceutical and Nutraceutical Uses
The compound is widely adopted in effervescent formulations, dietary supplements, and as a pH regulator in pharmaceuticals, driven by the global trend toward preventive healthcare and natural excipients. Its antioxidant properties and safety profile support its growing use in chewable vitamins and oral care products.
Growth in Industrial Applications
Tartaric acid is utilized in construction (as a setting retarder in gypsum boards), ceramics (for workability), and textiles (in dyeing and finishing), with demand supported by infrastructure development in emerging economies. Its biodegradable and non-toxic nature makes it a preferred alternative to synthetic chemicals in these sectors.
Consumer Preference for Sustainable and Bio-Based Ingredients
Manufacturers and consumers are increasingly favoring tartaric acid derived from natural sources like grapes, driven by sustainability trends and regulatory support for eco-friendly additives. Closed-loop production models in wineries and fruit processing further reinforce sustainable sourcing and market appeal.
Technological Advancements in Extraction and Purification
Innovations in extraction and purification technologies, such as membrane-based separation and automated crystallization, are improving yield, purity, and cost-effectiveness. These advancements enable manufacturers to meet stringent regulatory standards and expand capacity to serve diverse, high-value applications.
Need a Custom Version of This Report?
Tailor the scope, geography, or segments to your exact requirements.
- Custom geography or segment scope
- Direct access to our analyst team
Frequently Asked Questions
What is the current market size for the Tartaric acid market, and what is its projected size in 2032?
At what Compound Annual Growth Rate is the Tartaric acid market projected to grow between 2025 and 2032?
What are the primary factors fueling the growth of the Tartaric acid market?
Who are the leading companies in the Tartaric acid market?
Table of Content
Chapter 1 Market Segmentation
- 1.1 Segmentation Framework
- 1.1.1 Product and Service Classification
- 1.1.2 Application and End-Use Classification
- 1.1.3 Technology and Solution Classification
- 1.1.4 Customer and Distribution Channel Classification
- 1.1.5 Geographic Segmentation
- 1.1.6 Market Segment Definitions and Boundaries
- 1.2 By Type
- 1.2.1 Natural
- 1.2.2 Synthetic
- 1.3 By Source
- 1.3.1 Grapes & Sun-Dried Raisins
- 1.3.2 Maleic Anhydride
- 1.3.3 Others (including apricots, tamarind, bananas, and apples)
- 1.4 By Function
- 1.4.1 Acidifiers
- 1.4.2 Emulsifiers
- 1.4.3 Preservatives
- 1.4.4 Flavor Enhancers
- 1.4.5 Others
- 1.5 By Application
- 1.5.1 Food & Beverages
- 1.5.2 Pharmaceuticals
- 1.5.3 Cosmetics & Personal Care Products
- 1.5.4 Others (including industrial use and animal feed)
Chapter 2 Introduction
- 2.1 Report Objectives and Scope
- 2.2 Product Definition and Industry Terminology
- 2.3 Market Inclusions and Exclusions
- 2.4 Research Process
- 2.4.1 Primary Research and Expert Interviews
- 2.4.2 Secondary Research and Source Review
- 2.4.3 Top-Down and Bottom-Up Estimation
- 2.4.4 Data Triangulation and Verification
- 2.5 Market Size Measurement Basis
- 2.5.1 2024: USD 353 million → 2032: USD 554.19 million
- 2.6 Historical and Forecast Reference Periods
- 2.6.1 Base Year: 2024
- 2.6.2 Forecast Period: 2024-2032
- 2.7 Research Assumptions and Limitations
Chapter 3 Executive Summary
- 3.1 Market Snapshot and Key Findings
- 3.2 Base-Year Market Size, 2024
- 3.3 Forecast Market Size, 2032
- 3.4 Revenue and Volume Growth Outlook
- 3.5 Key Demand and Supply Indicators
- 3.6 Leading Market Segments
- 3.7 Fastest-Growing Market Opportunities
- 3.8 Regional Performance Highlights
- 3.9 Technology and Industry Transformation
- 3.10 Competitive Landscape Summary
- 3.11 Analyst View and Strategic Implications
Chapter 4 Global Tartaric Acid Market Trends and Developments
- 4.1 Historical Industry Development
- 4.2 Recent Market Trends and Developments
- 4.3 Demand and Customer Behavior Trends
- 4.4 Technology and Product Innovation
- 4.5 Artificial Intelligence, Automation and Digitalization
- 4.6 Local Manufacturing and Supply Chain Realignment
- 4.7 Industry Partnerships, Mergers and Acquisitions
- 4.8 Sustainability and Circular Economy Developments
- 4.9 Government and Private Sector Investment Trends
- 4.10 Emerging Business Models and Commercialization
- 4.11 Industry Developments and Announcements
Chapter 5 Global Tartaric Acid Market Production, Supply and Demand Analysis
- 5.1 Demand Trend and Consumption Analysis
- 5.2 Demand Forecast, 2024-2032
- 5.3 Production and Output Trend
- 5.4 Production and Output Forecast, 2024-2032
- 5.5 Installed Capacity and Capacity Utilization
- 5.6 Company-Wise Production Plants and Statistics
- 5.6.1 Installed Production Capacity
- 5.6.2 Actual Production
- 5.6.3 Planned Capacity and Expansion Targets
- 5.7 Supply Chain Structure and Procurement Trends
- 5.8 Supply-Demand Gap and Bottlenecks
- 5.9 Import Dependence and Sourcing Structure
- 5.10 Contract Manufacturing and Outsourcing
- 5.11 Regional Supply and Demand Concentration
Chapter 6 Global Tartaric Acid Market Pricing Analysis
- 6.1 Pricing Structure and Measurement
- 6.2 Historical Pricing Trends
- 6.3 Pricing Outlook, 2024-2032
- 6.4 Average Selling Price and Unit Economics
- 6.5 Pricing by Product and Market Segment
- 6.6 Geographic Pricing Differences
- 6.7 Key Input, Energy, Labor and Logistics Costs
- 6.8 Contract Pricing and Purchasing Models
- 6.9 Pricing Sensitivity and Competitive Positioning
- 6.10 Price, Margin and Profitability Implications
Chapter 7 Global Tartaric Acid Market Dynamics
- 7.1 Market Growth Drivers
- 7.1.1 Demand-Side Drivers
- 7.1.2 Technology and Innovation Drivers
- 7.1.3 Infrastructure and Investment Drivers
- 7.1.4 Regulatory and Policy Drivers
- 7.2 Market Restraints
- 7.2.1 Cost and Affordability Constraints
- 7.2.2 Technology and Adoption Barriers
- 7.2.3 Supply Chain and Operational Constraints
- 7.3 Market Challenges
- 7.3.1 Competitive Pressure and Margin Erosion
- 7.3.2 Skills, Infrastructure and Implementation Gaps
- 7.4 Emerging Market Opportunities
- 7.5 Market Dynamics Impact and Time-Horizon Assessment
Chapter 8 Global Tartaric Acid Value Chain Analysis
- 8.1 Industry Value Chain Overview
- 8.2 Upstream Suppliers and Critical Inputs
- 8.3 Technology and Component Providers
- 8.4 Manufacturing or Service Delivery
- 8.5 Distribution, Channel Partners and Integrators
- 8.6 Downstream Applications and End Users
- 8.7 Value Addition and Profit Pools
- 8.8 Vertical Integration and Outsourcing
- 8.9 Supplier Concentration and Risk
- 8.10 Supply Chain Localization and Resilience
Chapter 9 Global Tartaric Acid Market Regulations and Policies
- 9.1 Relevant Laws, Standards and Compliance Frameworks
- 9.2 Product, Service, Safety and Quality Requirements
- 9.3 Government Policies, Incentives and Subsidies
- 9.4 Imports, Exports and Trade Barriers
- 9.5 Public Procurement and Local Content Requirements
- 9.6 Environmental and Sustainability Compliance
- 9.7 Upcoming Policy Changes and Market Implications
Chapter 10 Global Tartaric Acid Market Hotspots and Opportunities
- 10.1 Market Opportunity Mapping and Growth Hotspots
- 10.2 High-Growth Applications and Customer Groups
- 10.3 Underserved Markets and White-Space Opportunities
- 10.4 Emerging Technology and Product Opportunities
- 10.5 New Capacity and Investment Hotspots
- 10.6 Market Entry and Expansion Opportunities
- 10.7 Distribution and Partnership Opportunities
- 10.8 Near-Term and Long-Term Commercial Potential
- 10.9 Opportunity Attractiveness and Execution Risks
Chapter 11 Global Tartaric Acid Market Outlook, 2024-2032
- 11.1 Market Size and Analysis
- 11.1.1 Revenue (Market Measurement: 2024: USD 353 million → 2032: USD 554.19 million)
- 11.1.2 Market Volume and Quantity Sold
- 11.1.3 Historical Market Size
- 11.1.4 Base-Year Market Size, 2024
- 11.2 Market Forecast, 2024-2032
- 11.2.1 Revenue Forecast to 2032
- 11.2.2 Volume Forecast to 2032
- 11.2.3 CAGR and Year-on-Year Growth
- 11.2.4 Incremental Revenue Opportunity
- 11.3 Forecast Assumptions and Scenario Analysis
- 11.3.1 Base-Case Forecast
- 11.3.2 Optimistic and Conservative Scenarios
- 11.3.3 Technology, Pricing and Policy Sensitivities
- 11.4 Market Attractiveness and Growth Outlook
Chapter 12 Global Tartaric Acid Market Segmentation and Outlook
- 12.1 Segmentation Summary and Market Shares, 2024
- 12.2 Largest and Fastest-Growing Segments
- 12.3 By Type - Market Size and Forecast, 2024-2032
- 12.3.1 Segment Definition and Scope
- 12.3.2 Historical Market Size
- 12.3.3 Revenue Forecast, 2024-2032
- 12.3.4 Volume Forecast, 2024-2032
- 12.3.5 Base-Year Market Share, 2024
- 12.3.6 Segment CAGR and Growth Drivers
- 12.3.7 Subsegment Market Size and Forecast
- 12.3.7.1 Natural
- 12.3.7.2 Synthetic
- 12.3.8 Subsegment Pricing and Adoption Trends
- 12.3.9 Leading Suppliers and Competition
- 12.3.10 Regional Demand and Opportunities
- 12.4 By Source - Market Size and Forecast, 2024-2032
- 12.4.1 Segment Definition and Scope
- 12.4.2 Historical Market Size
- 12.4.3 Revenue Forecast, 2024-2032
- 12.4.4 Volume Forecast, 2024-2032
- 12.4.5 Base-Year Market Share, 2024
- 12.4.6 Segment CAGR and Growth Drivers
- 12.4.7 Subsegment Market Size and Forecast
- 12.4.7.1 Grapes & Sun-Dried Raisins
- 12.4.7.2 Maleic Anhydride
- 12.4.7.3 Others (including apricots, tamarind, bananas, and apples)
- 12.4.8 Subsegment Pricing and Adoption Trends
- 12.4.9 Leading Suppliers and Competition
- 12.4.10 Regional Demand and Opportunities
- 12.5 By Function - Market Size and Forecast, 2024-2032
- 12.5.1 Segment Definition and Scope
- 12.5.2 Historical Market Size
- 12.5.3 Revenue Forecast, 2024-2032
- 12.5.4 Volume Forecast, 2024-2032
- 12.5.5 Base-Year Market Share, 2024
- 12.5.6 Segment CAGR and Growth Drivers
- 12.5.7 Subsegment Market Size and Forecast
- 12.5.7.1 Acidifiers
- 12.5.7.2 Emulsifiers
- 12.5.7.3 Preservatives
- 12.5.7.4 Flavor Enhancers
- 12.5.7.5 Others
- 12.5.8 Subsegment Pricing and Adoption Trends
- 12.5.9 Leading Suppliers and Competition
- 12.5.10 Regional Demand and Opportunities
- 12.6 By Application - Market Size and Forecast, 2024-2032
- 12.6.1 Segment Definition and Scope
- 12.6.2 Historical Market Size
- 12.6.3 Revenue Forecast, 2024-2032
- 12.6.4 Volume Forecast, 2024-2032
- 12.6.5 Base-Year Market Share, 2024
- 12.6.6 Segment CAGR and Growth Drivers
- 12.6.7 Subsegment Market Size and Forecast
- 12.6.7.1 Food & Beverages
- 12.6.7.2 Pharmaceuticals
- 12.6.7.3 Cosmetics & Personal Care Products
- 12.6.7.4 Others (including industrial use and animal feed)
- 12.6.8 Subsegment Pricing and Adoption Trends
- 12.6.9 Leading Suppliers and Competition
- 12.6.10 Regional Demand and Opportunities
- 12.7 Segment Growth Comparison
- 12.8 Segment Attractiveness and Priority Matrix
Chapter 13 Global Tartaric Acid End-Use and Application Market Outlook
- 13.1 End-Use Industry and Customer Demand Structure
- 13.2 Leading Applications and Customer Groups
- 13.3 End-Use Market Size, Share and Forecast
- 13.4 Major End-Use Industry Deep Dives
- 13.4.1 Customer Requirements and Use Cases
- 13.4.2 Demand and Replacement Cycles
- 13.4.3 Technical and Regulatory Considerations
- 13.4.4 Purchasing and Procurement Models
- 13.4.5 Leading Vendors and Distribution Channels
- 13.4.6 Forecast and Commercial Opportunities
- 13.5 Emerging Applications and Cross-Segment Demand
- 13.6 End-Use Industry Investment Priorities
Chapter 14 Global Tartaric Acid Geographic Market Outlook, 2024-2032
- 14.1 Regional Market Size and Share, 2024
- 14.2 Regional Market Forecast, 2024-2032
- 14.3 Regional Pricing, Production and Demand Differences
- 14.4 North America
- 14.4.1 United States
- 14.4.2 Canada
- 14.4.3 Mexico
- 14.5 Europe
- 14.5.1 Germany
- 14.5.2 France
- 14.5.3 Italy
- 14.5.4 United Kingdom
- 14.5.5 Spain
- 14.5.6 Poland
- 14.5.7 Russia
- 14.5.8 Netherlands
- 14.5.9 Belgium
- 14.5.10 Sweden
- 14.5.11 Denmark
- 14.5.12 Norway
- 14.5.13 Rest of Europe
- 14.6 Asia Pacific
- 14.6.1 China
- 14.6.2 India
- 14.6.3 Japan
- 14.6.4 South Korea
- 14.6.5 Thailand
- 14.6.6 Indonesia
- 14.6.7 Vietnam
- 14.6.8 Malaysia
- 14.6.9 Australia
- 14.6.10 Rest of Asia Pacific
- 14.7 Latin America
- 14.7.1 Brazil
- 14.7.2 Argentina
- 14.7.3 Colombia
- 14.7.4 Chile
- 14.7.5 Rest of Latin America
- 14.8 Middle East
- 14.8.1 Saudi Arabia
- 14.8.2 United Arab Emirates
- 14.8.3 Turkey
- 14.8.4 Israel
- 14.8.5 Iran
- 14.8.6 Rest of the Middle East
- 14.9 Africa
- 14.9.1 South Africa
- 14.9.2 Egypt
- 14.9.3 Nigeria
- 14.9.4 Morocco
- 14.9.5 Rest of Africa
- 14.10 Regional Investment, Policy and Supply Chain Differences
- 14.11 Regional Competitive Landscape
- 14.12 Geographic Growth Hotspots
Chapter 15 Global Tartaric Acid Technology, Innovation and Sustainability Outlook
- 15.1 Technology Landscape and Maturity
- 15.2 Product, Process and Service Innovation
- 15.3 AI, Automation and Digital Tools in the Industry
- 15.4 Technology Adoption and Performance Benchmarking
- 15.5 Innovation Pipeline and R&D Investment
- 15.6 Patent and Intellectual Property Trends
- 15.7 Energy Efficiency and Resource Management
- 15.8 Sustainability, Recycling and Circularity
- 15.9 Technology Roadmap, 2024-2032
- 15.10 Risks of Obsolescence and Technology Substitution
Chapter 16 Global Tartaric Acid Market Key Strategic Imperatives
- 16.1 Growth and Market Entry Priorities
- 16.2 High-Return Products and Segments
- 16.3 Pricing, Profitability and Cost Optimization
- 16.4 Technology Investment and Product Differentiation
- 16.5 Supply Chain Localization and Resilience
- 16.6 Distribution and Customer Acquisition
- 16.7 Partnership, Acquisition and Capacity Strategy
- 16.8 Regional Expansion Priorities
- 16.9 Short-, Medium- and Long-Term Actions
Chapter 17 Competition Outlook
- 17.1 Industry Competition Characteristics
- 17.2 Market Structure and Concentration
- 17.3 Market Share and Competitive Positioning, 2024
- 17.4 Company-Wise Revenue and Product Benchmarking
- 17.5 Production and Service Capacity Benchmarking
- 17.6 Technology, Pricing and Differentiation
- 17.7 Regional Footprint and Distribution Strength
- 17.8 Mergers, Acquisitions and Strategic Alliances
- 17.9 New Entrants and Competitive Threats
- 17.10 Porter's Five Forces and Industry Attractiveness
- 17.11 Competitive Outlook, 2024-2032
Chapter 18 Company Profiles
- 18.1 Company Coverage and Selection Criteria
- 18.2 Tarac Technologies
- 18.2.1 Business Description
- 18.2.2 Company Ownership and Geographic Presence
- 18.2.3 Product and Service Portfolio
- 18.2.4 Manufacturing and Operating Footprint
- 18.2.5 Production Capacity and Expansion Plans
- 18.2.6 Financial Performance and Investment
- 18.2.7 Market Share and Competitive Position
- 18.2.8 Technology and Innovation Capabilities
- 18.2.9 Strategic Alliances or Partnerships
- 18.2.10 Recent Developments
- 18.2.11 Growth Strategy and Outlook
- 18.3 American Tartaric Products
- 18.4 Cargill
- 18.5 Distillerie Mazzari S.p.A.
- 18.6 Australian Tartaric Products
- 18.7 The Tartaric Chemicals Corporation
- 18.8 Sagar Chemicals
- 18.9 RANDI GROUP
- 18.10 Caviro Distillerie
- 18.11 Distillerie Bonollo
- 18.12 Other Relevant Market Participants
Note: Every listed company is profiled on the structure shown under the first company. The company list is preliminary and may change based on research findings, market developments, data availability and client requirements.
Chapter 19 Disclaimer
- 19.1 Research and Forecast Disclaimer
- 19.2 Data Source and Estimation Limitations
Note: The depth of individual sections depends on data availability for this market. Volume, capacity, trade and other unit-based metrics are included where applicable.

