Market Overview
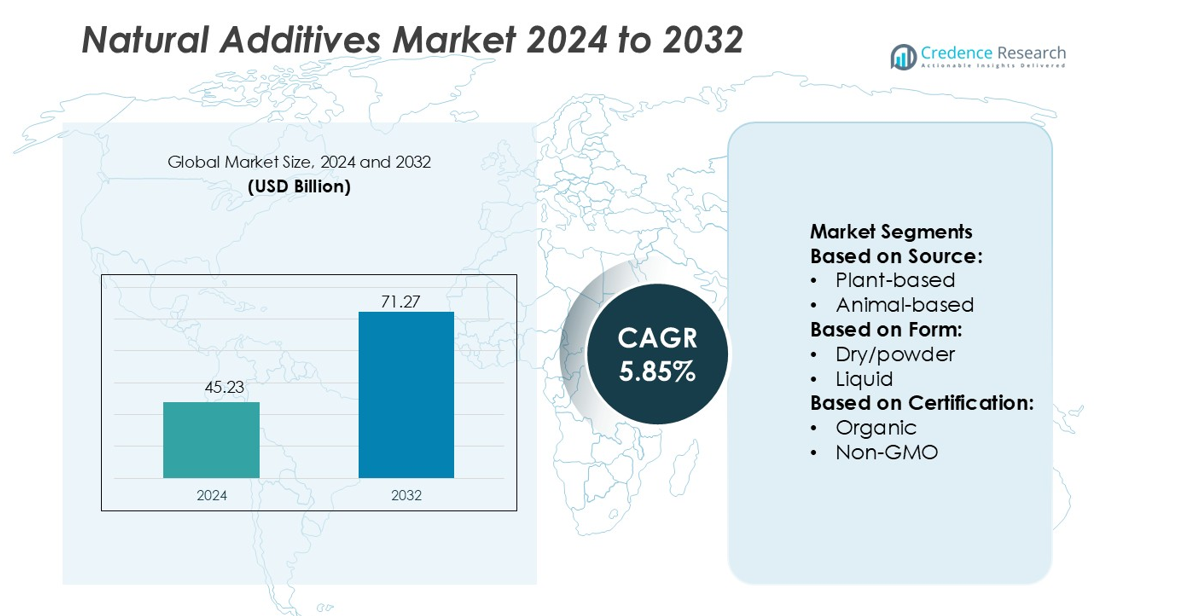
Natural Additives Market size was valued USD 45.23 billion in 2024 and is anticipated to reach USD 71.27 billion by 2032, at a CAGR of 5.85% during the forecast period.
| REPORT ATTRIBUTE |
DETAILS |
| Historical Period |
2020-2023 |
| Base Year |
2024 |
| Forecast Period |
2025-2032 |
| Natural Additives Market Size 2024 |
USD 45.23 billion |
| Natural Additives Market, CAGR |
5.85% |
| Natural Additives Market Size 2032 |
USD 71.27 billion |
The natural additives market includes major players such as ADM, Ingredion, Tate & Lyle Plc, DSM, Ajinomoto Co., Inc., Cargill, Incorporated, BASF SE, Givaudan, International Flavors & Fragrances Inc. (IFF), and Biospringer. These companies focus on clean-label innovation, sustainable sourcing, fermentation technologies, and plant-based ingredient expansion. Partnerships with food and beverage manufacturers strengthen product portfolios across bakery, dairy, beverages, and snacks. North America stands as the leading region, holding 30% of the global market share, supported by strong consumer preference for chemical-free ingredients, strict regulatory standards, and rapid adoption of organic, non-GMO, and allergen-free formulations. Continuous investments in R&D and transparent labeling strategies reinforce the region’s leadership.
Market Insights
- The Natural Additives Market was valued at USD 45.23 billion in 2024 and will reach USD 71.27 billion by 2032 at a 5.85% CAGR, driven by growing demand for safe and clean-label ingredients.
- Rising health awareness and strict food labeling rules push food producers to replace synthetic colors, preservatives, and sweeteners with plant-based and fermentation-derived additives, making plant-based ingredients the largest segment with the highest adoption in bakery, dairy, and beverages.
- Leading companies expand portfolios through sustainable sourcing, bioprocessing, and product innovation, while partnerships with food manufacturers help strengthen presence in snacks, confectionery, and dairy applications.
- High production costs, raw material availability, and limited shelf-life stability act as restraints, slowing adoption in price-sensitive markets and small-scale processing units.
- North America holds 30% of the global market share, supported by strong regulatory compliance and consumer preference for organic and non-GMO products, while Asia Pacific records the fastest growth due to rising processed food demand.
Access crucial information at unmatched prices!
Request your sample report today & start making informed decisions powered by Credence Research Inc.!
Download Sample
Market Segmentation Analysis:
By Source
In the natural additives market, the plant-based sub-segment leads with a 42.6% share in 2024. This growth is driven by increasing consumer preference for plant-derived, sustainable, and vegan-friendly ingredients. Food and beverage manufacturers are incorporating botanical extracts, herbs, and spices to meet the demand for clean-label and natural products. Ethical concerns and regulatory challenges limit the adoption of animal-based additives, while microbial/fermentation and mineral-based sources expand steadily but remain smaller in market share. The plant-based segment continues to benefit from global trends favoring plant-derived nutrition and functional benefits.
- For instance, ADM operates a large amino acid production facility in Decatur, Illinois. The company announced a plan to expand the facility to produce up to 340,000 metric tons of lysine or threonine annually, primarily for animal feed application
By Form
Within the form segment, dry/powder dominates with a 56.2% share in 2025. Its popularity stems from advantages such as longer shelf life, easier storage, cost-effective transportation, and seamless integration into industrial food production lines. Powdered additives are widely used in bakery, snacks, and beverage applications, where precise dosing and stability are critical. Liquid and other forms are gaining adoption in niche applications like beverages and sauces, but their higher costs and shorter shelf life limit widespread use. Dry/powder remains the preferred choice for large-scale processing.
- For instance, Jungbunzlauer’s Port Colborne facility handles a maximum corn throughput of 1,651 tonnes per day for conversion into acids, citrate salts, glucose syrup, and derivatives.
By Certification
In terms of certification, the natural certified sub-segment leads, valued at USD 13.4 billion in 2024. This is fueled by rising consumer awareness about ingredient transparency, minimal processing, and clean-label demands. Brands leverage natural certifications to differentiate products and build consumer trust. Organic, non-GMO, and clean-label certified sub-segments are expanding, but the broader natural claim dominates because it is easier to comply with, widely recognized, and applicable across diverse food categories. Regulatory support for natural labeling further reinforces growth in this sub-segment.
Key Growth Drivers
Rising Consumer Demand for Clean Label Products
Consumer preference for natural and minimally processed foods is fueling the natural additives market. Increasing awareness about health and wellness drives manufacturers to replace synthetic additives with plant-based, organic, and non-GMO alternatives. For instance, Cargill’s introduction of organic starches and natural flavor enhancers in 2025 expanded its clean-label portfolio, meeting rising demand in bakery and beverage sectors. Regulatory incentives and certifications for natural ingredients further encourage adoption. This shift supports market expansion, particularly in regions like North America and Europe, where clean-label transparency strongly influences purchasing decisions.
- For instance, Brenntag operates a global network of 31 Food & Nutrition Innovation & Application Centers globally, which assist customers in developing acidulant formulations tailored to processed foods.
Expansion of E-commerce and Digital Distribution Channels
E-commerce platforms enable faster access and broader reach for natural additives. Suppliers leverage online marketplaces for bulk sales, subscription-based deliveries, and B2B procurement, reducing dependence on traditional distribution networks. Companies like International Flavors & Fragrances (IFF) report improved visibility and sales performance by integrating digital ordering and certification transparency. This trend allows smaller producers to enter new regions and provides real-time customer feedback. Enhanced supply chain efficiency, coupled with direct access to end-users, strengthens market penetration and boosts revenue potential across both mature and emerging markets.
- For instance, BASF launched Irganox® 1010 BMBcert™ and Irganox® 1076 BMBcert™, the industry’s first biomass-balance certified antioxidant additives for plastics. These products have been verified to reduce the cradle-to-gate carbon footprint by up to 60% (percent) versus conventional grades.
R&D Innovation and Technological Advancements
Continuous innovation in extraction methods, formulation, and stabilization of natural additives drives growth. BASF, for example, developed enzyme-based solutions tailored for low-temperature food processing and beverage applications in 2025. Advanced microbial fermentation techniques and plant-based formulations enhance product efficacy, shelf-life, and functional benefits. Investments in R&D enable customization for diverse food applications and regulatory compliance. Companies adopting such innovations gain competitive advantages and strengthen their product portfolios. Enhanced technological capabilities expand applications, attract new clients, and support the market’s transition toward natural, sustainable, and high-performance ingredients.
Key Trends & Opportunities
Shift Toward Plant-Based and Functional Ingredients
The growing popularity of plant-based diets and functional foods creates opportunities for natural additives. Ingredients such as plant proteins, natural emulsifiers, and dietary fibers are increasingly incorporated into beverages, snacks, and dairy alternatives. This trend is accelerated by lifestyle changes and health-conscious consumer behavior. Companies like DSM and ADM are expanding portfolios to include functional natural additives that improve nutritional content and sensory experience. The trend also supports regulatory compliance and sustainability goals, offering manufacturers the chance to develop innovative products that cater to evolving dietary patterns.
- For instance, Frutarom introduced CitrOlive, a patented natural ingredient combining olive and citrus extracts. In a 90-day double-blind trial at Murcia University, subjects taking 500 mg/day showed statistically significant reductions in oxidized LDL and triglyceride biomarkers versus placebo.
Geographical Expansion in Emerging Markets
Emerging regions in Asia-Pacific, Latin America, and the Middle East present significant growth opportunities due to rising disposable income and industrial food production. Companies are investing in local production facilities and partnerships to meet regional demand for organic and non-GMO ingredients. For instance, Givaudan has expanded its flavor and natural additive production in India and Southeast Asia. Such expansion reduces logistic costs, strengthens supply chains, and improves market accessibility. Localized offerings also help address specific consumer preferences, creating a competitive edge and accelerating revenue growth in untapped markets. For instance, Camlin markets Xtendra antioxidant solutions, successful initiation of commercial production of vanillin (brand name adorr) at the Dahej facility with a capacity of 6,000 metric tons per annum (MTPA).
- For instance, Camlin markets Xtendra antioxidant solutions, successful initiation of commercial production of vanillin (brand name adorr) at the Dahej facility with a capacity of 6,000 metric tons per annum (MTPA).
Growing Adoption in Functional Beverages and Clean-Label Snacks
Natural additives are increasingly applied in health-focused beverages and ready-to-eat snacks. This trend aligns with consumer preferences for immunity-boosting, low-calorie, and preservative-free options. Companies are leveraging natural flavors, colors, and stabilizers to enhance product appeal while maintaining nutritional value. IFF, for example, expanded its portfolio of clean-label flavors for beverages in 2024, demonstrating high adoption rates. This opens new revenue streams for manufacturers and supports innovation in functional food formulations. As the demand for healthier, ready-to-consume products grows, natural additives play a central role in product differentiation.
Key Challenges
High Raw Material Costs and Supply Volatility
Natural additives rely heavily on agricultural and botanical raw materials, which are susceptible to climate change, seasonal fluctuations, and price volatility. Limited availability of organic and non-GMO crops increases production costs and may disrupt supply chains. Companies such as Tate & Lyle have reported challenges in sourcing high-quality natural fibers due to inconsistent crop yields. These constraints can reduce profit margins, slow product development, and affect market competitiveness. Manufacturers must implement robust sourcing strategies, diversify suppliers, and explore alternative raw materials to mitigate cost pressures and ensure consistent supply.
Stringent Regulatory Compliance and Certification Requirements
Meeting global regulatory standards for natural additives poses significant challenges. Certifications for organic, non-GMO, and clean-label products require detailed documentation, testing, and compliance with region-specific safety laws. Failure to comply can lead to product recalls, fines, or market restrictions. Companies like Cargill and ADM invest heavily in regulatory monitoring and quality assurance systems. Navigating diverse standards across regions increases operational complexity and time-to-market. Continuous updates in labeling, claims substantiation, and quality control are necessary to maintain consumer trust and access key international markets.
Regional Analysis
North America
North America leads the natural additives market with a 30% share. The region benefits from strong consumer demand for clean-label and chemical-free ingredients. Food and beverage brands reformulate products using plant-based colors, flavors, and preservatives to meet FDA and USDA guidelines. Investments in sustainable sourcing and bioprocessing also rise across the U.S. and Canada. Large enterprises adopt organic and non-GMO certified inputs to improve transparency. Growing retail sales of natural bakery, snacks, and beverages strengthen ingredient demand. High spending power and strict labeling rules continue to drive adoption across processed foods and nutraceuticals.
Europe
Europe accounts for 28% of the global market share, supported by strict regulatory frameworks such as EFSA and REACH. Manufacturers use natural flavor enhancers, stabilizers, and sweeteners to comply with clean-label mandates. Consumers prefer organic, allergen-free, and non-synthetic ingredient lists, which boosts procurement from certified suppliers. Countries like Germany, France, and the U.K. lead innovation in botanical extracts and fermentation-based additives. Growth in vegan and plant-based meals also increases natural colorant and texturizer usage. Strong traceability standards and sustainability commitments ensure continuous demand.
Asia Pacific
Asia Pacific holds 25% market share, driven by rapid food processing expansion and rising health awareness. China, Japan, India, and South Korea invest in natural flavors, functional extracts, and enzyme-based stabilizers for snacks, dairy, and beverages. Local producers expand sourcing of plant-derived additives like stevia, curcumin, and spirulina. Consumers shift toward chemical-free products due to clean-label marketing and safety concerns. Growth of packaged foods, bakery items, and convenience products accelerates ingredient substitution from synthetic to natural. Multinational companies continue to scale production facilities and e-commerce distribution in the region.
Latin America
Latin America holds a 10% market share, supported by rising adoption of natural antioxidants, sweeteners, and preservatives in processed foods. Brazil and Mexico drive most consumption due to expanding bakery, dairy, and beverage manufacturing. Consumers show growing interest in organic and reduced-chemical products. Local producers source botanical and fruit-based extracts to replace artificial ingredients. Regulatory agencies encourage safer labeling standards and allergen-free formulations. Foreign companies expand partnerships to improve ingredient availability and supply chain reach. Increasing exports of processed food products further boost natural additive utilization.
Middle East & Africa
The Middle East & Africa represent 7% market share, with gradual adoption of clean-label ingredients across beverages, snacks, and dairy. Saudi Arabia, UAE, and South Africa lead demand, driven by rising retail sales of natural and premium food products. Importers supply plant-based flavors, colors, and stabilizers due to limited regional production. Food processing companies replace synthetic additives in compliance with stricter safety norms and consumer awareness. The hospitality and packaged food sectors also strengthen usage. Increased investments in halal-certified and allergen-free ingredients create additional opportunities for global suppliers.
Market Segmentations:
By Source:
By Form:
By Certification:
By Geography
- North America
- Europe
- Germany
- France
- U.K.
- Italy
- Spain
- Rest of Europe
- Asia Pacific
- China
- Japan
- India
- South Korea
- South-east Asia
- Rest of Asia Pacific
- Latin America
- Brazil
- Argentina
- Rest of Latin America
- Middle East & Africa
- GCC Countries
- South Africa
- Rest of the Middle East and Africa
Competitive Landscape
The competitive landscape of the natural additives market includes Cargill, Incorporated; International Flavors & Fragrances Inc. (IFF); Givaudan; Biospringer; Ingredion; DSM; Ajinomoto Co., Inc.; Tate & Lyle Plc; BASF SE; and ADM. The natural additives market centers on clean-label ingredient innovation, sustainable sourcing practices, and advanced bioprocessing technologies. Companies invest heavily in research to develop plant-based flavors, natural sweeteners, enzymes, and fermentation-derived additives that serve as safer replacements for synthetic chemicals. Strategic mergers, acquisitions, and production capacity expansions help firms secure raw materials and strengthen global reach. Regulatory pressure and rising consumer awareness encourage manufacturers to adopt certified organic, non-GMO, and allergen-free formulations. Digital distribution channels and partnerships with regional food processors increase market presence across emerging economies. As regulatory frameworks tighten, companies with robust traceability systems, transparent labeling, and sustainability commitments gain a clear competitive advantage.
Shape Your Report to Specific Countries or Regions & Enjoy 30% Off!
Key Player Analysis
Recent Developments
- In March 2025, Cargill opened a new corn milling plant in Gwalior, Madhya Pradesh, operated by Indian manufacturer Saatvik Agro Processors, to meet increasing demand from India’s confectionery, infant formula, and dairy industries.
- In July 2024, Tate & Lyle launched Optimizer Stevia 8.10, a new stevia formulation designed to provide manufacturers with a budget-friendly sweetener alternative. Optimizer Stevia 8.10 closely mimics the taste of sugar, even at elevated sugar replacement ratios. This stevia variant is more economical, delivering enhanced value over other premium stevia sweeteners.
- In March 2024, BASF introduced a new flavor from its Isobionics portfolio. The newly launched product, Natural Beta-caryophyllene 80, boasts an aromatic profile reminiscent of herbaceous notes, with hints of green parsley, black pepper, grapefruit, and a touch of clary sage
Report Coverage
The research report offers an in-depth analysis based on Source, Form, Certification and Geography. It details leading market players, providing an overview of their business, product offerings, investments, revenue streams, and key applications. Additionally, the report includes insights into the competitive environment, SWOT analysis, current market trends, as well as the primary drivers and constraints. Furthermore, it discusses various factors that have driven market expansion in recent years. The report also explores market dynamics, regulatory scenarios, and technological advancements that are shaping the industry. It assesses the impact of external factors and global economic changes on market growth. Lastly, it provides strategic recommendations for new entrants and established companies to navigate the complexities of the market.
Future Outlook
- Demand for clean-label and chemical-free ingredients will continue to rise across packaged foods.
- Food processors will replace synthetic preservatives, colors, and sweeteners with natural alternatives.
- Fermentation-based additives will gain wider adoption due to higher purity and efficiency.
- Plant-based extracts and enzymes will see strong growth in bakery, dairy, and beverages.
- Sustainable sourcing and traceability systems will become standard requirements for suppliers.
- Regulatory bodies will enforce stricter labeling and safety guidelines for natural ingredients.
- Digital and e-commerce distribution channels will expand product availability in emerging markets.
- Producers will invest in bioprocessing and green extraction technologies to improve yield.
- Collaboration between ingredient makers and food manufacturers will accelerate product innovation.
- Consumer interest in organic, allergen-free, and non-GMO additives will drive long-term market expansion.



